The short version
- Over the past decade, VOO compounded at 15.4% annualized; VXUS at 9.7%. The 5.7-percentage-point gap is real, large, and almost entirely a story about one regime — US megacap tech leadership inside a strong-dollar window.
- Both funds sit at the floor on cost (0.03% vs 0.05%) with similar realized volatility (16.8% vs 16.0%). The decision is not about cost or risk; it is about how much US-specific concentration you want to carry into a 30-year horizon.
- For a long-horizon investor, a partial VXUS allocation is a hedge against US stagnation regimes the recent data cannot describe — not a bet on imminent ex-US outperformance.
An investor choosing between Vanguard's S&P 500 ETF (VOO) and its ex-US complement (VXUS) is really choosing between two different bets about the next thirty years, not the last ten. The recent data favors US concentration unambiguously. The longer-run record — country-leadership cycles back to 1900 — says the order rotates. Both can be true at once, and that is the discomfort the decision has to sit with.
Context: what each fund actually owns
VOO tracks the S&P 500, roughly 500 US large-caps weighted by float-adjusted market capitalization. AUM as of fetch date is $1.53 trillion (yfinance, 2026-05-07) — among the largest ETFs in existence. Top-of-book liquidity is exceptional; bid-ask spreads typically run a fraction of a basis point during US trading hours. The S&P 500 selection committee applies explicit profitability and listing screens, which gives the index a quiet quality tilt that a pure cap-weight construction would not have.
VXUS tracks the FTSE Global All Cap ex US Index, roughly 8,500 companies across developed Europe, developed Asia-Pacific (Japan, the UK, Australia), Canada, and emerging markets including India, China, Taiwan, Korea, and Brazil. AUM is $594.3 billion (yfinance, 2026-05-07). Spreads are wider than VOO's but still tight by any reasonable standard, and the underlying market-capture is genuinely broad — a single fund covers ex-US large, mid, and small caps in one line.
Their methodologies are not directly comparable. Part of VOO's apparent quality bias comes from index construction, not just regional performance. Worth flagging up front, because the comparison is not apples-to-apples in the way "S&P 500 vs Russell 1000" would be.
Headline data
| Metric | VOO | VXUS |
|---|---|---|
| Issuer | Vanguard | Vanguard |
| Index tracked | S&P 500 | FTSE Global All Cap ex US |
| Expense ratio | 0.03% | 0.05% |
| AUM | $1.53T | $594.3B |
| Distribution yield (TTM) | 1.1% | 2.8% |
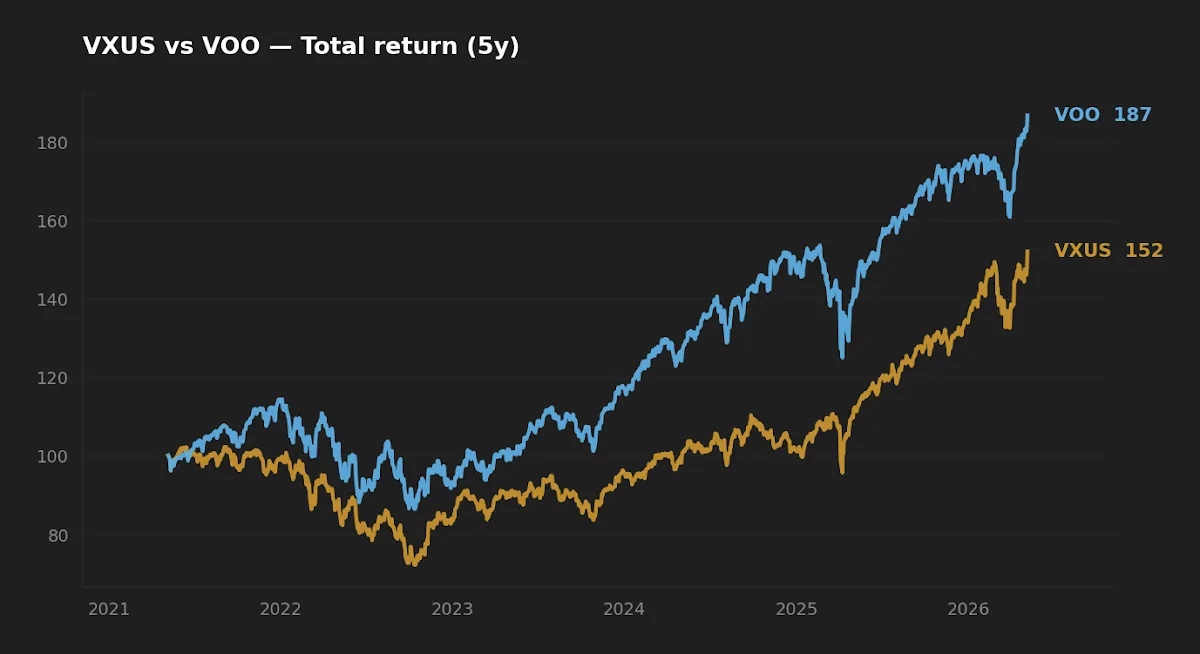
| 5Y CAGR | 13.6% | 9.3% |
| 10Y CAGR | 15.4% | 9.7% |
| 5Y annualized vol | 16.8% | 16.0% |
| 5Y max drawdown | −24.5% | −29.4% |
| Approx holdings | ~500 | ~8,500 |
Source: yfinance, fetched 2026-05-07. Issuer detail pages: VOO, VXUS.
Cost: real but not the deciding variable
The two-basis-point difference (0.05% − 0.03%) is the kind of thing that compounds over decades but does not drive the decision here. On a $50,000 position held for 25 years at an 8% gross return, the expense-ratio drag differential is roughly $2,500 — meaningful but not decisive. Both products sit at or near the floor of what is achievable in cap-weighted index exposure.
What does shape after-tax outcomes is the often-overlooked variable on VXUS: foreign dividend tax withholding. Underlying companies pay dividends; foreign jurisdictions withhold tax before the fund receives them. In a US-resident taxable account, the foreign tax credit typically recovers most of this leakage at year end. In an IRA or 401(k), there is no credit to claim, and the withholding becomes a permanent — though small — drag. For a Korean or other non-US investor, the structure of withholding-treaty interaction is different and worth verifying with one's broker.
The ten-year return gap and what it does (and does not) tell us
Over the past decade, VOO compounded at 15.4% annualized; VXUS at 9.7%. That is a 5.7-percentage-point gap. Compounded over ten years, $10,000 at VOO's rate becomes roughly $41,800; at VXUS's rate, roughly $25,200. The 5Y window is similarly tilted: 13.6% vs 9.3%.
Three things are true about that gap simultaneously, and a serious investor has to hold all three at once:
First, it is real. The magnitude of US large-cap outperformance from roughly 2014 onward is one of the largest sustained relative runs in modern market history. The data is not noise.
Second, it is regime-specific. The window covers a period of secularly low rates (until late 2022), persistent dollar strength, and a megacap tech-led concentration that is now itself the highest in the S&P 500's recorded history — the top 10 names represent roughly a third of the index. None of those three conditions is a permanent feature of markets.
Third, it does not predict the next ten years. The Dimson, Marsh and Staunton long-run dataset (back to 1900) shows no single national market staying on top across all rolling multi-decade windows. Country leadership cycles. The current ten-year sample is one regime; a thirty-year holding period almost certainly contains several.
VOO's ten-year lead over VXUS is real, regime-specific, and silent on the next ten years — all three at once.
The more honest question than "did VOO win?" — it did — is "what is VOO's expected return given current valuation and concentration?" The S&P 500's forward CAPE sits well above its long-run average; Vanguard's own Capital Markets Model has US large-cap in the low single digits annualized over the coming decade and ex-US developed and emerging in a notably higher band. These forecasts are model-dependent and should not be treated as point estimates, but they are an honest reminder that backwards-extrapolation from a recent-decade window is the cardinal sin of long-horizon investing. For a longer treatment of why the pure-VOO portfolio leaves something on the table, see Why VOO Is Not Enough.
Realized risk: drawdowns and what they mask
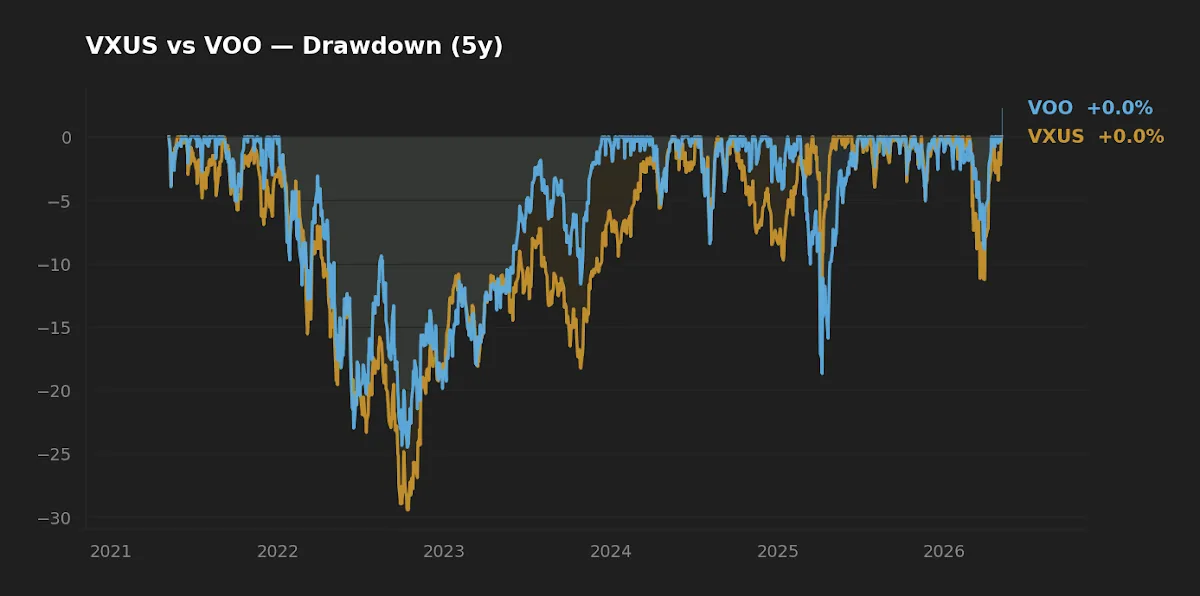
VXUS's deeper 5Y max drawdown (−29.4% vs −24.5%) does not make it the riskier asset on every dimension. Two points usually flattened by a single max-drawdown number:
Drawdown timing matters. The 2022 episode was a US-tech-led drawdown driven by rate normalization. Ex-US, with its lower duration profile and value-tilted sector composition, bottomed shallower and earlier in that cycle than the Nasdaq cohort. The 2020 COVID drawdown is a different shape entirely. A single max-drawdown number averages across episodes that have very different correlation behavior, which is precisely the information a diversification decision needs.
Currency moves on top. VXUS USD-denominated returns are a compound of local equity returns and FX translation. The 2014–2024 window has been broadly USD-strengthening — a persistent headwind on VXUS that has flattered VOO's relative numbers. Reverse the sign on the dollar and a meaningful fraction of the historical underperformance disappears, even before any change in underlying equity returns. FX direction is genuinely unforecastable, which is the point: it is a source of randomness on top of equity returns, not a tilt that can be reliably timed.
The 5Y annualized volatilities (16.8% VOO vs 16.0% VXUS) are close enough to call equivalent. Concentration in the top of VOO has caused realized vol to creep up over the last few years; broad ex-US diversification has held VXUS's vol roughly stable across the same window.
Macro overlay (as of fetch)
A few markers to anchor where pricing sits today: the 10-year Treasury yields 4.43%, the Fed Funds rate is 3.64%, headline CPI is running at 3.3% year-over-year, and the VIX prints at 17.4 (FRED, asof 2026-05-05, 2026-04-01, 2026-03-01, 2026-05-05 respectively). With the 10Y at 4.43% and VOO yielding 1.1%, the implied US large-cap equity-risk-premium proxy is compressed; VXUS at 2.8% sits closer to a competitive yield against Treasuries, although its dividend stream is structurally more cyclical. None of this is a directional call. It is a prompt to be honest about where current pricing sits relative to long-term averages.
The diversification case that survives the data
Even granting that the recent decade favors VOO, the structural case for partial ex-US allocation rests on two arguments the backwards-looking data cannot test directly:
Idiosyncratic country risk. Any single nation can experience policy shocks, fiscal crisis, war, or extended stagnation. Japan from 1990 onward is the canonical example: a generation of effectively zero real return for an investor who held only Topix. Nothing in the US's last decade rules that scenario out structurally; it just makes it feel implausible right now, which is the moment when diversification is cheapest to buy.
Mean reversion in valuation spreads. Ex-US developed and emerging markets currently trade at substantially lower CAPE multiples than the S&P 500. Whether the spread compresses, stays wide, or widens further is unknowable. The spread itself, however, is a measurable fact, and across rolling decades historically the cheaper book has tended to deliver higher subsequent real returns on average. "On average" obscures wide variance, but it is not nothing.
For the cleaner standalone case for ex-US in a long-term portfolio, see Do You Really Need International Exposure?.
What this comparison can and can't tell you
What the data can tell you, with reasonable confidence: cost structure (both funds are at the floor); diversification breadth (VXUS holds roughly 17× as many securities; VOO is more concentrated than its own historical norm); recent realized return and risk over a single regime.
What it cannot tell you: expected return over the next thirty years for either fund — no five- or ten-year window can; how a VXUS-like portfolio would have behaved during 1968–1980 (US stagflation, ex-US relative outperformance) or other regime boundaries the data window does not span; what the dollar will do, which is non-trivially a part of VXUS's USD return; tax outcomes specific to your account type, jurisdiction, and bracket.
At-a-glance scoreboard
| Category | Better-fit fund | Margin |
|---|---|---|
| Cost | VOO | Marginal — 2 bp |
| Realized return (5Y / 10Y) | VOO | Material — 4–6 pp/yr |
| Realized risk (5Y vol) | VXUS | Marginal — 80 bp |
| Drawdown depth (5Y) | VOO | ~5 pp shallower |
| Diversification breadth | VXUS | Decisive — 17× holdings |
| Distribution yield | VXUS | ~170 bp higher |
| Standalone long-term core | VOO | Caveat: regime-dependent |
| Hedge against US-specific stagnation | VXUS | By construction |
Scenarios where each fund fits
- 30-year horizon, US-resident, building from zero: a US-equity-anchored portfolio on VOO is defensible. The cost of layering 10–30% VXUS on top is small; the insurance value if US large-cap leadership rotates is non-zero. Reasonable to do either; the decision is a function of how much regret one would feel under each tail.
- Already long US large-cap via compensation (RSUs, ESPP, single-stock): the marginal diversification value of broad ex-US is materially higher. VXUS-leaning becomes more compelling, because the existing portfolio is already concentrated in the same factor exposures VOO carries.
- Income-focused, taxable account: VXUS's higher distribution yield (2.8% vs 1.1%) is mostly qualified for US investors holding the fund directly, but the QDI percentage on Vanguard's tax documents varies year to year — verify before relying on it. Foreign tax credit is only available in taxable accounts, which marginally favors holding VXUS there rather than in an IRA if both options exist.
- KRW-based investor wanting global market-cap exposure: a VOO + VXUS pair maps approximately to the global float-adjusted equity market in USD. Korean-listed equivalents (e.g., TIGER 미국S&P500, KODEX 선진국MSCI) cover the US large-cap portion but are not substitutes for VXUS-style ex-US-of-everywhere coverage; the global-ex-US sleeve is harder to replicate cleanly on the KRX.
Editor's read
The editor's lean is to hold both, with a US tilt — not because ex-US is expected to outperform over the next decade (the editor has no view that survives outside-view skepticism on that question), but because a thirty-year horizon almost certainly contains regimes the last ten years cannot describe, and because adding partial VXUS exposure is among the cheapest hedges available against US-specific stagnation. The editor would not be comfortable holding a 100% VOO core at this point in the cycle, and would also not be comfortable arguing for a VXUS-heavy core given the structural advantages of holding shares in companies that pay you in your spending currency. A modest tilt toward home-currency exposure with a meaningful ex-US sleeve is the position that survives the most scenarios, even if it underperforms in any single one.
Editor's holdings disclosure
The editor holds both VOO and VXUS in the long-term core sleeve, with a US-tilted weighting. Specific allocations are not disclosed.
FAQ
Should I just hold VOO and skip VXUS entirely?
You can. A pure-VOO long-term portfolio has worked for the last decade and has the simplicity advantage of one ticker. The honest counter is that the next decade's regime is unknown and the cost of insurance via VXUS is small. Reasonable people land on different answers; the test is whether you can hold the position you choose through a regime in which it is the wrong answer.
Is the 5Y / 10Y CAGR gap a reason to overweight VOO going forward?
Not on its own. Recent-window outperformance is a poor predictor of next-window outperformance — the academic literature on this is consistent. Use the gap as evidence of what the recent regime rewarded, not as a forecast.
How does foreign dividend tax withholding actually affect VXUS?
Underlying foreign companies pay dividends; foreign jurisdictions withhold tax before VXUS receives them. Vanguard reports the foreign tax paid on Form 1099-DIV. In a US taxable account, you can typically claim the foreign tax credit and recover most of the withholding. In a US IRA or 401(k), there is no credit available, so the withholding is a small permanent drag — usually estimated at 0.2–0.4% per year depending on the dividend yield and average withholding rate. For non-US investors, treaty terms and broker structure determine the actual outcome.
What about VT (total world) instead of pairing VOO and VXUS?
VT holds a market-cap-weighted single-fund version of the global equity market — currently about 60% US, 40% ex-US — at a 0.06% expense ratio. It is genuinely simpler. The tradeoff is that you lose control over the US/ex-US ratio and cannot tilt the mix to match your situation (e.g., to reduce US weight if you have RSUs). Pair-holding gives you that flexibility; VT gives you fewer decisions.
Does VXUS include emerging markets?
Yes. VXUS holds approximately 25% emerging-market exposure within its ex-US allocation, including positions in Taiwan, India, China, Korea, and Brazil among others. If you want to control the developed/emerging split explicitly, the VEA + VWO pair is the equivalent two-fund version.
Key takeaways
- VOO has materially outperformed VXUS over the recent decade (15.4% vs 9.7% CAGR). The data is real, regime-specific, and a poor predictor of the next decade.
- Both funds are at the floor on cost (0.03% vs 0.05%). Cost is not the deciding variable.
- VXUS's structural case rests on hedging idiosyncratic country risk and capturing valuation-spread mean reversion — both arguments the recent data cannot test, both grounded in long-run evidence.
- Currency exposure inside VXUS is a feature, not a bug, but it adds an unforecastable layer on top of equity returns. A weakening-USD regime would meaningfully change the historical comparison.
- For most long-horizon investors, a pair-held portfolio with a US tilt survives more scenarios than either pure VOO or pure VXUS — at the cost of being the wrong answer in any specific single-regime window.
Methodology
Price, return, AUM, expense ratio and distribution yield data were pulled from yfinance on 2026-05-07. CAGRs are computed on total-return series over the trailing 5- and 10-year windows ending on the fetch date; volatility and max-drawdown figures are derived from the same daily total-return series, annualized using a 252-day convention. Macro markers (10Y Treasury, Fed Funds, CPI YoY, VIX) are sourced from FRED with as-of dates noted inline. Expense ratio and index methodology details are cross-checked against Vanguard's investor product pages. Forward-return discussion references Vanguard Capital Markets Model (VCMM) outputs as published in Vanguard's quarterly Economic and Market Outlook; specific point forecasts shift between publications and should be checked against the most recent issue.
Written by the Mulden editor. This article is for educational purposes and does not constitute personalized financial advice. See Disclaimer.