The short version
- AVUV is a small-cap-value factor sleeve built on the Fama-French academic playbook. SYLD is an all-cap rules-based screen on dividends, buybacks, and debt paydown. They sometimes get filed together because both have a "value" flavor, but they are answering different questions.
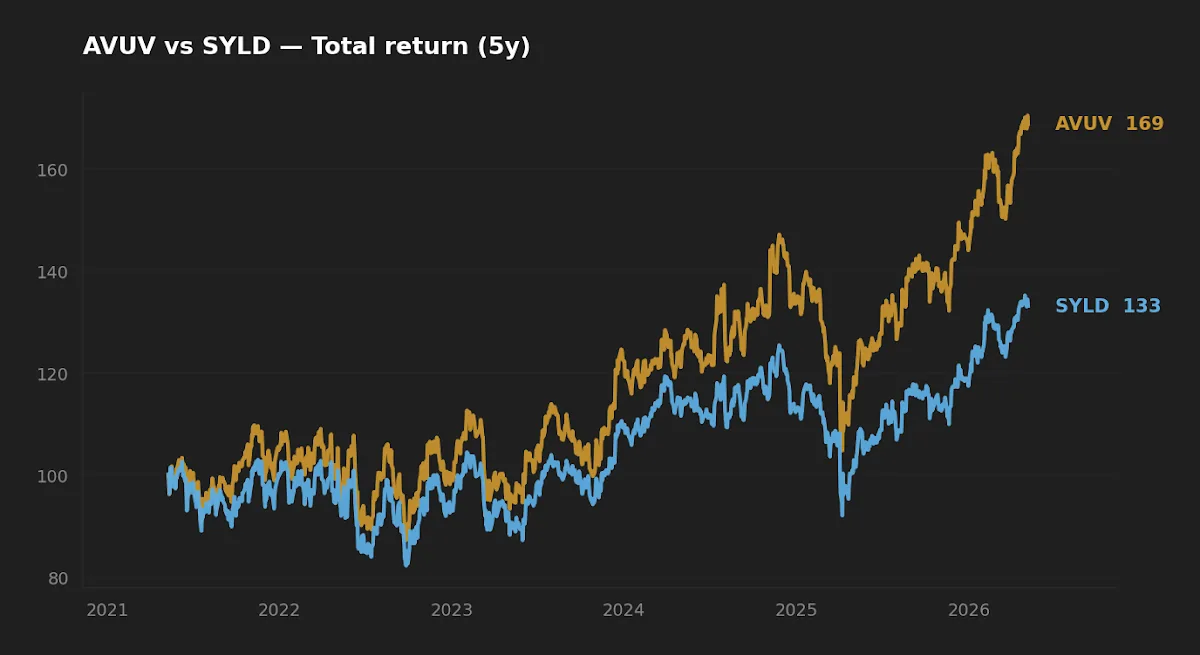
- Over the trailing five years AVUV's 11.4% CAGR beat SYLD's 6.6%. SYLD's 10Y CAGR of 12.5% catches a regime AVUV simply was not alive for, so the five-year gap is real but the five-year verdict is partial.
- Bottom line: for an investor adding a small-cap value tilt to broad US exposure, AVUV is the cleaner instrument. SYLD belongs in a different conversation — concentrated exposure to capital-return discipline, not value-as-factor.
Both AVUV and SYLD get sorted into the "value" bin on most retail ETF screeners, and both pitch themselves as disciplined alternatives to cap-weighted indexing. The labels rhyme. The construction does not. AVUV is a small-cap-value factor sleeve built on the Fama-French research tradition, and SYLD is a rules-based screen that ranks the entire US market by combined shareholder yield — dividends paid plus net buybacks plus net debt paydown. Reading them as substitutes is a category error that compounds in a portfolio for years.
This piece compares them on what they actually do. Live total-return data is from yfinance through 2026-05-05. The macro frame: 10-year Treasury at 4.43%, federal funds rate at 3.64%, CPI running at 3.3% year-over-year, VIX at 17.4 (FRED, asof 2026-05-05).
What each fund is actually doing
AVUV (Avantis US Small Cap Value ETF) launched in late 2019 and now manages roughly $26.2B. The mandate is straightforward: small-cap US equities filtered for low price-to-book and high profitability — the "value plus quality" intersection that the academic factor literature, and Fama and French's 2015 five-factor model in particular, identifies as the more durable version of the value premium. Avantis runs it as a quasi-active vehicle, which lets the portfolio managers smooth trading frictions and avoid the mechanical reconstitution dates that pure index funds suffer through. The 0.25% expense ratio is competitive for a factor-tilted active fund of this depth. Holding it honestly means accepting the long, ugly stretches when the small-cap-value factor pays nothing.
SYLD (Cambria Shareholder Yield ETF) has been live since May 2013, currently manages about $1.0B, and screens for companies with the highest combined "shareholder yield" — dividends plus net buybacks plus net debt paydown, expressed as a percentage of market cap. It is rules-based and quantitative, but it is not "AI-driven", whatever third-party copy occasionally implies. Cambria's documentation describes a deterministic accounting screen, not a machine-learning model. The fund is also not exclusively small-cap; the universe is all-cap, though the screen tends to land in the mid-and-small-cap zone because larger firms less often run sustained buybacks and debt reduction at the same time. The 0.59% expense ratio reflects active screening overhead and a much smaller asset base.
The conceptual distance matters. AVUV pays you for sitting through a known factor risk premium, with profitability as a screen against the worst value traps. SYLD pays you for a behavioral hypothesis: that managers who consistently return capital to shareholders are, on average, allocating it better than managers who do not. These are different bets that occasionally rhyme.
The data table
| Metric | AVUV | SYLD |
|---|---|---|
| Expense ratio | 0.25% | 0.59% |
| AUM | $26.2B | $1.0B |
| Inception | 2019-09-24 | 2013-05-13 |
| Distribution yield | 1.3% | 1.8% |
| 5Y CAGR | 11.4% | 6.6% |
| 10Y CAGR | n/a (fund younger) | 12.5% |
| 5Y annualized vol | 22.8% | 20.8% |
| 5Y max drawdown | −28.8% | −26.6% |
Sources: yfinance daily total-return series, asof 2026-05-05. Expense ratio, AUM, and inception cross-checked against the Avantis AVUV fact sheet and the Cambria SYLD fact sheet.
The five-year window is one regime, not the verdict
AVUV's 11.4% trailing five-year CAGR comfortably beats SYLD's 6.6% over the same window. That is roughly 480 basis points per year compounded across five years — large enough that no long-horizon investor can wave it away. But the window matters more than the headline. AVUV's entire live history begins in late 2019, so its five-year track record is also its complete track record. SYLD has lived through 2013–2019 as well, and its 10-year CAGR of 12.5% is a more honest representation of what shareholder-yield investing has historically delivered through several regimes.
The five-year window also happens to contain small-cap value's strong post-2020 recovery, which AVUV rode aggressively. SYLD's all-cap construction underweighted that specific tailwind by design. If the five-year gap is doing all the work in your decision, you are implicitly betting that the next five years rhyme with the last five — which the small-cap-value literature, going back to Fama and French (1992) and reinforced by long stretches of factor underperformance through the 2010s, gives no reason to assume.
Realized risk: similar shape, slightly different bruise
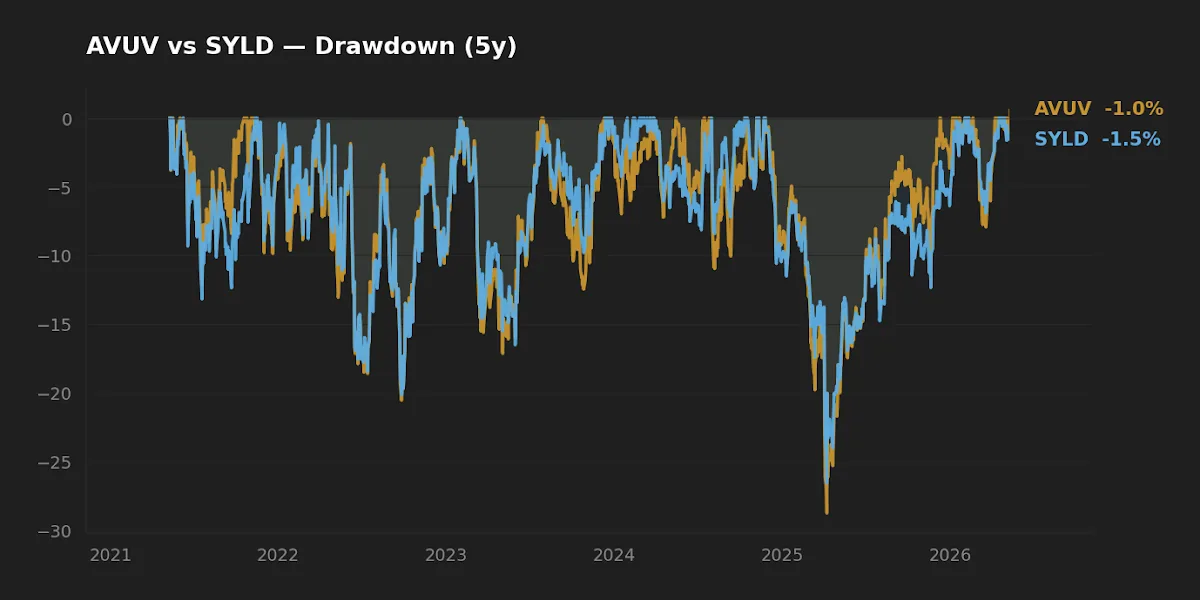
The drawdown profiles are closer than the return spread suggests. AVUV bottomed at −28.8% during the 2022 cycle; SYLD at −26.6%. The two-percentage-point difference is real but modest, and both numbers sit within the range you would expect from non-large-cap US equity strategies during a rate-driven repricing. Annualized volatility echoes the same ranking — AVUV at 22.8%, SYLD at 20.8%. SYLD's slightly tamer ride comes from its all-cap exposure (large-cap names dilute small-cap variance), not from any defensive engineering in the screen.
Both samples have one important blind spot: neither has lived through a credit-driven recession. The 2022 drawdown was a rate shock, not a solvency event. Small-cap value tends to suffer the most in solvency stress, which is when the value-trap risk that AVUV's profitability screen is designed to mitigate gets tested in earnest. The honest read on both funds' realized risk is that they have been measured during one type of bad market, not the type of bad market that matters most for their underlying premia.
The honest comparison is not "small-cap value vs. shareholder yield". It is "factor exposure vs. behavioral signal" — and an investor confused about which one they are buying will end up disappointed in both.
Capacity, AUM scale, and the fee that gets paid every year
SYLD's roughly $1.0B AUM versus AVUV's $26.2B is about a 27× gap, and it has implementation consequences worth naming. Smaller funds carry wider bid-ask spreads on the secondary market, especially during stress (when an investor would most want to trade), and they carry a higher background closure risk as a category — not specifically a Cambria concern given their long operating history, but the structural baseline. Conversely, AVUV's scale brings its own second-order problem: as a small-cap fund grows, its capacity to express the small-cap factor degrades. At $26B in small-cap names, market-impact costs creep into every rebalance. This is not yet a crisis for AVUV, but it is the kind of slow drag that matters across multi-decade horizons.
The fee gap deserves its own honest accounting. The 34 basis point difference between SYLD's 0.59% and AVUV's 0.25% is paid every year regardless of whether SYLD's signal works. On a $50,000 position held for 25 years at 7% gross compounding, that drag costs roughly $20,000 in terminal wealth. Not catastrophic. Not nothing. The same compounding logic that justifies factor patience also makes recurring fee differences costly across decades — which is one reason a similar argument shows up in the quantitative comparison of SCHD and VIG.
Where they actually fit (and where they don't)
AVUV is the cleaner instrument when the goal is to add a small-cap-value tilt on top of broad US exposure. The case for that tilt — long-run premium, diversification away from cap-weighted concentration, patience as the price of admission — is well-traveled in the math behind adding AVUV and VXUS to a VOO-anchored core. The mandate maps directly onto thirty years of out-of-sample academic evidence.
SYLD is a different kind of holding. It works as a satellite for an investor who already has broad market exposure and wants concentrated exposure to a specific corporate-finance behavior — capital return discipline. It does not substitute for small-cap value, and it does not substitute for a broad dividend fund either, because the buyback and debt-paydown components mean a meaningful portion of the "yield" never lands as cash in the investor's account. The 1.8% distribution yield understates the actual signal SYLD is screening on.
The current macro frame nudges the read at the margin. With the 10-year Treasury at 4.43% and the federal funds rate at 3.64% (FRED, asof 2026-05-05), funding costs for highly levered small-caps remain meaningful. AVUV's profitability screen partially defends against the most fragile names. SYLD's debt-reduction component implicitly favors firms that have already deleveraged, which is structurally defensive in this rate regime — a feature worth naming, even if it is incidental to the fund's headline thesis.
At-a-glance scoreboard
| Category | Winner | Margin |
|---|---|---|
| Cost | AVUV | Material — 34 bp |
| Realized 5Y return | AVUV | Large — ~480 bp/yr |
| Long-cycle track record | SYLD | Only one with 10Y data |
| Realized 5Y drawdown | SYLD | Modest — ~2 pp shallower |
| Scale & liquidity | AVUV | ~27× AUM advantage |
| Theoretical clarity | AVUV | Cleaner factor mapping |
FAQ
Is SYLD really an AI-driven ETF?
No. Cambria's documentation describes SYLD as a quantitative, rules-based screen on dividends, net buybacks, and net debt reduction. The "AI-driven" label appears in some third-party marketing but does not match the underlying methodology. Calling SYLD AI-driven blurs what is, in practice, a deterministic accounting screen.
Why does AVUV beat SYLD over five years but lose to SYLD's ten-year history?
AVUV only began trading in late 2019, so its full live history overlaps with a strong post-pandemic recovery for small-cap value. SYLD's 10-year CAGR of 12.5% includes 2013–2019, when small-cap value broadly underperformed and shareholder-yield screens did better in relative terms. Different windows, different stories. Neither number is wrong; both are partial.
Can I hold both AVUV and SYLD?
You can, but the overlap is smaller than the "both feel valuish" intuition suggests — SYLD spans all market caps and weights by shareholder yield, while AVUV is small-cap-value-specific. The harder question is whether each holding has a clear portfolio-level reason. Holding two funds because both feel similar without explicit theses is closet diworsification.
Is SYLD's 0.59% fee justifiable?
It depends on how durable the shareholder-yield premium turns out to be. The strategy has academic support (Mebane Faber's research and the broader literature on capital-return discipline), but the fee is paid in every regime while the premium shows up only sometimes. The honest bar: an investor should be able to articulate why they believe SYLD's signal adds 60+ basis points of annualized excess return over a sensible benchmark across decades. If that bar is not clear, the lower-cost alternative usually wins.
How does the current rate regime affect either fund?
Small-cap value is sensitive to credit conditions and the cost of capital. With the 10-year Treasury at 4.43% and the federal funds rate at 3.64% (FRED, asof 2026-05-05), funding costs for highly levered small-caps remain pressured. AVUV's profitability screen partially defends against this; SYLD's debt-reduction component favors firms that have already deleveraged, which is incidentally defensive in the current backdrop.
What this comparison can and cannot tell you
It can tell you that the trailing five-year window favored AVUV decisively, that the funds have similar realized drawdowns, and that the cost gap is real. It cannot tell you whether the next five years will repeat. AVUV has no live data through a credit-driven recession; the 2022 drawdown was rate-driven, not solvency-driven, and small-cap value typically suffers most in solvency stress. SYLD's longer record helps but is still one fund's path through one set of regimes. By the standards of academic factor research, both samples remain short.
Scenarios where each fund fits
- Long-horizon investor building a tilted core portfolio: AVUV at 5–10% on top of broad US and ex-US exposure is the textbook small-cap value tilt. SYLD does not belong here unless the investor specifically wants shareholder-yield exposure as well.
- Investor who already owns VOO/VTI and wants a behaviorally-grounded satellite: SYLD at 3–5% is defensible. The case is "I want to overweight firms that return cash to shareholders," not "I want value exposure."
- Taxable account, dividend-focused investor: Neither is ideal. SYLD's yield is partly buyback-driven (no taxable distribution) and partly debt-paydown-driven (no distribution at all), so headline yield understates total return. AVUV's distribution profile is closer to a value index fund and fits a tax-deferred account better.
- Investor seeking small-cap exposure but worried about value traps: AVUV's profitability screen is the more direct answer. SYLD addresses value traps differently — through capital-return discipline — but is not exclusively small-cap.
Editor's read
If forced to pick one for a long-term portfolio, the editor leans toward AVUV — but for a specific reason, not because of the trailing five-year gap. AVUV's mandate maps cleanly onto an academic factor with thirty years of out-of-sample evidence, and the 0.25% fee leaves real room for the premium to compound through long quiet stretches. SYLD's signal is interesting and possibly durable, but it asks the investor to underwrite a behavioral thesis with a 0.59% annual fee and a much smaller asset base. For a buy-and-hold investor with limited tracking time, the cleaner factor mapping wins. SYLD remains worth watching as a satellite for someone who specifically wants concentrated capital-return exposure in addition to broad market and small-cap-value sleeves.
The editor holds AVUV as part of a small-cap value sleeve; the editor does not hold SYLD at the time of writing.
Methodology
Price, return, volatility, and drawdown figures were computed from yfinance daily total-return series, fetched 2026-05-05. Five-year CAGR and volatility use the trailing 1,260 trading days; max drawdown is the largest peak-to-trough decline within that window. Expense ratio, AUM, and inception cross-checked against issuer fact sheets (Avantis, Cambria). Macro context (10-year Treasury, federal funds rate, CPI, VIX) is from FRED, asof 2026-05-05. The comparison covers two specific funds; broader factor conclusions require longer samples than either fund alone provides.
This article is for educational purposes and does not constitute personalized financial advice. See the full Disclaimer.