
The short version
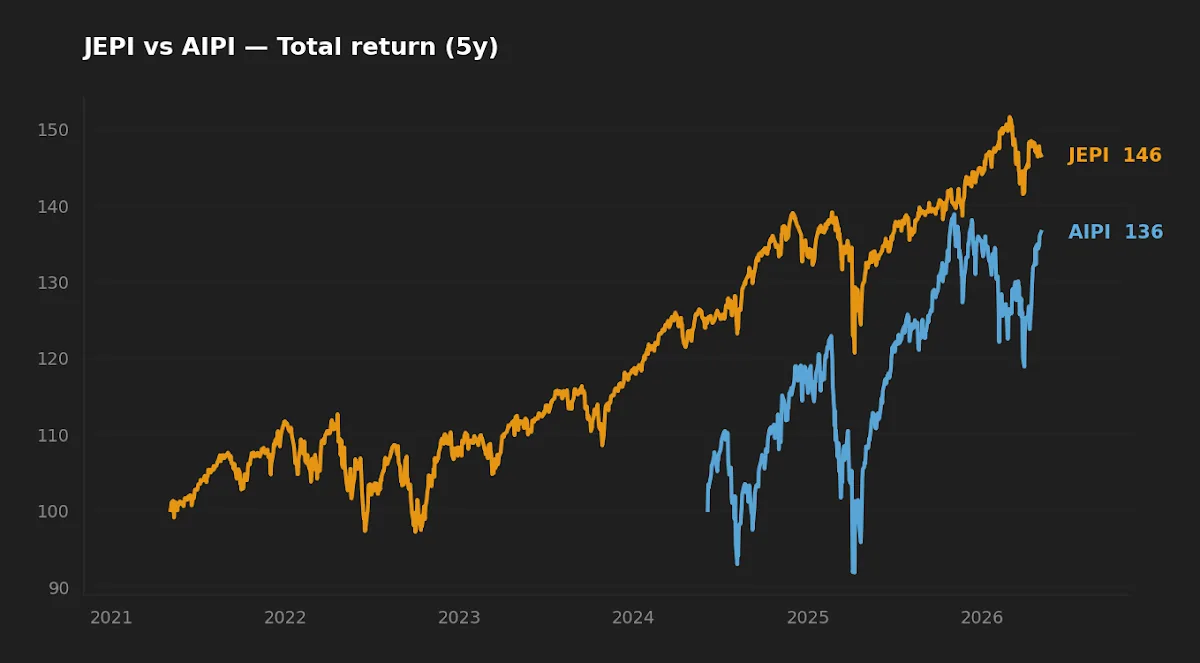
- JEPI pays an 8.4% distribution yield against a five-year track record (CAGR 8.2%, max drawdown -13.7%) and runs $44.0B in assets — a credible defensive equity-income tool.
- AIPI advertises a trailing distribution yield of 42.6%, but it has roughly eleven months of live data, $359M in assets, and most of that headline yield is income packaging on a concentrated AI-equity basket whose total return path remains unproven.
- Bottom line: JEPI is the analyzable income sleeve; AIPI is a high-volatility satellite that should not be sized off its yield number.
When a covered-call ETF advertises a 42.6% distribution yield while the 10-year Treasury pays 4.4% (FRED, asof 2026-05-01), the interesting question is not whether the yield is real. The cash distributions arrive on schedule. The interesting question is what the investor is being paid with — and whether the underlying NAV survives the act of paying it out.
JEPI and AIPI both sell options against an equity portfolio to manufacture income. The gap between their headline distributions is a story about volatility surfaces, sector concentration, the difference between distribution yield and total return, and how much of a "yield" is genuinely premium income versus return of the investor's own capital.
What each fund actually does
JEPI (JPMorgan Equity Premium Income ETF) holds a low-volatility equity portfolio screened on fundamental and quantitative inputs, and overlays it with equity-linked notes (ELNs) that synthetically sell out-of-the-money S&P 500 calls. The ELN structure caps a portion of upside and converts implied volatility into income. Inception was May 2020, so JEPI has lived through the 2022 drawdown cycle, the 2023 narrow-leadership rally, and the 2024 rate normalization. AUM is $44.0B (yfinance, 2026-05-05).
AIPI (REX AI Equity Premium Income ETF) takes the same conceptual approach — own equities, sell calls — but applied to a concentrated basket of AI-thematic stocks, with an algorithmic strike-selection process the issuer markets as "AI-driven." Inception was June 2024, giving roughly eleven months of live history. AUM is $359M (yfinance, 2026-05-05).
Two funds with the same blueprint, very different inputs. JEPI is selling premium on a low-volatility portfolio sized to capture moderate equity beta. AIPI is selling premium on the highest-implied-volatility corner of the US market, concentrated by definition.
Side-by-side data
| Metric | JEPI | AIPI |
|---|---|---|
| Issuer | J.P. Morgan Asset Management | REX Shares |
| Inception | 2020-05-20 | 2024-06-03 |
| Expense ratio | 0.35% | 0.65% |
| AUM | $44.0B | $0.36B |
| Distribution yield (trailing) | 8.4% | 42.6% |
| NAV (2026-05-05) | $56.78 | $36.08 |
| 5Y CAGR | 8.2% | n/a (insufficient history) |
| 5Y annualized volatility | 11.1% | n/a |
| 5Y max drawdown | -13.7% | n/a |
Source: yfinance, fetched 2026-05-05; expense ratio and structure from issuer fact sheets (am.jpmorgan.com for JEPI, rexshares.com for AIPI). Macro reference rates from FRED: 10Y Treasury 4.39%, VIX 16.99, both asof 2026-05-01.
Decomposing the 42.6% yield
The first analytical move is to stop treating distribution yield as a return number. Distribution yield is the ratio of trailing cash paid out to current NAV. For a covered-call ETF, that cash can come from three sources: dividends earned on the equity portfolio, premium captured from selling options, and — critically — return of capital classified by the fund when distributions exceed earnings.
JEPI's 8.4% yield is consistent with its underlying engine: roughly 1-2% from S&P-style dividends, plus 6-7% from monthly ELN-generated premium on a portfolio with single-digit realized volatility. The math closes. The five-year CAGR of 8.2% confirms it: total return tracks distribution yield reasonably well, meaning the fund is largely paying income out of actual income.
AIPI's 42.6% yield does not close on the same arithmetic. The underlying AI-equity basket pays minimal dividends. Even at a 40-50% implied volatility on individual names, sustained at-the-money option premium across a concentrated basket cannot mechanically produce a 42.6% cash flow without either capping virtually all upside or distributing principal. The most likely decomposition: a meaningful portion of AIPI distributions classifies as return of capital, which is income for cash-flow purposes but is also, definitionally, the investor's own NAV being handed back to them dressed as yield.
This is not a value judgment on the structure — it is how high-yield covered-call ETFs on volatile underliers tend to work. The investor needs to know that the comparison is not "8.4% versus 42.6%." It is "8.4% total return delivered as cash, versus an unknown total return delivered as cash plus NAV decay or appreciation."
Receiving a 42% distribution while NAV decays is not income — it is a slow, tax-inefficient liquidation of principal dressed up as a yield number.
Realized risk: what the data shows, and what it cannot
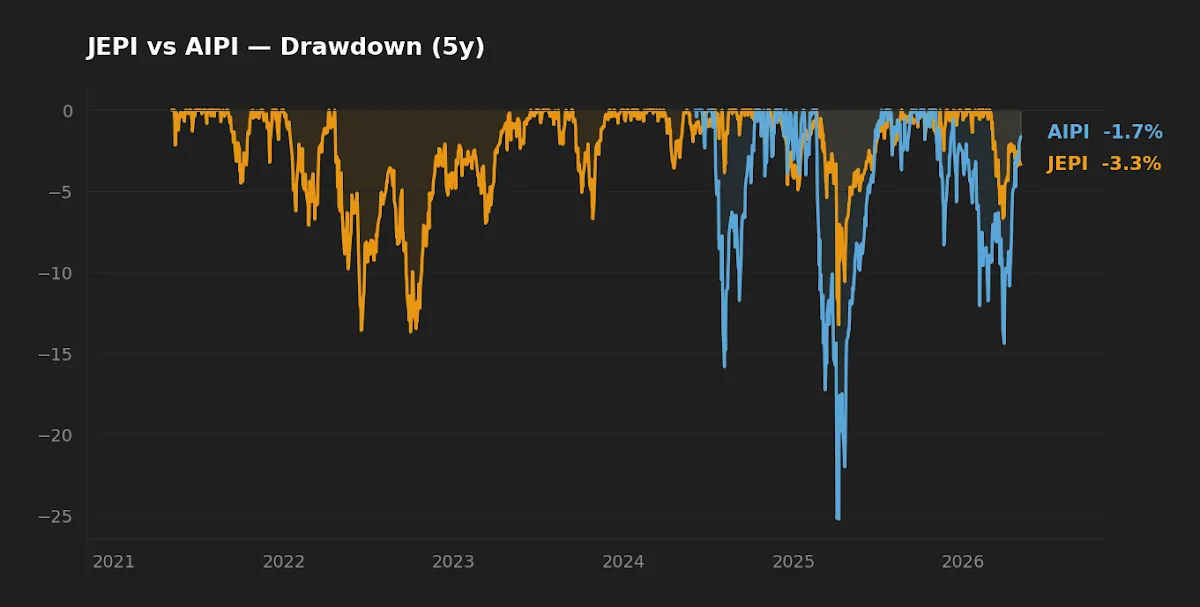
JEPI's worst five-year drawdown is -13.7%. That number is meaningful because it includes 2022, when the S&P 500 drew down roughly -25% peak-to-trough. JEPI's defensive equity selection plus call-overlay income absorbed roughly half of that decline. This is the empirical case for the fund: in the one regime where investors actually need a low-volatility income product, JEPI behaved consistent with its design.
AIPI has not been tested. Eleven months of live data covers a benign tape for AI-thematic equities and a VIX that has spent most of that period in the mid-teens (FRED VIX 16.99, asof 2026-05-01). What we cannot answer from the available data: how AIPI behaves when its concentrated underliers draw down 30-40% in a credit or sentiment shock, or when implied volatility collapses (which lowers premium income at exactly the moment the underlying is recovering).
The structural concern is the asymmetry of covered calls on volatile names. The fund caps the upside (calls get exercised) and absorbs most of the downside (the call premium is small relative to a 30% drawdown). In a quiet uptrend, AIPI looks like a yield miracle. In a sharp drawdown followed by a sharp recovery, the position can drift permanently below its inception NAV — premium kept, underlying upside surrendered, downside absorbed. This is not a failure of the algorithm; it is the option-selling payoff diagram operating as designed.
Capacity, taxes, and implementation
JEPI at $44.0B is liquid and institutionally meaningful; ELN counterparty arrangements scale. AIPI at $359M is small enough that bid-ask spreads matter and capacity in the underlying option market on a concentrated AI basket has not been stress-tested at multi-billion AUM. If AIPI grows quickly, the strike-selection process has to compete with itself.
Tax treatment is the friction most overlooked by retail buyers of high-yield ETFs. Both funds distribute primarily ordinary income and short-term capital gains, with some return-of-capital component for high-yield variants. Held in a taxable account in a 32% federal bracket, the after-tax yield on AIPI's 42.6% is materially less than the headline figure — and the return-of-capital portion lowers cost basis rather than creating immediate tax, deferring (not eliminating) the bill. JEPI's 8.4% faces the same character treatment but compounds in a tax-advantaged account materially better than in a taxable one. For long-horizon investors, this aligns with the broader argument made in our work on dividend investing as a long-term strategy: the location of high-yield income matters as much as the income itself.
Macro context: 4.4% risk-free changes the question
With the 10-year Treasury at 4.39% and the federal funds rate at 3.64% (FRED, asof 2026-05-01), the bar for accepting equity-overlay risk for income has risen meaningfully. JEPI's 8.4% yield clears that hurdle by ~400 basis points, paid for with equity beta and a roughly -14% historical drawdown — defensible math. AIPI's 42.6% headline yield "clears" the hurdle by 38 percentage points, but that excess is not free premium income; it is compensation for owning concentrated AI-equity exposure with a capped upside.
A reader thinking about positioning for changing rates may also find our note on ETFs for falling interest rates useful as adjacent context, since covered-call income strategies behave differently when realized volatility falls alongside rates.
At-a-glance scoreboard
| Category | Winner | Margin |
|---|---|---|
| Cost | JEPI | 30 bp lower expense ratio |
| Track record / evidence base | JEPI | Decisive — five years vs eleven months |
| Realized risk (5Y) | JEPI | Only fund with measurable drawdown data |
| Headline distribution yield | AIPI | Large, but composition matters |
| Suitability for long-term core income | JEPI | Strong |
| Capacity / liquidity | JEPI | Material — 122x AUM scale |
FAQ
Is AIPI's 42.6% yield sustainable?
The cash distributions are real but the yield as a percentage of NAV is not a stable expected return. Sustained option premium of that magnitude would require either consistently high implied volatility on the underlying basket or distributions partly funded by return of capital. Both can persist for stretches; neither can be assumed indefinitely.
Will AIPI's NAV decay over time?
NAV behavior depends on the path of the underlying AI-equity basket and the structural drag of selling calls into volatile names. In a benign-to-bullish tape with capped upside and high premium, NAV can drift slowly down or sideways. In a sharp drawdown, NAV falls with the underlying. There is no live data covering the second case.
How are distributions taxed?
Both funds distribute primarily as ordinary income, short-term gains, and (for AIPI especially) return of capital. ROC reduces cost basis rather than creating immediate tax, deferring the liability to sale. In a taxable account at higher brackets, after-tax yield is materially lower than headline; in a Roth or 401(k), the asymmetry largely disappears.
Can I use both in a portfolio?
Structurally, JEPI is a candidate for an income sleeve in a diversified allocation; AIPI is more accurately a satellite tilt for an investor who has already decided to overweight AI-thematic equity exposure. The funds are not substitutes — owning both is closer to "equity income plus concentrated AI bet" than to diversified income.
How does this compare to traditional dividend ETFs?
Covered-call income and dividend-growth equity income are different products with different return drivers. The dividend-growth approach captures rising distributions from quality companies; the covered-call approach monetizes implied volatility and caps upside. We compared these tradeoffs more directly in our SCHD vs DIVZ analysis.
What this comparison can and cannot tell you
It can tell you that JEPI is an analyzable, liquid, moderate-yield equity-income fund with five years of behavior across at least one stress regime. It can tell you that AIPI's headline yield is structurally not comparable to JEPI's. It can tell you that the fee gap (30 bp), the AUM gap (122x), and the track-record gap (five years vs eleven months) are large and matter.
It cannot tell you what AIPI's total return will be over any meaningful horizon — eleven months of live data, mostly through a benign volatility regime, is not enough to estimate forward CAGR, drawdown depth, or recovery time. Treat any verdict on AIPI as provisional until at least one full equity drawdown cycle has tested it.
Where each fund fits
- Reader in their 50s, taxable brokerage account, wanting cash flow without giving up all equity beta: JEPI is a defensible income sleeve at 5-15% of equity allocation. AIPI is hard to justify at any size for this profile.
- Reader in their 30s, all-401(k), no current income need: Neither fund is the natural choice. Long-horizon compounding favors broad-market exposure; income-overlay drag is not free.
- Reader who already owns concentrated AI thematic exposure and explicitly wants to cap upside in exchange for cash flow: AIPI is the more honest fit, sized as a satellite (under 5%) and held in a tax-advantaged account where the ROC and ordinary-income treatment hurt less.
- Reader in or near retirement managing sequence-of-returns risk: JEPI's defensive overlay through 2022 is the relevant precedent. AIPI does not yet have one.
Editor's read
Forced to pick one as a long-term income tool, the editor leans clearly toward JEPI: the fund has been tested, the yield decomposition closes arithmetically, and the AUM and fee structure are both supportive. AIPI is interesting as an experiment in algorithmic strike selection on a concentrated AI basket, but its 42.6% headline yield is not a return forecast — it is a packaging artifact of selling options on high-volatility names. Until AIPI has been through at least one tech-led drawdown cycle, sizing it off the yield number is making a decision the data does not yet support.
The editor does not hold either fund at the time of writing.
Methodology. Price, NAV, AUM, distribution yield, expense ratio, 5Y CAGR, 5Y volatility, and 5Y max drawdown were pulled from yfinance on 2026-05-05. Macro reference rates (10Y Treasury, federal funds rate, VIX, CPI year-over-year) were pulled from FRED on 2026-05-05. Fund structure descriptions are taken from issuer fact sheets at am.jpmorgan.com (JEPI) and rexshares.com (AIPI). Drawdown and CAGR use the trailing five-year window ending 2026-05-05; AIPI lacks five-year history, so those fields are reported as not available rather than estimated. Distribution-yield decomposition reasoning is the editor's analysis, not a published figure.
This article is for educational purposes and does not constitute personalized financial advice. See Disclaimer.