
The short version
- Over the trailing five years, VTI compounded at 11.8% annually while AIEQ — the IBM Watson-powered active equity ETF — compounded at 4.4%, a gap of roughly 740 basis points per year.
- AIEQ also took more risk getting that lower return: 22.5% annualized volatility versus VTI's 17.4%, and a -39.0% peak drawdown versus -25.4%.
- Bottom line: the live track record of "AI-selected equity" through this fund has not justified the 0.75% fee or the active-management premise. VTI remains the credible default for broad US equity exposure.
The interesting question with the Amplify AI Powered Equity ETF (AIEQ) is no longer whether IBM Watson can analyze more data than a human portfolio manager — that part is uncontroversial. The question is whether processing more data has produced better selection, net of cost, against the cheapest possible benchmark. Eight years into AIEQ's live history, we now have enough data to answer that empirically rather than from the prospectus.
Background: passive total market exposure versus an AI-selected concentrated portfolio
Vanguard's Total Stock Market ETF (VTI) holds essentially every investable US-listed equity, weighted by float-adjusted market capitalization, at a 0.03% expense ratio. It is the institutional default for "own the US equity market." Inception was May 2001; AUM is approximately $1.99 trillion across share classes (Vanguard).
AIEQ, launched October 2017, takes the opposite stance. It is an actively managed ETF whose holdings are selected daily by an IBM Watson-based system that ingests structured fundamentals plus unstructured signals (news, filings, sentiment). The portfolio is concentrated and turns over far more than a passive index. Expense ratio is 0.75%, AUM is approximately $109 million (Amplify ETFs fact sheet). For context, AIEQ's AUM is roughly 0.005% of VTI's, despite a five-year head-start over many of its passive competitors.
The data
| Metric | VTI | AIEQ | Source |
|---|---|---|---|
| Strategy | Passive, total US market | Active, AI-selected equity | Issuer fact sheets |
| Expense ratio | 0.03% | 0.75% | Vanguard / Amplify |
| AUM | ~$1,992B | ~$0.11B | Issuer, May 2026 |
| Inception | 2001-05-24 | 2017-10-17 | Issuer |
| Distribution yield (TTM) | 1.2% | 0.4% | yfinance, 2026-05-05 |
| 5Y CAGR | 11.8% | 4.4% | yfinance, 2026-05-05 |
| 10Y CAGR | 14.5% | n/a (insufficient history) | yfinance, 2026-05-05 |
| 5Y annualized volatility | 17.4% | 22.5% | yfinance, 2026-05-05 |
| 5Y max drawdown | -25.4% | -39.0% | yfinance, 2026-05-05 |
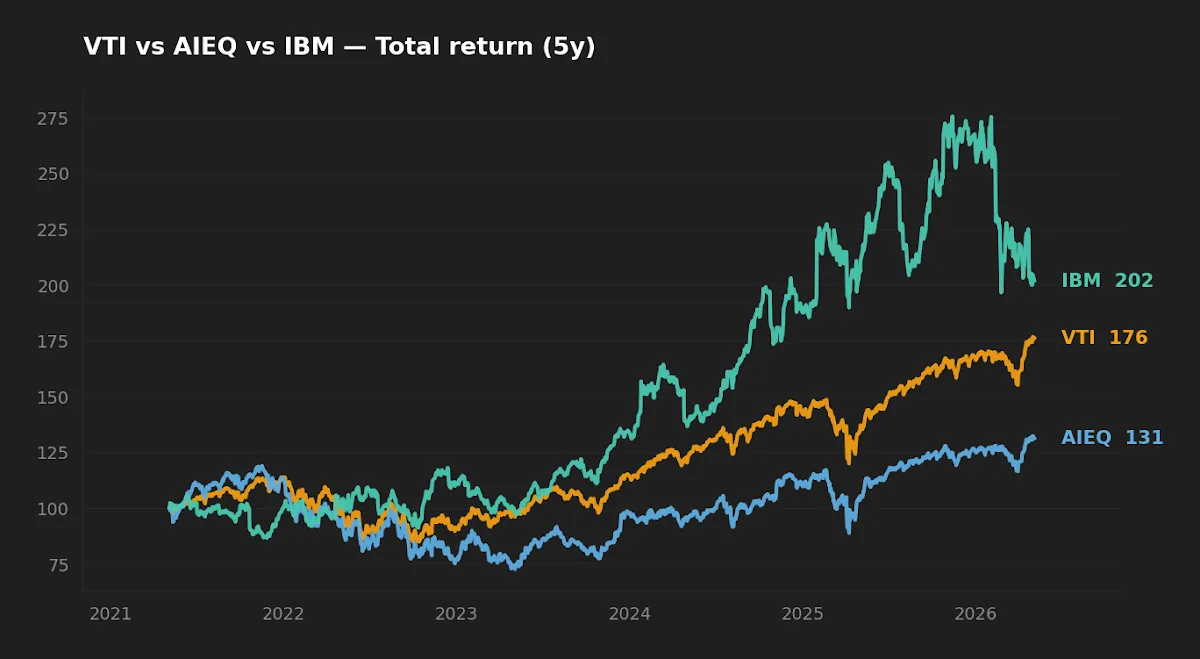
The fee gap explains a fraction of the underperformance, not most of it
The first reflex on seeing an active ETF trail a passive benchmark is to blame the expense ratio. Here, the expense gap is 0.72 percentage points per year (0.75% − 0.03%). The realized CAGR gap over the same five-year window is 7.4 percentage points. Fees account for roughly one-tenth of the shortfall. The other nine-tenths is selection.
This matters because the standard pitch for AI-selected equity is "we charge more, but the selection edge pays for it." That pitch only survives if the gross return — before fees — beats the benchmark by enough to clear the fee hurdle. AIEQ's gross-of-fee return over the five-year window was approximately 5.1%, still about 670 basis points short of VTI. Adding back the fee does not close the gap; it barely dents it.
Sharpe (1991) made the arithmetic point three decades ago: in aggregate, active investors must underperform the index by exactly the difference in costs. Individual funds can outperform, but a real edge has to overcome both the fee and the implicit cost of trading at concentrated, high-turnover weights. AIEQ's reported turnover history runs in the high triple digits to low quadruple digits annually, which adds bid-ask spread and tax-cost friction on top of the headline expense ratio. None of this is theoretical — it shows up in the live record.
The risk side is the same direction
If AIEQ had taken less risk to earn its lower return, there would be a defensible scenario for it as a low-volatility satellite. The data shows the opposite. Annualized volatility ran at 22.5% versus VTI's 17.4%. The peak-to-trough drawdown over the same window reached -39.0% for AIEQ versus -25.4% for VTI. AIEQ delivered worse return and worse risk, simultaneously.
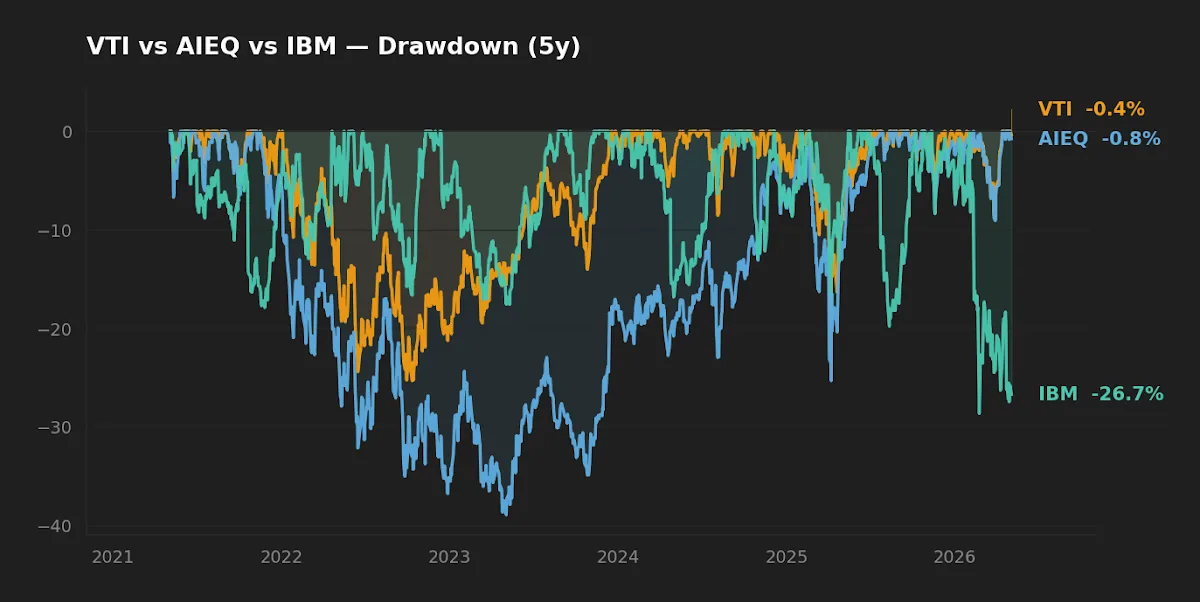
Some of this is structural. A concentrated active book that turns over heavily will have higher idiosyncratic risk than a 4,000-stock float-cap index. That is a feature of the strategy. The honest assessment is that AIEQ's risk profile during 2022's drawdown looked closer to a high-beta thematic fund than to broad equity exposure. Investors choosing it as a "smarter" version of the market got something materially different — and not in the favorable direction.
An IBM Watson-powered ETF underperformed not just the S&P 500 over five years — it also underperformed the stock of the company that built Watson, by roughly 11 percentage points per year.
The IBM stock irony — and what it suggests about AI-as-marketing
Here is a result that will not appear in AIEQ's own materials. Over the same five-year window, IBM the operating company — the firm that licensed Watson to Amplify — returned 15.4% annualized (yfinance). AIEQ, the ETF using Watson to pick stocks, returned 4.4%. An investor who bought a single share of IBM stock, paid no advisor, and held it through the period materially outperformed the AI-driven fund whose marketing rests on Watson's name.
This is not a knock on Watson as a technology. It is a comment on how AI brands get applied in retail asset management. "AI-driven" in an ETF prospectus tells you about the inputs to the selection process, not about the realized output net of fees, turnover, and concentration risk. We have analyzed this same gap in adjacent products in VOO vs. AMOM and in the broader landscape piece Best AI-Managed ETFs for 2026. The pattern is consistent enough that it deserves naming: an AI-as-marketing premium is not the same as an AI-as-edge premium, and only the second one has ever been worth paying for.
What the AUM tells you
AIEQ has been trading for over eight years. It is one of the longest-running AI-themed ETFs available to US retail investors. Its AUM is approximately $109 million. By comparison, ETFs launched after 2020 with credible passive or factor methodology routinely cross $1 billion within two to three years. The market has had a long time to evaluate AIEQ and has voted with its capital. That is not proof the strategy will keep underperforming, but it does mean that the investor considering AIEQ today is taking a position that institutional and sophisticated retail capital has, in aggregate, already declined.
At-a-glance scoreboard
| Category | Winner | Margin |
|---|---|---|
| Cost | VTI | Material — 72 bp |
| Realized 5Y return | VTI | Wide — 740 bp/yr |
| Realized 5Y risk (vol & max DD) | VTI | Material on both axes |
| Diversification | VTI | ~4,000 names vs concentrated active |
| Track-record length | VTI | 25 years vs 8 |
| Suitability for long-term core | VTI | Strong |
FAQ
Did AIEQ at least beat the market in the AI-rally years (2023–2024)?
No, not on a multi-year basis through the window measured. There were short rolling periods where AIEQ kept up with or briefly led broad equity, but the cumulative five-year record through May 2026 shows persistent underperformance. A fund that selects stocks daily using AI ought to capture an AI-led rally if anyone can; the result is one of the more telling pieces of evidence in this comparison.
Is the 0.72% fee really that bad?
The fee in isolation is not unusual for active equity. The problem is that the gross return needs to clear that hurdle, and it has not. On a $50,000 position held 20 years at the realized return spread, the gap compounds to a difference of roughly $200,000 in terminal value — and most of that gap comes from selection, not the headline fee. Fees compound, but selection errors compound faster.
Could AIEQ work as a small satellite position?
The honest answer is that for the satellite case to make sense, you need a thesis for why future performance will diverge from the realized track record. "AI is improving" is a thesis, but it is not specific to this fund's implementation. If the case is "I want concentrated AI-thematic exposure," there are pure-play AI hardware and software ETFs whose construction is at least transparent about what you are buying.
How does VTI compare to S&P 500 funds for this question?
For purposes of comparing to AIEQ, VTI and S&P 500 funds (VOO, IVV, SPY) tell the same story, with small differences in mid- and small-cap exposure. The 5Y CAGR gap to AIEQ is similar across all three. We compared VOO against the AI-momentum approach in a separate piece.
Is the 5-year CAGR gap really enough evidence?
It is enough to take seriously, but not enough to call permanent. Five years is a single regime in some respects. What strengthens the case is that the underperformance is consistent with the structural drag (high turnover, concentration risk, fee) rather than driven by one bad year. The pattern is stable, not episodic. See the next section.
What this comparison can and cannot tell you
The five-year window covers the 2022 rate-hike drawdown, the 2023 AI-led rally, and the 2024–2025 broadening. That is a reasonable cross-section of regimes — but it is still a single sample. AIEQ's full live history is just over eight years; we do not have a 2008-style stress test for it. We also do not have visibility into the specific Watson model versions used through the period, which makes attribution to "the AI" specifically (as opposed to Amplify's overlay decisions) difficult. What the data does show clearly is that, however the system worked in practice, the realized risk-adjusted return through the period is materially below the cheapest passive benchmark. Future regimes could change the result, but they would have to change it considerably.
Scenarios where each fund fits
- 30-year-old building a long-horizon core in a 401(k): VTI (or its mutual-fund equivalent VTSAX) at 0.03% is the credible default. AIEQ does not earn a place in this allocation on the available evidence.
- Investor who already holds broad equity and wants concentrated AI-thematic exposure: AIEQ is not the cleanest expression. A pure-play AI hardware or software ETF gives transparent factor exposure rather than an opaque selection process.
- Investor specifically interested in IBM's AI franchise: Owning IBM stock directly is the literal expression and has, over five years, materially outperformed the AIEQ wrapper.
- Investor in a taxable account: AIEQ's high turnover creates ongoing tax friction in addition to the management fee. The qualified-vs-ordinary mix on distributions is less favorable than VTI's. This widens the practical gap further.
Editor's read
If forced to pick one, the editor allocates to VTI without hesitation for any reader using this comparison to size a long-horizon core. The case for AIEQ rests on a thesis the live track record does not support. The eight-year AUM trajectory — stuck at roughly $109 million while the broader ETF complex grew aggressively — is the market's quiet verdict, and it lines up with what the return data shows. AI-driven asset management may eventually produce a fund that earns its fee on a multi-decade record. AIEQ is not currently that fund.
Editor's holdings disclosure: The editor holds broad US equity exposure functionally similar to VTI in the long-term core sleeve. The editor does not hold AIEQ or IBM stock at the time of writing.
Methodology
Return, volatility, drawdown, and yield figures were computed from yfinance daily total-return series pulled 2026-05-05, using a five-year window ending on the same date. Expense ratio, AUM, inception date, and strategy descriptions are sourced from the Vanguard and Amplify ETFs issuer fact sheets as of May 2026. Macro context (10Y Treasury 4.39%, fed funds 3.64%, VIX 16.99) is from FRED, as-of dates between 2026-04-01 and 2026-05-01. Gross-of-fee return was estimated by adding the headline expense ratio back to the realized net return; this excludes implicit costs (bid-ask, market impact) so the true gross figure is modestly higher.
This article is for educational purposes and does not constitute personalized financial advice. See the full Disclaimer.