
The short version
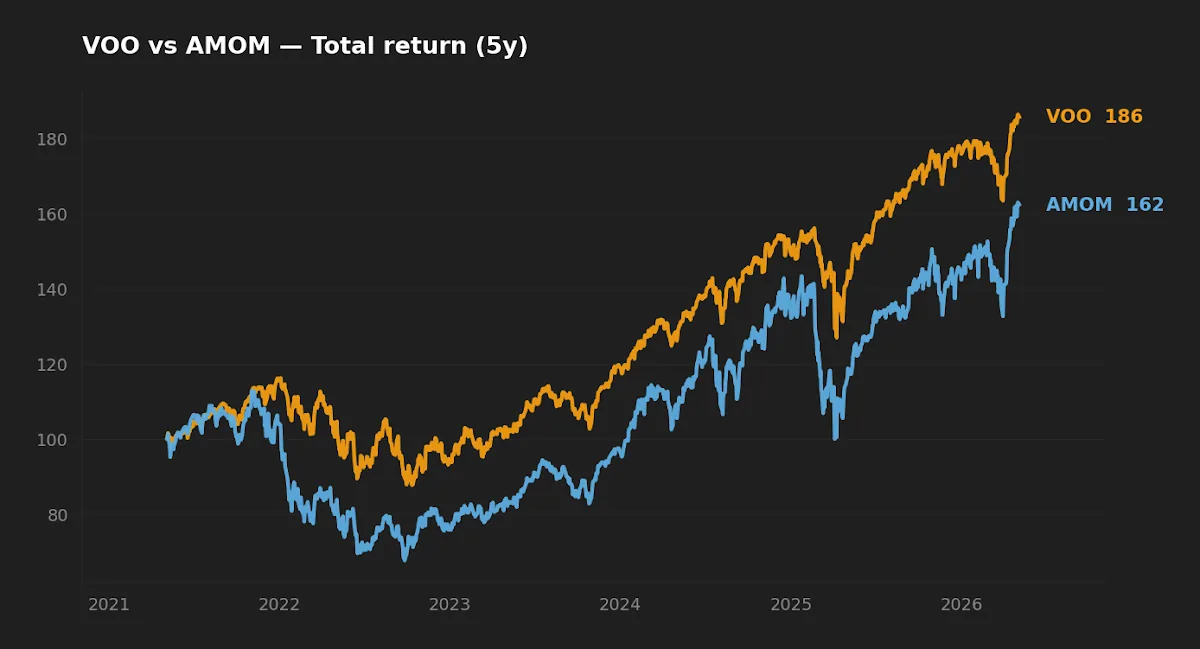
- Over the trailing five years, VOO compounded at 13.1% per year versus AMOM at 9.6% — with roughly 40% more volatility and a maximum drawdown nearly twice as deep.
- The 72-basis-point fee gap explains less than a quarter of the 350 bp CAGR gap; most of the rest is the regime sensitivity of momentum during a mega-cap-concentrated rally.
- AMOM is hard to justify as core exposure. As a small satellite tilt for an investor whose core is already broad-index and who has explicitly accepted factor risk, the case is weaker than the marketing suggests but not zero.
On paper, a deep-learning model that scores U.S. large caps for forward momentum should beat a static, market-cap-weighted index of the same universe. That is the bet AMOM makes, and it is the bet a long-term investor must evaluate before paying twenty-five times VOO's expense ratio. Five years of live data tells a more uncomfortable story: a model designed to harvest momentum lagged a portfolio that does not try to, and lost on every axis the literature uses to grade these strategies — return, volatility, drawdown, and capacity.
Two products built from the same universe
Vanguard's S&P 500 ETF (VOO) is a passive vehicle holding roughly 500 large-cap U.S. equities by market capitalization, with quarterly index reconstitution and an expense ratio of 0.03%. Its purpose is to deliver the U.S. large-cap risk premium with as little tracking error and as little cost as the asset class allows. At $1.42 trillion in assets, it is one of the largest pooled investment vehicles on earth.
AMOM is QRAFT Technologies' actively managed ETF that uses a deep-learning model to score U.S. large caps on probability of forward momentum, then constructs a concentrated portfolio of about 50 names rebalanced monthly. The expense ratio is 0.75%. It launched in May 2019 and has never crossed $50 million in AUM; the most recent reading is $27.1 million. Both products draw from the same investable universe. They differ on a single decision — whether an algorithm timing security selection inside that universe is worth the fee — and the data lets us grade that decision over a meaningful window.
For broader context on how factor-tilt ETFs in this category have behaved, our comparison of VOO, MTUM, and QUAL tracks the same question across two more conventional momentum and quality vehicles.
The numbers
| Metric | VOO (Vanguard S&P 500 ETF) | AMOM (QRAFT AI Momentum ETF) |
|---|---|---|
| Expense ratio | 0.03% | 0.75% |
| Assets under management | $1,421.1 B | $0.027 B ($27.1 M) |
| 12-month dividend yield | 1.2% | 0.1% |
| Inception | Sept 7, 2010 | May 20, 2019 |
| 5-year CAGR (total return) | 13.1% | 9.6% |
| 10-year CAGR (total return) | 15.0% | n/a (fund <10 years) |
| Annualized volatility (5Y) | 16.8% | 23.6% |
| Max drawdown (5Y) | −24.5% | −40.0% |
Sources: Vanguard VOO product page (investor.vanguard.com) and QRAFT AMOM fund page (qraftaietf.com) for expense ratio, AUM, and inception. CAGR, volatility, and drawdown computed from yfinance daily total-return series fetched 2026-05-05.
The fee gap is real, and it is not the main story
VOO charges 0.03% and AMOM charges 0.75%. The fee differential is 72 basis points per year — meaningful, but not enough to explain a 350 bp gap in CAGR. Subtracting the fee leaves roughly 280 bp of pre-fee underperformance for AMOM relative to simply owning the index. After paying its manager 0.75% to make security selection decisions, the model gave back another ~2.8% per year of return on top of the fee.
The risk-adjusted picture is worse. VOO produced a return-to-volatility ratio near 0.78 (13.1% / 16.8%); AMOM produced about 0.41 (9.6% / 23.6%). The index's risk-adjusted return is roughly twice AMOM's over this window. To make the cost concrete on a different scale than the usual round numbers: a $50,000 position held for 20 years at a 7% gross compound rate keeps roughly $192,000 at a 0.03% fee versus roughly $167,000 at 0.75% — a $25,000 drag from the fee alone, before any of the model's decisions show up.
Why a momentum model lagged in this particular regime
Momentum is a documented factor (Jegadeesh and Titman 1993; Asness, Moskowitz, Pedersen 2013) and it is famously regime-dependent. Two environments are unkind to it: sharp reversals after sustained trends, and markets where leadership concentrates in a small number of mega-caps that the model is reluctant to overweight further once they appear "extended" by its internal scoring.
The 2020–2025 window combined both. The 2020 COVID rebound was a violent reversal of late-2019 leadership. The 2022 drawdown punished prior winners harder than the broad market. From 2023 onward, returns concentrated in a handful of mega-cap technology and AI-related names that a market-cap-weighted index rode mechanically, while a discretionary momentum model tends to chase late and cut early in exactly that environment. The current macro reading — 10Y Treasury 4.4%, VIX near 17 (FRED, asof 2026-05-01) — describes a relatively calm regime, but the trailing window we are grading the model on is anything but calm. Reading a single five-year CAGR through that window as the verdict overweights one regime.
After paying its manager 0.75% to make security selection decisions, the model still gave back roughly another 2.8% per year of pre-fee return relative to simply owning the index.
Realized risk: the drawdown asymmetry
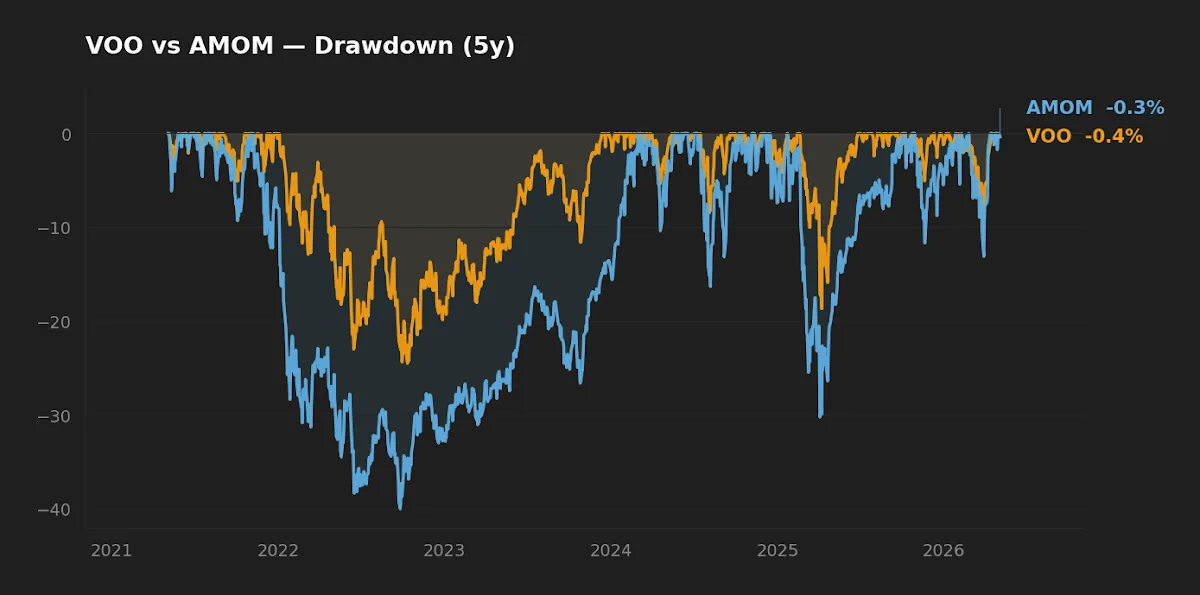
The drawdown chart is where the strategy's design shows up most clearly. VOO's −24.5% trough is roughly what an investor signs up for in the equity risk premium; AMOM's −40.0% is the cost of running a concentrated 50-name portfolio that rotates monthly into whatever the model's recent scores favor. A loss of 40% requires a 67% gain to recover; a 24.5% loss requires only 32%. That asymmetry compounds across cycles, and it is a behavioral risk as well as a numerical one — investors who panic-sell concentrated active funds at troughs realize the worst version of the path. A market-cap index is easier to hold through that experience because it does not require the holder to defend a manager's recent decisions.
Capacity, liquidity, and the $27 million problem
AMOM's $27.1 million AUM is the most under-discussed risk in the comparison. At that size, a single redemption from a mid-sized institutional holder can force meaningful turnover and widen bid-ask spreads. The fund's monthly rebalance into a concentrated portfolio also pushes internal turnover well above what a buy-and-hold index fund experiences, which has tax-cost-ratio consequences in a taxable account. Funds with sub-$50 million AUM are at elevated risk of liquidation if assets do not grow, because management fees may not cover operating costs — and a forced distribution can crystallize taxable gains an investor did not choose to realize.
VOO, at $1.42 trillion, has effectively unlimited capacity for an individual investor and trades with single-cent spreads during U.S. market hours. The asymmetry matters more than the headline return numbers, because it determines how cleanly an investor can enter, rebalance, and exit a position over a multi-decade holding period.
What this comparison can and can't tell you
The five-year window covers one full bear market (2022), one violent rebound (2020), and one concentrated mega-cap rally (2023–2025). That is a single regime in the academic sense — three connected episodes of a single macro arc. AMOM's record is six years of live data; we have no 2008-style stress test for it, no extended sideways market, no high-inflation regime in which momentum historically struggles in a different way. The comparison can support a claim that AMOM has not earned its fee in this regime. It cannot support a claim that momentum factor strategies, as a class, have stopped working — that is a much larger question with a much larger literature, and a single fund's track record is not evidence about a category.
Scenarios where each fund fits
- Long-horizon investor building a core sleeve in a taxable or tax-deferred account. VOO is straightforward: low fee, deep liquidity, predictable factor exposure, no fund-closure risk. AMOM does not belong here.
- Investor whose core is already broad-index and who explicitly wants a small momentum tilt. Sizing AMOM at single-digit-percent of total equity exposure, accepting high tracking error, and rebalancing on a defined schedule rather than chasing performance is the closer analog to how disciplined factor investors deploy this kind of vehicle. The trade-off is the capacity and liquidation risk.
- Investor evaluating "AI-managed" funds as a category. The honest read is to look at multiple implementations rather than treating AMOM as the verdict. Our deeper look at AIEQ and AMOM works through that comparison; the backtest framework piece is the right place to start for readers who want to evaluate any factor product on their own data.
- KRW-based investor. AMOM is U.S.-listed and the same FX exposure applies as for VOO; nothing in the structure helps a Korean investor sidestep currency risk relative to other U.S.-listed alternatives.
At-a-glance scoreboard
| Category | Winner | Margin |
|---|---|---|
| Cost | VOO | Material — 72 bp/yr |
| Realized risk (5Y vol & drawdown) | VOO | Wide |
| Realized return (5Y CAGR) | VOO | 350 bp/yr |
| Capacity & liquidity | VOO | Wide |
| Suitability for long-term core | VOO | Strong |
| Potential as small factor satellite | AMOM | Conditional |
FAQ
Has AMOM ever beaten VOO over a full calendar year?
Yes. AMOM has had stronger calendar-year returns in some windows, particularly during sector rotations when momentum signals lined up well. Over the rolling five-year window through May 2026, however, the cumulative result favors VOO by a wide margin, and the realized volatility and drawdown along the way were materially worse in AMOM. Annual leadership and long-run leadership are separate questions.
Is the 0.75% fee unusual for an actively managed thematic ETF?
It is roughly in line with the active-ETF peer group (commonly 0.50%–0.95%). The relevant comparison is not to other active ETFs but to the alternative the same investor would otherwise own. Against VOO at 0.03%, AMOM needs to outperform by at least 0.72% per year before fees just to break even — and the trailing record shows it has not done so over this window.
Can I use AMOM as a complement to VOO rather than a replacement?
That is closer to how factor-tilt funds are typically deployed. A common construction sizes the satellite at 5–10% of total equity exposure, accepts high tracking error to the core, and rebalances back to target on a defined schedule rather than chasing performance. The capacity and liquidation risk still apply at any size.
Does the small AUM mean AMOM might close?
Funds with sub-$50 million AUM are at elevated risk of liquidation if assets do not grow, because management fees may not cover operating costs. Investors should check the latest fund prospectus for any soft- or hard-close language and consider the tax consequences of a forced distribution before sizing a position.
What do these numbers say about AI in investing more broadly?
One fund's track record is not evidence about a category. AMOM is a single implementation of a single objective (large-cap momentum) by a single manager. The trailing data is consistent with the longer-running result that most active U.S. large-cap funds — algorithmic or human — have not outperformed the S&P 500 net of fees over rolling multi-year windows. That pattern is what passive indexing was built around, and a single deep-learning vehicle does not overturn it.
Key takeaways
- VOO compounded at 13.1% versus AMOM's 9.6% over the trailing five years, with about half the maximum drawdown and notably lower volatility.
- The 72 bp fee gap is real but explains less than a quarter of the 350 bp CAGR gap; the remainder reflects regime sensitivity of momentum during 2020–2025.
- AMOM's $27.1 million AUM is a structural risk that compounds the strategy risk: liquidity, spreads, and fund-closure odds all argue for cautious sizing.
- If used at all in a long-horizon portfolio, an AI-driven factor product like AMOM fits as a small satellite to a broad index core, not as a substitute for it.
- Past returns for both funds are descriptive, not predictive. The five-year window includes one bear market and one concentrated mega-cap rally; the next five years will not look like the last five.
Editor's read
If forced to pick one for a long-term core sleeve, the editor leans firmly toward VOO. The 72 bp fee gap is unforgiving over decades; the realized risk asymmetry (40% drawdown versus 24.5%) is harder for a real investor to hold through than the brochure suggests; and the $27M AUM raises the probability that the position gets closed on the investor rather than by the investor. AMOM is interesting only in a narrow case — a small, deliberately sized satellite tilt for someone who already owns broad market exposure, has explicitly accepted factor risk, and has read enough of the momentum literature to know what regime they are paying for.
The editor holds broad U.S. large-cap index exposure (VOO category); does not hold AMOM at the time of writing.
Methodology. Expense ratio, AUM, and inception are taken from each issuer's product page (Vanguard for VOO; QRAFT for AMOM) as cited above. 5-year and 10-year CAGRs, annualized volatility, and maximum drawdown are computed from yfinance daily total-return series pulled on 2026-05-05, using a trailing 5-year window ending on the fetch date. Macro context (10Y Treasury, VIX) is from FRED, asof 2026-05-01. The drawdown and normalized return charts use the same total-return series, rebased to 100 at the start of the window.
By the Mulden editor. This article is for educational purposes and does not constitute personalized financial advice. See Disclaimer for the full notice.