
The short version
- Over the trailing five years, the cap-weighted S&P 500 (VOO) actually outperformed both factor ETFs on raw return — 13.1% CAGR versus MTUM's 11.5% and QUAL's 11.4% (yfinance, 2026-05-05).
- "Quality" did not deliver the defensive profile its label suggests: QUAL's 5Y max drawdown was -28.2%, deeper than VOO's -24.5%.
- If you want a single core position, VOO is the harder fund to argue against. MTUM and QUAL have a case as small satellite tilts, not as the centerpiece.
On paper, factor ETFs ought to beat the cap-weighted index. Momentum captures a return premium documented across decades of academic literature, and quality screens out the most fragile balance sheets. Yet over the past five years — a window covering the COVID crash, the 2022 bear market, and the AI-driven recovery — both MTUM and QUAL trailed plain VOO on total return, and QUAL drew down more deeply than the index it claims to refine. The interesting question is not which fund "won." It is why the gap between factor theory and factor live performance is structural enough that long-horizon allocators should think twice before tilting hard.
What each fund is actually doing
The factor literature — Fama and French (1992, 1993, 2015), Carhart's momentum extension, and the Asness/Frazzini/Pedersen work on quality — argues that disciplined exposure to certain firm characteristics earns a long-run premium over a cap-weighted benchmark. Smart-beta ETFs are the retail-accessible version of that argument.
MTUM (iShares MSCI USA Momentum Factor) holds the top quintile of US large-caps ranked on 6- and 12-month risk-adjusted price momentum, rebalanced semi-annually. QUAL (iShares MSCI USA Quality Factor) screens for high return on equity, stable year-over-year earnings growth, and low financial leverage. Both charge 0.15% and have live track records since mid-2013. VOO (Vanguard S&P 500 ETF) is the cap-weighted reference at 0.03% — no factor tilt by design, and the broadest, cheapest building block on the comparison sheet.
ETF data (yfinance, 2026-05-05)
| Metric | VOO | MTUM | QUAL |
|---|---|---|---|
| Issuer fact sheet | Vanguard | iShares | iShares |
| Expense ratio | 0.03% | 0.15% | 0.15% |
| AUM | $1,421B | $20.2B | $46.5B |
| 30-day yield | 1.2% | 0.8% | 1.0% |
| Inception | 2010-09-07 | 2013-04-16 | 2013-07-16 |
| 5Y CAGR | 13.1% | 11.5% | 11.4% |
| 10Y CAGR | 15.0% | 15.9% | 13.6% |
| 5Y annualized vol | 16.8% | 20.4% | 17.4% |
| 5Y max drawdown | -24.5% | -32.3% | -28.2% |
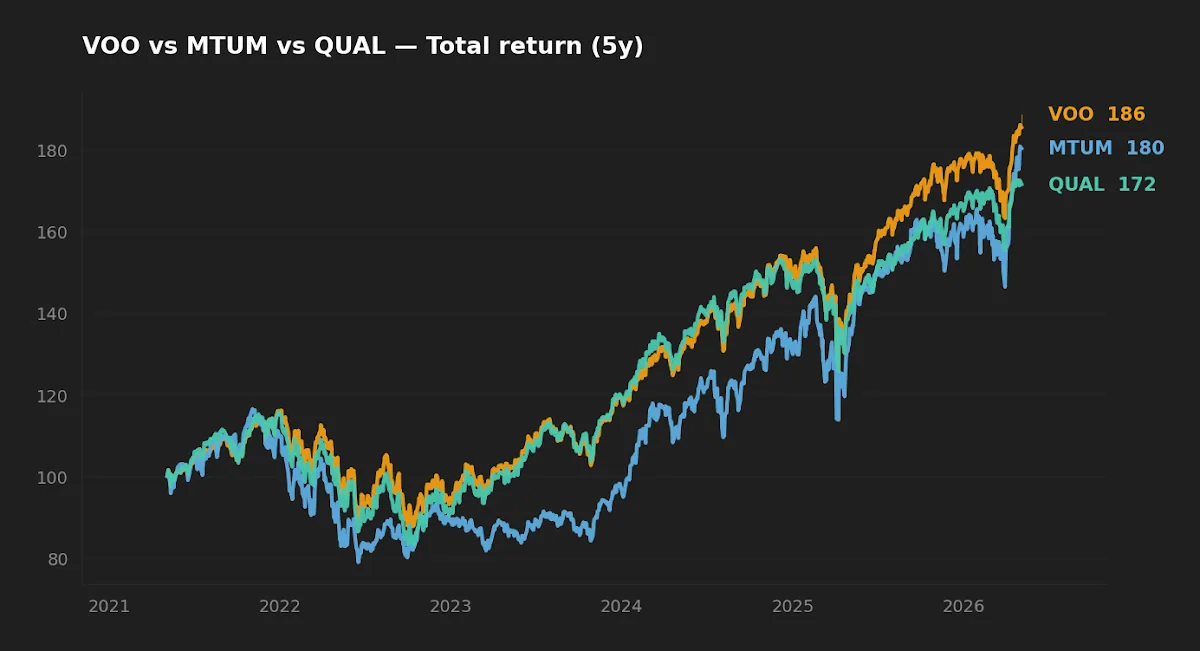
The factor premise versus the realized 5-year record
Both MTUM and QUAL were designed to deliver alpha versus a cap-weighted US large-cap index. Over the trailing five years, neither has. VOO returned 13.1% annualized; MTUM returned 11.5%; QUAL returned 11.4%. The factor ETFs were also more volatile — MTUM's 5Y annualized standard deviation is 20.4% versus VOO's 16.8% — so they underperformed on a risk-adjusted basis as well. Using the prevailing 10-year Treasury (4.39% as of FRED 2026-05-01) as a rough risk-free proxy, approximate Sharpe ratios on the 5Y window are 0.52 for VOO, 0.43 for QUAL, and 0.35 for MTUM. None of this is what the factor brochure promises.
This is not evidence that factor premia are dead — five years is one regime, and the academic case rests on multi-decade samples — but it is a reminder that factor exposures are levered bets on a particular regime continuing. Momentum had a vicious factor crash in 2022 when the market re-priced long-duration growth and reshuffled leadership in a single quarter. Quality screens, depending on construction, can accidentally tilt growth-heavy and de-rate alongside multiples. The smart-beta promise is real on a 30-year horizon. The realized 5-year record is a useful corrective for anyone treating MTUM or QUAL as a free lunch.
Why momentum's recent record looks weak
MTUM's structural quirk is its rebalancing rule. The fund refreshes its top-quintile momentum holdings semi-annually, which means it tends to load up on the prior six-to-twelve-month winners and then ride them through whatever comes next. In trending markets that is the design intent. In sharp regime shifts, it is a problem.
The 2022 reshuffle is the canonical example. Heading into the year, MTUM was heavy on long-duration growth and large-cap technology — the assets that had won 2020 and 2021. When the Fed pivoted hawkish and 10-year yields jumped from 1.5% to over 4%, those names took the worst of the multiple compression. MTUM's mid-2022 reconstitution then rotated toward energy and defensive value at almost the moment those sectors peaked, locking in a buy-high-sell-low pattern. The 5Y max drawdown on MTUM is -32.3%, meaningfully worse than VOO's -24.5%. That is the cost of momentum's sensitivity to regime turning points.
There is a related capacity question. MTUM at $20.2B AUM is large enough that semi-annual rebalances move prices in the names being added or trimmed, leaking return into the trade. None of this means the momentum premium has vanished from the academic literature; over the full 10-year window, MTUM's CAGR (15.9%) edges VOO's (15.0%). It does mean that, as actually implemented in this product, momentum's premium and its drag come bundled.
QUAL's max drawdown of -28.2% over the past five years is deeper than the S&P 500's -24.5%. The factor labelled "defensive" lost more in the rate shock than the index it claims to refine.
Quality didn't defend the way the label suggests
The most counterintuitive line in the table is QUAL's drawdown. "Quality" — high ROE, low leverage, stable earnings — is the factor most often pitched as defensive. The 5-year record disagrees: QUAL's max drawdown was -28.2%, deeper than the cap-weighted S&P 500 at -24.5%. A first read is to assume bad luck, but the construction explains it.
MSCI's quality screen rewards high ROE and stable earnings growth, both of which correlate strongly with the kind of large-cap growth franchise that traded at premium multiples through 2021. QUAL was therefore long Apple, Microsoft, and similar mega-cap growth at substantial weights heading into 2022. When multiples compressed in the rate shock, the same companies QUAL was screening as high-quality were also the most rate-sensitive names in the index. The defensive label and the realized factor exposure pointed in opposite directions.
Quality screens that emphasize cash-flow stability and low debt without simultaneously controlling valuation will tend to inherit growth-factor risk. That is a methodology choice, not an indictment of quality investing as a concept — funds like Invesco's S&P 500 Quality ETF (SPHQ) use a different methodology and behaved differently in 2022. The takeaway for an allocator is narrower than the brochure implies: do not assume QUAL's label translates to lower drawdowns than the index. Over the 5-year window we have, it did not.
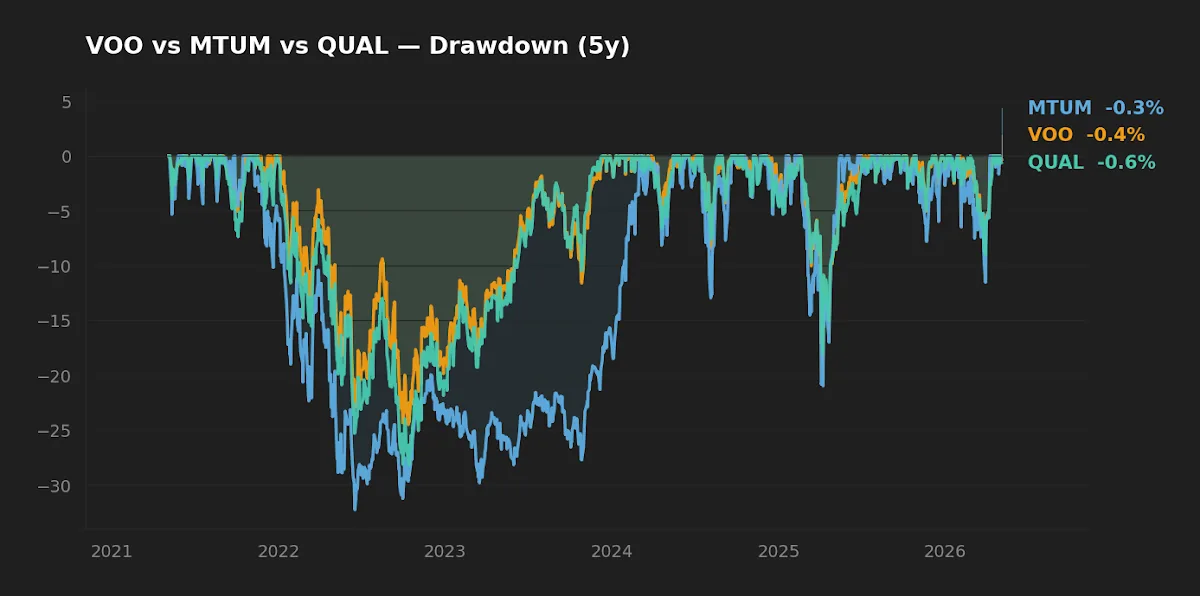
The 10-year frame tells a different story
Stretch the window to ten years and the rankings flip. MTUM's 10Y CAGR is 15.9%, ahead of VOO's 15.0% and well ahead of QUAL's 13.6%. The momentum premium that vanished from the 5Y window is partially recovered in the longer one — exactly the regime-dependence the academic literature describes, and the same kind of regime switching we covered in the Great Rotation playbook.
This matters for two reasons. First, it is a check against recency bias. A reader who looked only at 5-year data could conclude that smart-beta is a marketing artifact. The 10-year frame says the underperformance is regime-specific, not structural extinction. Second, it tightens the criterion for using a factor ETF: to benefit from MTUM, a long-horizon investor needs to hold it across the regime that punishes it (2022, in our window) without rotating out. The discipline part is harder than the analysis. The 10-year picture also penalizes QUAL more than MTUM — quality's longer-window underperformance against VOO is harder to rescue with regime arguments and suggests the construction itself is leaving return on the table.
Cost, capacity, and the friction tax
The fee gap looks small — 12 basis points between VOO and either factor fund — but the math compounds. On a $50,000 position held for 25 years at 7% gross, a 12 bp annual drag costs roughly $7,500 of terminal wealth. That is not the dominant variable in this comparison (regime exposure is), but it is a steady tax that the factor funds need to overcome before the premium even starts paying. VOO at $1.42T AUM is also the most heavily traded, narrowest-spread instrument in the set; MTUM at $20.2B and QUAL at $46.5B are large enough to be liquid for retail positions but small enough that their semi-annual rebalances are visible to the market.
At-a-glance scoreboard
| Category | Winner | Margin |
|---|---|---|
| Cost | VOO | Material — 12 bp |
| Realized 5Y return | VOO | ~160 bp/yr over MTUM and QUAL |
| Realized 5Y drawdown | VOO | Modest — best of the three |
| Realized 10Y return | MTUM | Marginal — 90 bp/yr over VOO |
| Suitability for long-term core | VOO | Strong |
What this comparison can and can't tell you
Five years is one regime — specifically, a regime defined by a pandemic, a sharp rate-driven bear market, and an AI-led recovery in mega-cap growth. Treating the 5Y CAGR ranking as the verdict overweights this single window. The 10-year frame partially rebalances the picture for MTUM but does not for QUAL. We do not have a true 2008-style stress test for either fund's current methodology; both indices were constructed after that crisis. The Sharpe ratios above are sensitive to the choice of risk-free rate and volatility window. And none of this analysis incorporates investor behavior — the realized retail return on factor funds is consistently lower than the fund's own return, because investors rotate in after good runs and out after bad ones.
Where each fund actually fits
- Investor in their 30s, 401(k)-only, building a US-equity core: VOO. The 12 bp fee gap is unforgiving over decades, and the 10-year record gives factor tilts a defensible — but not necessary — role.
- Investor with broad index exposure already, looking for a small US satellite tilt: a 10–15% MTUM sleeve is defensible if the holder has the discipline to keep it through a regime like 2022. Sizing matters more than selection.
- Investor explicitly seeking lower drawdowns: not QUAL, despite the label. Low-volatility products (USMV, SPLV) have a stronger empirical claim, and the 5Y -28.2% drawdown on QUAL is the cleanest counterargument to its "defensive" framing.
- Investor optimizing for tax efficiency in taxable accounts: VOO. Both factor funds run higher turnover than a cap-weighted index, which raises tax-cost ratio on distributions even when it does not change pre-tax total return. The same logic appears in our broader framework for evidence-based ETF portfolios.
Frequently asked questions
Is the 5-year underperformance of MTUM and QUAL evidence the factors are dead?
No. Five years is one regime, and that regime included a sharp 2022 rate shock that punished both momentum's recent winners and quality's growth tilt. The 10-year frame partially rehabilitates momentum (MTUM 15.9% vs VOO 15.0%) but not quality (QUAL 13.6%). Factor premia exist over multi-decade samples but show up unevenly across shorter windows.
Should I hold all three?
Most retail investors should not. VOO is the broadest, cheapest building block; layering MTUM and QUAL on top introduces concentrated factor exposures that often correlate strongly with VOO itself. If you want factor tilts, choosing one and sizing it as a satellite (5–15% of the equity sleeve) is more defensible than collecting them.
How does this compare to thematic alternatives like AMOM?
AMOM is an actively managed AI-selected momentum ETF — a different bet that relies on a model rather than a rules-based screen. We covered that in the VOO vs AMOM piece. The short version: AMOM faces the same regime problem as MTUM with added model risk.
What about Sharpe ratios?
Using the 10-year Treasury (4.39%, FRED 2026-05-01) as risk-free proxy and the trailing 5Y annualized volatilities, approximate Sharpe ratios are 0.52 for VOO, 0.43 for QUAL, and 0.35 for MTUM. VOO wins on risk-adjusted return as well as raw return over this window. Treat these as one possible computation; results vary with the rf and vol-window choices.
Does macro context (high rates, sticky inflation) argue for one fund over another going forward?
With the 10Y at 4.39%, fed funds at 3.64%, and CPI year-over-year at 3.3% (FRED, 2026-05-05), the rate environment that hurt long-duration growth in 2022 has not fully unwound. That argues against assuming QUAL's growth-tilt drag is over. It is not, however, a basis for predicting which fund will lead — predictions of that kind are exactly what a long-horizon process is meant to avoid.
Key takeaways
- VOO outperformed both factor ETFs on raw and risk-adjusted return over the trailing 5 years; treating that as the verdict overweights one regime.
- MTUM's premium is real over a 10-year window but comes bundled with deeper drawdowns and behavioral risk at regime turning points.
- QUAL did not behave defensively in this cycle — its growth-factor leakage produced a drawdown deeper than VOO's. The label is not the exposure.
- The 12 bp fee gap is the smallest variable in this comparison; regime exposure and investor discipline are the largest.
- For a single core position, VOO is the harder fund to argue against. Factor tilts work better as small, sized satellites than as the centerpiece.
Editor's read
If forced to pick one, the editor leans toward VOO as the long-term core. The 5-year underperformance of both factor ETFs is one data point, but the structural issue is that factor exposures are regime-conditional bets that retail holders rarely hold through their bad regime — VOO removes that behavioral problem by design. MTUM has a defensible role as a small (10–15%) satellite tilt for an investor who has explicitly committed to holding through a 2022-style reset. QUAL is harder to justify in current form, given its growth-factor leakage and a 5Y drawdown deeper than the index it claims to refine.
The editor holds VOO; does not hold MTUM or QUAL at the time of writing.
Methodology. Return, volatility, and drawdown figures were computed from yfinance daily total-return data on 2026-05-05, using rolling 5-year and 10-year windows ending 2026-05-05. Expense ratios, AUM, and inception dates are from issuer fact sheets (Vanguard for VOO; iShares for MTUM and QUAL), linked in the data table. Macro reference figures (10-year Treasury, fed funds rate, VIX, CPI year-over-year) are from FRED, asof 2026-05-01 / 2026-04-01 / 2026-05-01 / 2026-03-01 respectively. Sharpe approximations use the 10-year Treasury yield as the risk-free rate.
This article is for educational purposes and does not constitute personalized financial advice. See the full Disclaimer.