
The short version
- AIEQ (Amplify AI Powered Equity) and AMOM (QRAFT AI-Enhanced Momentum) both charge 0.75% — roughly 25 times the cost of a broad-market index ETF — for an algorithmically managed equity strategy.
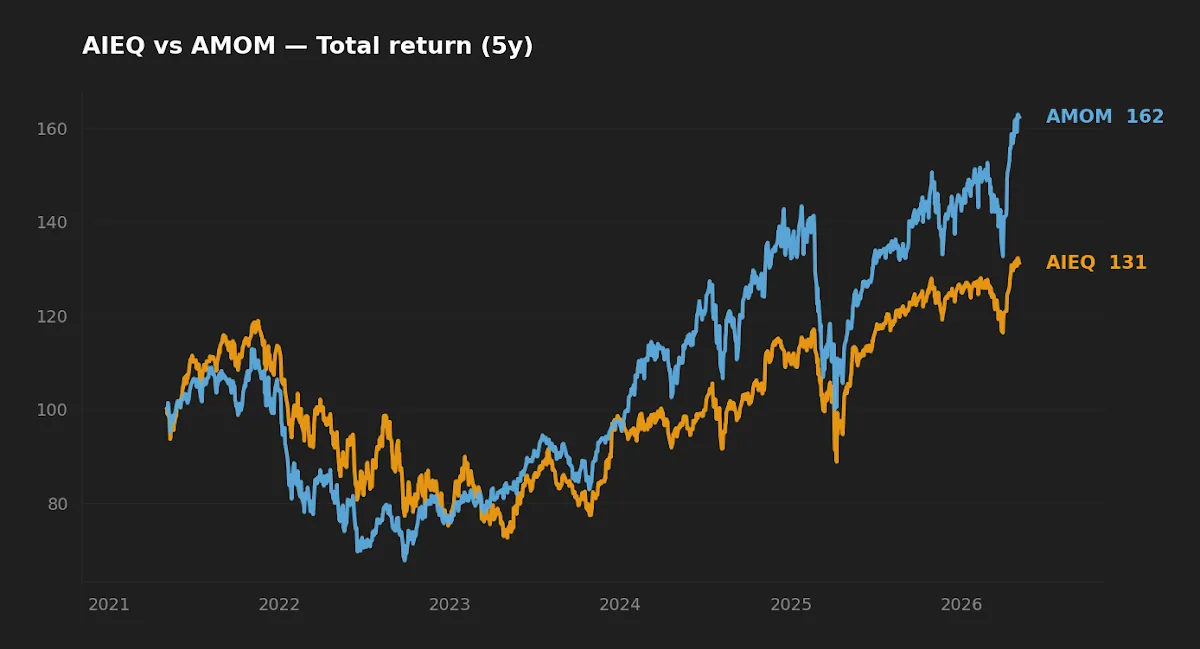
- Over the trailing 5 years, AMOM compounded at 9.6% per year while AIEQ delivered 4.4%; both endured drawdowns of roughly 40%, and neither cleared a plain S&P 500 ETF over the same window.
- Bottom line: these are satellite-only positions for an investor who specifically wants to pay for an algorithmic process. The fee load is unforgiving, AMOM's $27M AUM raises real closure risk, and the data does not yet show AI-specific alpha after factor exposures are accounted for.
Two ETFs market themselves as fund managers replaced by an algorithm: AIEQ, the Amplify AI Powered Equity ETF, and AMOM, the QRAFT AI-Enhanced U.S. Large Cap Momentum ETF. The interesting question for a long-horizon investor is not whether AI can pick stocks — it can, in the same trivial sense that a coin flip can — but whether either of these funds has produced durable, fee-justifying alpha relative to what a passive investor could have captured for 3 basis points instead of 75.
The 5-year track record now in hand — both funds have lived through the 2022 drawdown, the 2023 momentum reversal, and the 2024–2025 large-cap rally — is enough to start asking that question seriously, even if it is not enough to settle it.
What each fund actually does
AIEQ launched in October 2017 and was the first ETF to publicly market a system that selects U.S. stocks using machine-learning analysis of news flow, regulatory filings, social posts, and management transcripts. The portfolio is rebalanced regularly based on the system's output, with no human overlay on individual picks. The investor is paying for the algorithm, not a stock-picker.
AMOM is structurally narrower. Launched in May 2019 by QRAFT, a Seoul-based machine-learning firm, the fund applies an ML overlay to a U.S. large-cap universe with the explicit objective of identifying short-term momentum — names whose recent return profile suggests continuation. In factor terms, AMOM is a momentum-tilted active strategy with an algorithmic stock-picker layered on top of the factor exposure.
Both wrappers charge a 0.75% expense ratio. For comparison, a Vanguard S&P 500 ETF (VOO) charges 0.03% and the iShares MSCI USA Momentum Factor ETF (MTUM) charges 0.15%. The AI ETFs are not really competing against each other for the long-term investor's dollar. They are competing against the natural alternatives an investor would otherwise use to get U.S. large-cap exposure.
Side-by-side data
| Metric | AIEQ | AMOM |
|---|---|---|
| Full name | Amplify AI Powered Equity ETF | QRAFT AI-Enhanced U.S. Large Cap Momentum ETF |
| Inception | Oct 17, 2017 | May 20, 2019 |
| Expense ratio | 0.75% | 0.75% |
| AUM | $109M | $27M |
| Distribution yield | 0.5% | 0.1% |
| NAV | $47.78 | $55.62 |
| 5Y CAGR | 4.4% | 9.6% |
| 5Y annualized volatility | 22.5% | 23.6% |
| 5Y maximum drawdown | -39.0% | -40.0% |
Source: yfinance, fetched 2026-05-05. Expense ratio and AUM cross-checked against the Amplify ETFs (AIEQ) and QRAFT ETF (AMOM) issuer fact sheets. CAGR and drawdown computed over the trailing 5-year window.
Realized return: the gap is real, but the comparison is conditional
Over the trailing 5 years, AMOM compounded at 9.6% per year against AIEQ's 4.4% — a 520 basis point annual gap that, at face value, looks decisive. It isn't, for two reasons.
First, AMOM is a momentum-tilted product, and the trailing 5-year window includes a sustained large-cap momentum regime through the 2023–2024 mega-cap rally. A momentum fund earning a momentum return is not surprising and is not, on its own, evidence that the AI is doing anything an indexed momentum ETF (MTUM) was not already doing for 60 basis points less. The cleaner test is AMOM versus MTUM, not AMOM versus AIEQ.
Second, both funds underperform the obvious passive alternative over the same window. A plain S&P 500 ETF compounded at roughly 13% annualized over the trailing 5 years. AIEQ's 4.4% is an 860 bp shortfall against the index; AMOM's 9.6% is a 340 bp shortfall. Whatever the AI is doing, over this specific window it has not translated into more wealth for the holder than a one-decision passive position would have provided.
Realized risk: the algorithm did not dampen drawdowns
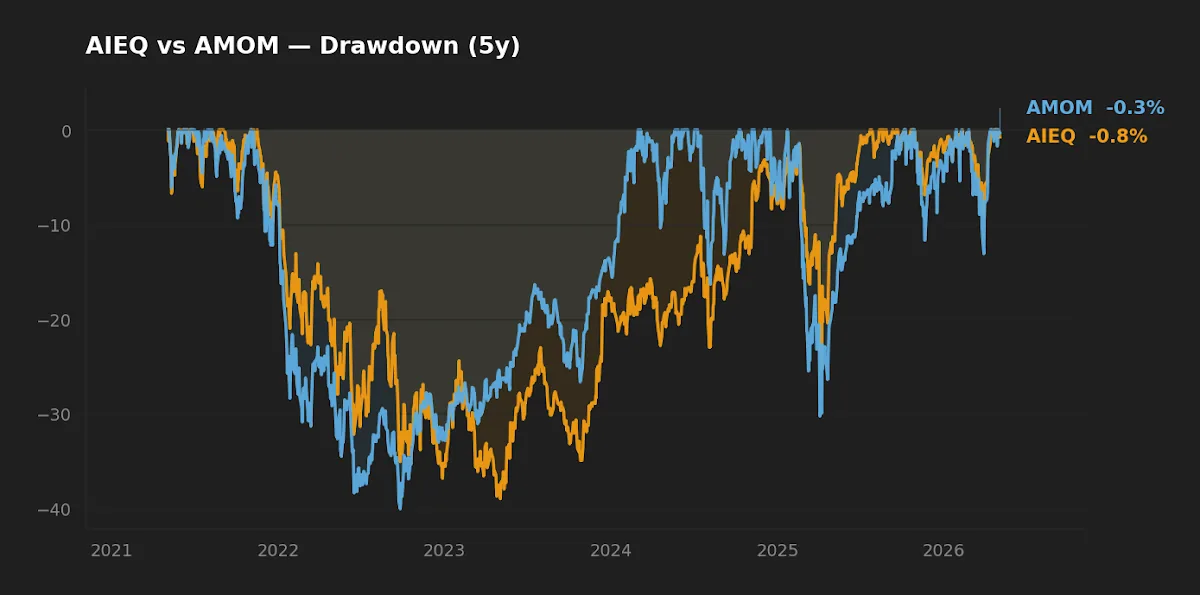
One of the implicit pitches for an algorithmically managed fund is that the system, free from human emotion, ought to behave better in stress than a passive index. The 5-year drawdown record does not support that pitch. AIEQ's worst 5Y drawdown was -39.0% and AMOM's was -40.0% — both materially deeper than the SPY drawdown over the same window. Annualized volatility tells the same story: 22.5% for AIEQ and 23.6% for AMOM, against roughly 18% for the broad index.
The "AI as drawdown dampener" framing is intuitive but empirically not what these two funds delivered. They behaved like concentrated active equity strategies — higher volatility, deeper drawdowns, dependent on a few thematic exposures — which is what they are.
Whatever the AI is doing, over a 5-year window that included a major drawdown and a major rally, neither fund cleared a plain S&P 500 ETF. The fee was real; the alpha was not.
Capacity, scale, and the closure question
This is the part of the analysis most retail-oriented coverage skips. AMOM's AUM is roughly $27M. At a 0.75% expense ratio, that translates to roughly $200,000 of annual gross fund revenue — before paying the issuer, the data licenses, the index custodian, and the audit. ETFs that small are structurally vulnerable: a year of outflows or a poor benchmark print can push them below the threshold at which the issuer rationally chooses to close the wrapper rather than subsidize it.
The reader does not need to forecast closure to take this seriously. Closure of a small ETF is not catastrophic — proceeds are returned at NAV — but it is a forced taxable event for taxable-account holders, and it cuts off whatever long-horizon thesis brought the investor to the fund in the first place. For a buy-and-hold investor, sub-$50M AUM is a yellow flag and sub-$30M is meaningful. AMOM is in the latter zone.
AIEQ at $109M is more comfortable, but still modest by ETF standards. Both funds also carry the bid-ask friction that comes with low average daily volume, which adds an implicit cost on top of the 0.75% expense ratio for any investor rebalancing in or out of the position.
The fee against the only benchmark that matters: a passive index
A 0.75% expense ratio sounds modest in isolation. Compounded over a long horizon, it is not.
Consider an investor placing $50,000 into U.S. large-cap exposure for 25 years at a hypothetical 7% gross annual return. In a 0.03% index ETF, that capital ends at roughly $268,000. In a 0.75% wrapper delivering the same gross return, it ends at roughly $226,000. The fee gap consumed about $42,000 — roughly 16% of the lower-cost ending balance — and this assumes the active wrapper at least matches the index gross. If, as in the AMOM and AIEQ track records to date, the active wrapper produces a negative excess return after fees, the gap widens.
The arithmetic of this is the arithmetic Sharpe (1991) made explicit in his "arithmetic of active management": in aggregate, after fees, the active dollar must underperform the passive dollar. The question for any individual active fund is whether it has produced enough gross alpha to clear its fee. Neither AIEQ nor AMOM has done so against the S&P 500 over the trailing 5-year window.
The macro context (FRED, asof 2026-05-01) sharpens the bar further: with the 10-year Treasury at 4.39% and the Fed Funds rate at 3.64%, the risk-free hurdle for a 0.75%-fee equity strategy is genuinely meaningful. The active premium has to clear the fee plus the opportunity cost of the fixed-income alternative.
At-a-glance scoreboard
| Category | Better | Margin |
|---|---|---|
| Cost | Tie | Both 0.75% |
| Realized 5Y return | AMOM | Material — 520 bp/yr |
| Realized 5Y risk | AIEQ (marginal) | Modest — 110 bp lower vol |
| Capacity / closure resilience | AIEQ | Material — 4× the AUM |
| vs. passive S&P 500 (5Y) | Neither | Both underperform |
| Suitability for long-term core | Neither | Satellite use only |
Editor's read
If forced to hold one of these as a small satellite tilt, the editor leans toward AMOM, but with a specific caveat: the natural comparison is not AMOM versus AIEQ, it is AMOM versus the iShares MSCI USA Momentum Factor ETF (MTUM) at 0.15%. Until an investor can articulate why the QRAFT machine-learning overlay is worth 60 basis points of additional fee against a transparent factor benchmark, the cleaner exposure lives in MTUM. AIEQ is harder to defend at all on the present data — its 5-year track record shows roughly half the return of an index fund at twenty-five times the cost, and the AUM and volatility profile do not support the "AI as risk dampener" framing the category was built on. The honest read on the AI-managed ETF category, as of mid-2026, is that the technology is real but the investor-facing edge has not yet shown up in the realized returns.
Frequently asked questions
Are AIEQ and AMOM beating the S&P 500?
Over the trailing 5 years, no. AIEQ's 4.4% annualized return and AMOM's 9.6% both lag a plain S&P 500 ETF, which compounded at roughly 13% over the same window. AMOM's gap to the index is narrower but still negative after fees.
Why is AMOM outperforming AIEQ if both are "AI-managed"?
The funds run different strategies. AMOM is explicitly momentum-tilted and the 2023–2024 large-cap momentum regime was favorable for that style. AIEQ takes a broader, sentiment-and-fundamentals approach without an explicit factor tilt. Some of AMOM's outperformance is likely paid by its factor exposure rather than by the AI overlay specifically.
Is the 0.75% expense ratio actually a big deal?
Compounded over decades, yes. On $50,000 invested for 25 years at a hypothetical 7% gross return, the fee gap between a 0.75% wrapper and a 0.03% index ETF is roughly $42,000 of ending balance — about 16% of the lower-cost ending value. The active wrapper has to clear that gap in gross return just to break even with passive.
Should I worry about AMOM closing?
At roughly $27M AUM, AMOM is in a size zone where ETF closure becomes a non-trivial scenario. Closure is not catastrophic — proceeds return at NAV — but it forces a taxable event for taxable accounts and ends the strategy regardless of the investor's holding period. Sub-$30M AUM is a meaningful yellow flag for a long-horizon position.
Where would a fund like AIEQ or AMOM fit in a portfolio at all?
At most as a small satellite — single-digit percentage — for an investor who already has broad, low-cost passive exposure as a core holding and who specifically wants exposure to algorithmic strategy as a learning sleeve. Neither fund has the cost profile, capacity, or risk-adjusted track record to anchor a long-term core allocation.
What this comparison can and cannot tell you
The 5-year window is one regime. AIEQ has 8 years of live history, AMOM has 6, and neither covers a credit-driven bear market like 2008. The drawdown numbers above are meaningful but they are conditional on the specific shape of the 2020 and 2022 corrections — fast, equity-led, recovered quickly. A slower recession-driven drawdown would test these algorithms differently. We also do not have a clean factor decomposition of either fund's return. The case that AMOM's outperformance is "momentum factor pay" rather than "AI alpha" is the most natural read of the data, but a formal Fama-French-Carhart attribution would be required to settle it. The numbers in this article describe what happened. They do not prove what will happen, and they do not isolate the specific contribution of the AI process from the underlying factor exposure.
Where each could fit
- Investor with a fully built passive core, curious about algorithmic management as a small experimentation sleeve: a 1–3% position in AIEQ as a "watch the algorithm work" allocation is reasonable, treating it as paid education rather than an alpha bet.
- Investor seeking large-cap momentum exposure specifically: MTUM at 0.15% is the cleaner expression. AMOM is defensible only if the investor can articulate a specific reason to prefer the QRAFT ML overlay over a transparent factor wrapper — and is willing to accept the AUM and capacity risk.
- Investor building a long-term core for retirement in a tax-advantaged account: neither fund. The fee load and the live track record do not yet justify a core position. Broad-index passive exposure does the same job at twenty-five times lower cost.
- Investor in a taxable account with a multi-decade horizon: the closure-driven taxable event risk on AMOM is itself a reason to skip it; AIEQ is marginally safer on that dimension but still hard to justify against a plain index.
For readers thinking specifically about the AMOM-versus-passive question, the standalone analysis in VOO vs. AMOM: Can AI Momentum Outperform the S&P 500? goes deeper on the regime decomposition. The broader question of how AI fits into a disciplined long-horizon framework is covered in The Full Framework for Scientific Investing, and the historical context for what an actually durable algorithmic edge looks like is in How Jim Simons Built the Medallion Fund.
The editor does not hold either AIEQ or AMOM at the time of writing.
Methodology: Price and total-return data sourced via yfinance, pulled 2026-05-05, computed over the trailing 5-year window ending the day before the data pull. Expense ratios and AUM cross-checked against the Amplify ETFs (AIEQ) and QRAFT ETF (AMOM) issuer fact sheets. Macro reference rates from FRED, asof dates noted in-line. The article does not adjust for bid-ask spread or tracking error against any specific benchmark; both factors would, if anything, widen the case against a 0.75%-fee active wrapper relative to a passive index.
This article is for educational purposes and does not constitute personalized financial advice. See the full Disclaimer for details.