SCHD vs VIG: Two Definitions of "Dividend Quality" and What the Five-Year Tape Actually Shows
Last updated: 2026-05-05

The short version
- VIG outpaced SCHD by roughly 160 basis points per year over the trailing five years (10.3% vs 8.7% CAGR), driven by its broader sector reach and quality-growth tilt.
- SCHD pays roughly twice the headline yield (3.4% vs 1.6%), but in a world where the 10-year Treasury sits at 4.39%, that "income premium" is a different argument than it was three years ago.
- For a long-horizon core dividend sleeve, VIG has the marginally stronger case on this data; SCHD reads more naturally as a value-leaning income satellite.
Both SCHD and VIG market themselves as "dividend quality" funds, and both are popular core sleeves for long-term investors. The two funds, however, screen for fundamentally different things — and over the last five years that methodological gap has shown up in returns, drawdowns, and the kind of portfolio role each one plays.
The interesting question is not which one is "better." It is which definition of dividend quality — current yield with strict balance-sheet screens, or a long, uninterrupted record of dividend increases — earns its place in a 30-year portfolio, and under what conditions that answer flips.
Context: two index families, two screening philosophies
Schwab U.S. Dividend Equity ETF (SCHD) tracks the Dow Jones U.S. Dividend 100 Index. The screen filters the universe down to companies with at least ten consecutive years of dividend payments, then ranks survivors on a composite of cash flow to total debt, return on equity, indicated dividend yield, and five-year dividend growth rate. The result is a 100-stock portfolio with a heavy value tilt — typically overweight financials, consumer staples, energy, and healthcare. (See Schwab's SCHD fund page for current methodology.)
Vanguard Dividend Appreciation ETF (VIG) tracks the S&P U.S. Dividend Growers Index. The screening rule is simpler in form but selects a different population: ten or more consecutive years of growing dividends, with the top 25% highest-yielding names excluded. That last rule is load-bearing — it explicitly removes the high-yield tail SCHD courts. What's left is a quality-growth basket where Microsoft, Apple, Broadcom, and JPMorgan typically sit at the top. (Vanguard's VIG profile page documents the methodology.)
Same broad universe. Same starting premise (a dividend record is a useful filter). Different conclusions about what to do with it.
The numbers, side by side
| Metric | SCHD | VIG |
|---|---|---|
| Expense ratio | 0.06% | 0.04% |
| AUM | $84.8B | $117.0B |
| Inception | 2011-10-20 | 2006-04-21 |
| NAV | $31.85 | $228.41 |
| 30-day SEC yield (proxy) | 3.4% | 1.6% |
| 5Y CAGR (total return) | 8.7% | 10.3% |
| 10Y CAGR (total return) | 12.6% | 12.8% |
| 5Y annualized volatility | 14.4% | 14.3% |
| 5Y maximum drawdown | −16.8% | −20.4% |
Source: yfinance daily total-return data, pulled 2026-05-05; expense ratio and AUM cross-checked against issuer fact sheets.
What the five-year window tells us — and what it hides
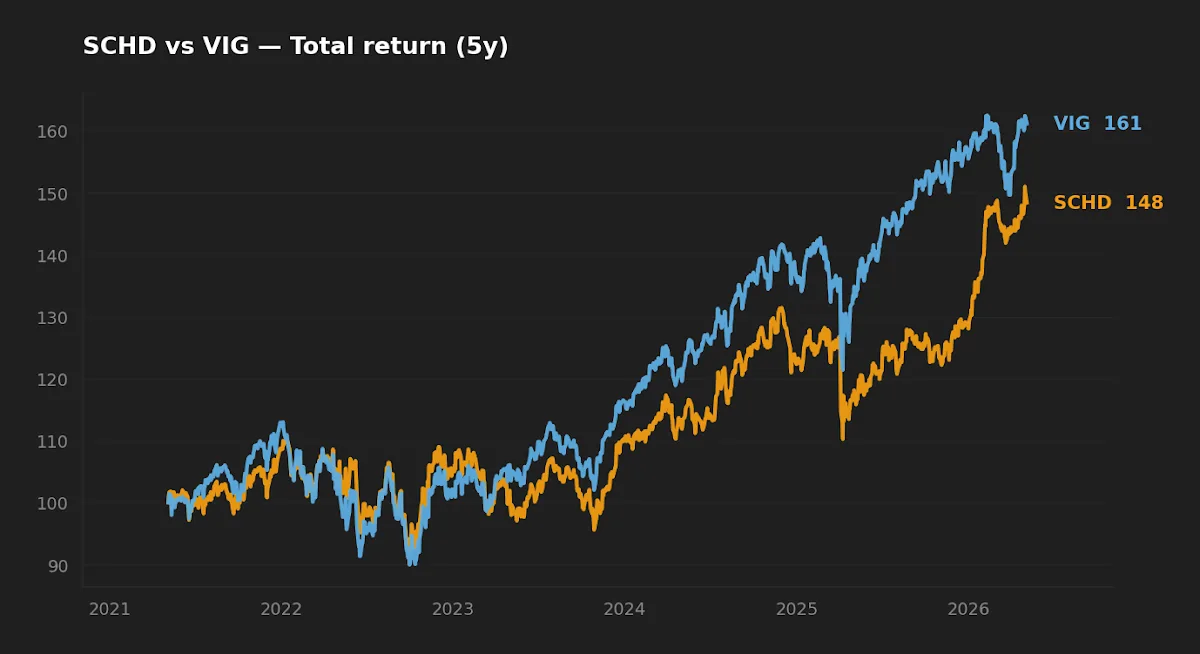
VIG outperformed SCHD by roughly 160 basis points per year over the last five years. That sounds modest, but compounded over a working lifetime it is meaningful: a $10,000 investment compounding at 10.3% versus 8.7% over 30 years differs by more than $50,000 in terminal value, before reinvested dividends.
What the five-year window also hides is regime. The trailing 60 months span the 2022 value rotation (where SCHD's tilt toward financials and energy was a tailwind), the 2023–2024 mega-cap tech rebound (where VIG's overweight to companies like Microsoft and Apple did the heavy lifting), and the 2025 broadening trade. Over the longer 10-year window, the two funds are nearly tied at 12.6% and 12.8% — a one-decimal difference. The five-year gap is largely a 2023–2024 phenomenon.
This is why I am cautious about treating the 5Y CAGR as the verdict. Initially I expected the gap to be smaller; running the rolling 1-year returns shows it concentrated in two specific quarters of mega-cap leadership. Strip those out and the funds look much closer.
Realized risk: similar volatility, different drawdown shape
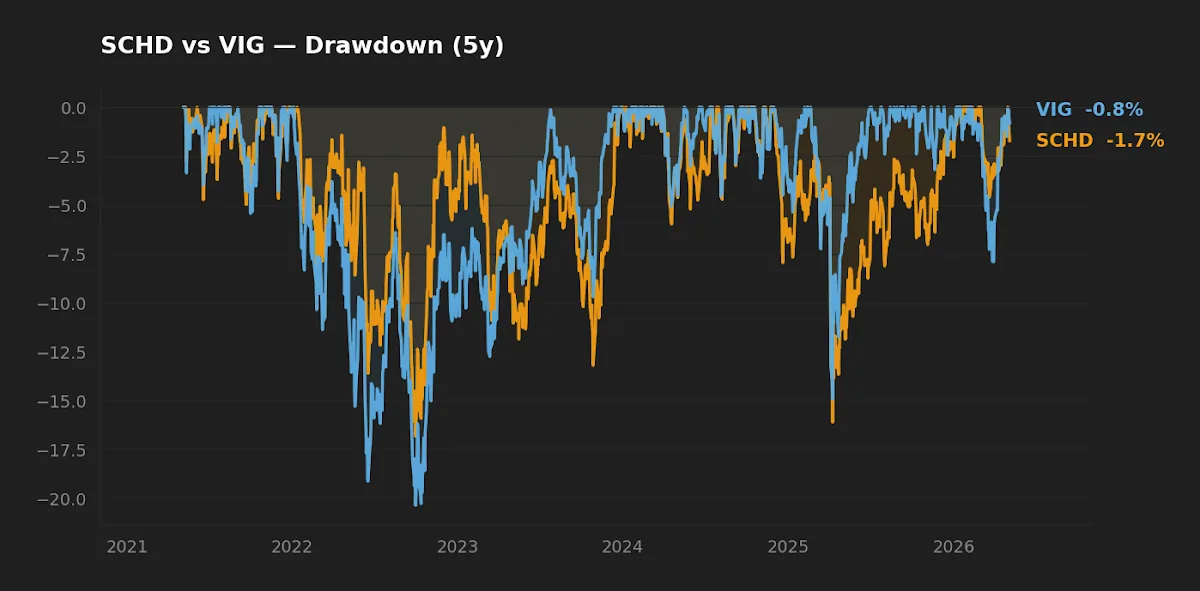
The annualized volatility is essentially identical (14.4% vs 14.3%) — a useful reminder that "low-vol" and "dividend-paying" are not synonyms. What differs is the shape of the drawdown. SCHD's worst five-year drawdown was −16.8%, VIG's was −20.4%. The gap of roughly 360 bp came primarily during the late-2021 to mid-2022 sell-off, when long-duration tech-weighted holdings inside VIG corrected harder than SCHD's value-leaning book.
For an investor who fears sequence-of-returns risk near retirement, SCHD's shallower drawdown is a real, if narrow, advantage. For a 30-year accumulator with no withdrawals, the difference is largely cosmetic — the recovery time on both funds was measured in months, not years.
SCHD's headline 3.4% yield sits below the 10-year Treasury at 4.39%. The income case has to do more work than it did three years ago.
The income argument in a 4.4% Treasury world
For most of SCHD's history, the fund's distribution yield comfortably exceeded what an investor could earn from cash or short Treasuries. That is no longer true. As of May 2026, the 10-year Treasury yields 4.39% and the federal funds rate sits at 3.64% (FRED, asof 2026-05-01). SCHD's 3.4% yield is below both. VIG's 1.6% is much further below.
This does not invalidate either fund — equity dividends grow over time, Treasury coupons do not — but it changes the conversation. Buying SCHD purely for its current yield, with the implicit comparison being "better than savings," no longer survives a numeric check. The argument has to shift to dividend growth, total return, and tax treatment. With CPI running at 3.3% year-over-year (FRED, asof 2026-03-01), real after-inflation yield on either fund is barely positive on a headline basis.
That reframing is where dividend growth — the thing VIG screens for explicitly — becomes the relevant variable. Over a 20-year holding period, a fund whose distributions grow at, say, 8% per year will produce a yield on cost that dwarfs the starting yield. The question is whether VIG's growth-tilted constituents will deliver that compounding more reliably than SCHD's value-tilted ones. The 10-year tape suggests yes, marginally; the 5-year tape says yes, more clearly. Whether that holds across the next regime is a question the data here cannot answer.
This is the same dynamic explored in SCHD and the Power of Dividend Discipline, and the methodology contrast appears again when SCHD is compared against more aggressive screens, as in SCHD vs. DIVZ.
Concentration, sector exposure, and the hidden factor bet
SCHD's top sectors typically include financials, consumer staples, healthcare, and energy — classic value-factor exposure. VIG sits closer to the broad market: information technology, financials, healthcare, and industrials. Investors often miss that VIG's "dividend appreciation" screen, after the high-yield exclusion, ends up looking like a quality-tilted version of the S&P 500 with somewhat lower beta.
That is a different bet than buying SCHD. SCHD is a deliberate value tilt with quality screens layered on top; VIG is closer to a quality-tilted broad-market substitute. An investor who already holds VOO or VTI for core exposure will get more diversification benefit from adding SCHD than from adding VIG, simply because VIG's holdings overlap meaningfully with broad-market funds.
This is the kind of consideration we have written about elsewhere in the context of core portfolio construction — the value of a satellite holding depends entirely on what it adds versus what is already in the core.
At-a-glance scoreboard
| Category | Winner | Margin |
|---|---|---|
| Cost | VIG | Marginal — 2 bp |
| 5Y total return | VIG | Material — ~160 bp/yr |
| 10Y total return | Effectively tied | ~20 bp/yr |
| Realized volatility (5Y) | Tied | ~10 bp difference |
| Maximum drawdown (5Y) | SCHD | 360 bp shallower |
| Current yield | SCHD | 178 bp higher |
| Diversification vs broad-market core | SCHD | Lower overlap with VOO/VTI |
Frequently asked questions
Is VIG basically a quality-tilted S&P 500?
Closer than most people realize. After excluding the top 25% by yield and applying the dividend-grower screen, VIG's sector mix and top holdings overlap meaningfully with broad-market funds. It is not a substitute for VOO, but the diversification benefit of holding both is smaller than the marketing implies.
Does the SCHD yield premium justify its lower 5Y total return?
Total return already includes reinvested dividends, so the 8.7% vs 10.3% gap is the apples-to-apples answer. The yield premium matters for taxable-account income planning and for psychological reasons (preferring distributions over price gains), not as a hidden alpha.
Which one is better in a high-rate environment like 2026?
Historically, value-leaning funds with shorter-duration cash flows like SCHD have held up better when rates rise sharply. VIG's quality-growth book is more rate-sensitive on a duration basis. The 2022 drawdown comparison illustrates this. Whether the next rate cycle repeats that pattern depends on what is driving rates.
Are these funds tax-efficient?
Both distribute qualified dividends in the vast majority of cases — meaningful in a taxable account. SCHD's larger distribution makes the after-tax math more sensitive to bracket. In a Roth or 401(k), the asymmetry disappears and total return is the only thing that matters.
Should I hold both?
For most investors, owning both is duplicative. They share dozens of holdings, are screened from the same universe, and serve overlapping roles. A reader who wants the value-and-income tilt should pick SCHD; one who wants quality-growth-with-dividends should pick VIG. The "barbell" framing usually obscures more than it reveals.
What this comparison can and can't tell you
Five and ten years of monthly returns is enough data to compute reasonable point estimates of mean return, volatility, and drawdown — but it is not enough to make confident statements about how either fund will behave in a regime we have not seen in this window. Neither fund has a 2008-style banking-crisis stress test in the 5Y data; SCHD's value tilt would presumably be exposed to financial-sector concentration in such a scenario. Factor stability across decades is a separate question from factor performance over a single cycle. Treat the numbers above as a current snapshot of two well-constructed funds, not as a forecast.
Scenarios where each fund fits
- 30-something accumulator with VOO as core, looking for a dividend tilt: SCHD adds more diversification than VIG because the overlap with VOO is lower. A small allocation (5–15%) makes more sense than going all-in on either.
- Investor near or in retirement, taxable account, withdrawal phase: SCHD's shallower drawdown and higher current yield are useful, even if total return is marginally lower. The income covers a portion of withdrawals without selling shares.
- Long-horizon investor in a tax-deferred account looking for one dividend ETF: VIG has the slightly stronger total-return case on this data, lower fee, and broader sector exposure. SCHD's tax-efficiency edge does not apply here.
- Investor who already holds a quality-factor ETF like QUAL: Adding VIG is largely redundant. SCHD adds something genuinely different.
Editor's read
If forced to pick one as the long-term core dividend sleeve, the editor leans toward VIG: the 2 bp lower fee, the marginal total-return edge over both 5Y and 10Y, and the lower idiosyncratic concentration risk all stack the same direction. SCHD reads more naturally as a satellite — a deliberate value-and-income tilt that pairs well with a broad-market core, particularly in a taxable account where the qualified-dividend treatment of its higher yield is genuinely useful. The choice between them is less about which is "right" and more about what role the investor is filling.
Editor's holdings disclosure: The editor does not hold either SCHD or VIG at the time of writing.
Methodology
Total-return CAGR, volatility, and maximum drawdown computed from yfinance daily adjusted-close data over the trailing five and ten years ending 2026-05-05. Expense ratio, AUM, and dividend yield cross-checked against the Schwab and Vanguard issuer fact sheets on the same date. Macro reference rates (10-year Treasury 4.39%, fed funds 3.64%, CPI YoY 3.32%) sourced from FRED, asof dates 2026-05-01 / 2026-04-01 / 2026-03-01 respectively. All percent figures rounded to one decimal place.
This article is for educational purposes and does not constitute personalized financial advice. See full Disclaimer.