
The short version
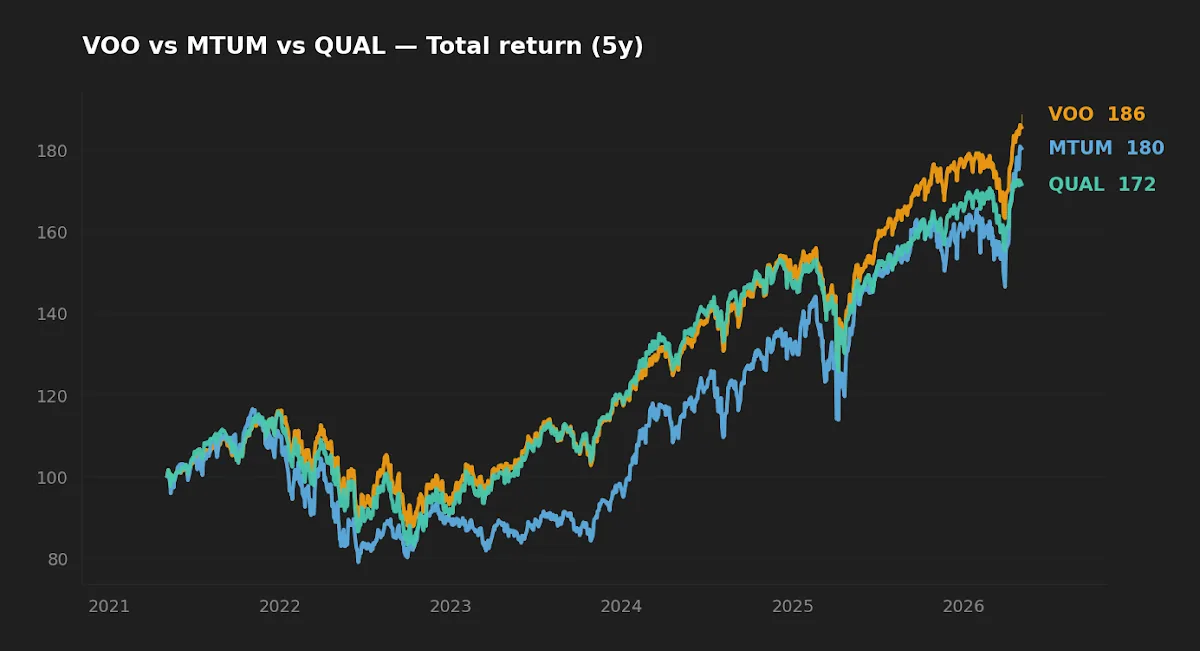
- Over the trailing 5 years, plain VOO (13.1% CAGR) beat both MTUM (11.5%) and QUAL (11.4%) — the factor premium did not show up in this window.
- Over 10 years, MTUM (15.9%) edges VOO (15.0%); QUAL trails at 13.6%. Whichever window you pick, you get a different "winner."
- Bottom line: VOO is hard to displace as a long-term core. MTUM and QUAL are defensible only as small satellite tilts, not core holdings, and only if you accept regime risk.
Over the past five years, plain S&P 500 exposure beat both the momentum and quality factor ETFs that are supposed to deliver a premium over it. That is not the story the academic factor literature predicts, and it is the right place to start a comparison that most retail-facing articles get backwards. The interesting question is not "which factor wins" — the data shows whichever window you pick changes the answer. The interesting question is whether either factor exposure earns its cost, its tracking error, and its drawdown profile inside a long-horizon portfolio.
Context: what each fund actually does
VOO is Vanguard's S&P 500 ETF — market-cap-weighted exposure to roughly 500 large U.S. companies at the lowest fee in the segment. It is a market-beta vehicle and nothing more.
MTUM tracks the MSCI USA Momentum SR Variant Index, which selects roughly 125 large- and mid-cap stocks with the strongest 6- and 12-month risk-adjusted price momentum, rebalanced semi-annually. The intellectual lineage runs through Jegadeesh and Titman (1993) and the cross-sectional momentum literature; in factor terms, MTUM is a high-loading momentum bet that also picks up size and growth tilt depending on the regime.
QUAL tracks the MSCI USA Quality Index, screening on three fundamentals: high return on equity, low debt-to-equity, and low earnings variability. The framing draws from Asness, Frazzini, and Pedersen's "Quality Minus Junk" (2019). It tends to overweight large-cap profitable franchises and underweight leveraged or cyclical names.
All three are large, liquid, and old enough to have lived through at least one stress event — VOO since 2010, MTUM since 2013, QUAL since 2013. The COVID drawdown of 2020 and the rate-driven 2022 selloff are both inside their live track records.
Headline data
| Metric | VOO | MTUM | QUAL |
|---|---|---|---|
| Issuer | Vanguard | iShares | iShares |
| Expense ratio | 0.03% | 0.15% | 0.15% |
| AUM (USD) | $1,421.1B | $20.2B | $46.5B |
| Distribution yield (TTM) | 1.2% | 0.8% | 1.0% |
| Inception | 2010-09-07 | 2013-04-16 | 2013-07-16 |
| 5Y CAGR (total return) | 13.1% | 11.5% | 11.4% |
| 10Y CAGR (total return) | 15.0% | 15.9% | 13.6% |
| 5Y annualized volatility | 16.8% | 20.4% | 17.4% |
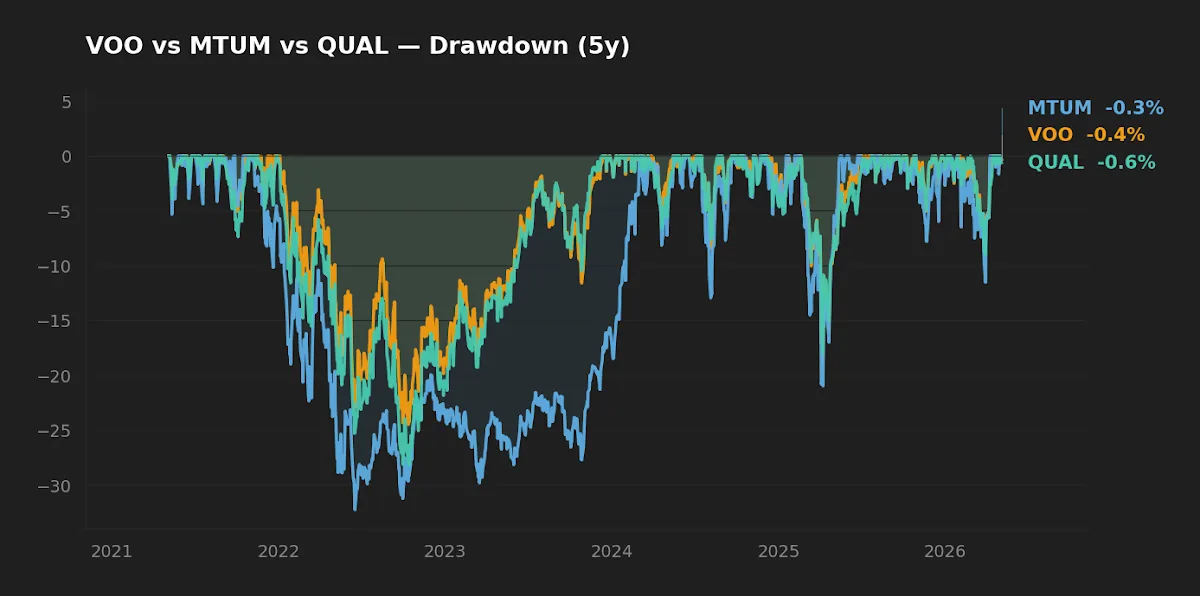
| 5Y max drawdown | -24.5% | -32.3% | -28.2% |
Sources: yfinance adjusted-close series fetched 2026-05-05; expense ratios and methodology from Vanguard's VOO fact sheet, iShares MTUM, and iShares QUAL.
Cost: the certain part of the equation
VOO charges 3 basis points. MTUM and QUAL each charge 15. The 12 bp gap looks small, but it is the only number in this comparison that is not regime-dependent. To put the drag in concrete terms: a $50,000 position growing at 7% net for 30 years compounds to about $374,300 at a 0.03% fee and about $361,600 at a 0.15% fee — roughly $12,700 of terminal-value drag, or 3.4% of the ending balance, surrendered for the factor exposure. The factor has to outperform that drag on a risk-adjusted basis to be worth holding. As we will see, that is not a trivial bar.
Realized risk: where the factor exposure shows up
MTUM's 5-year annualized volatility (20.4%) sits roughly 360 bp above VOO (16.8%), and its max drawdown was about 8 percentage points deeper. This is what factor exposure costs in lived experience. Momentum portfolios reload toward whichever segment has just outperformed; when the regime breaks — as it did in late 2022 when high-growth names led on the way up and led again on the way down — the same concentration that drove the upside drives the drawdown. QUAL's profile is gentler: vol is only marginally above VOO, and the drawdown was about 4 points deeper. The quality screen does not buy you obvious downside protection in this sample; it buys you a portfolio that looks more like the index, with a slight large-cap-profitable tilt.
A back-of-envelope Sharpe with a 3.6% risk-free rate (Fed funds, FRED, asof 2026-04-01) for the 5-year window: VOO ≈ 0.56, QUAL ≈ 0.45, MTUM ≈ 0.39. On risk-adjusted terms over this stretch, plain VOO won.
The 10-year window says MTUM wins. The 5-year window says VOO wins. Both are "the data" — and that is the problem with treating any single window as the verdict.
The factor premium is regime-conditional, and that matters more than the headline
This is the part most factor write-ups skip. MTUM's 10Y CAGR (15.9%) beats VOO's (15.0%) by about 90 bp per year. But the 5Y CAGR is reversed: VOO (13.1%) beats MTUM (11.5%) by about 155 bp per year. That implies most — if not all — of MTUM's 10-year advantage was earned in the first half of the window (2016–2020), and the trailing five years have been working against it. QUAL tells a similar but milder story: roughly inline with VOO over 10 years, behind it over 5.
This is what academics call regime-conditional alpha. Momentum strategies tend to do well when leadership is persistent (a few sectors keep winning quarter after quarter) and tend to suffer in transition regimes (2022's rate shock, late 2023's narrow AI-led rally followed by reversals). Quality screens reward stable franchises in equity downcycles but lag in early-cycle recoveries when low-quality, leveraged names lead off the bottom. Neither factor is broken; both are doing what the literature says they should do, conditionally. The honest reading is not that either fund "won" — it is that the timing of when you buy a factor ETF matters more than the choice between MTUM and QUAL, and the typical retail investor has no edge in that timing call. For deeper context on why factor investing still has merit but rarely in the way it is sold, our master guide to evidence-based ETF portfolios covers the framework.
Capacity, scale, and what the live data cannot tell us
VOO at $1.42 trillion in AUM is a different kind of vehicle from MTUM at $20 billion. Capacity is not a concern for any of them at retail size, but it is worth noting that MTUM's semi-annual rebalancing creates real turnover — the iShares fact sheet lists turnover well above the index ETF — and turnover compounds into a tax-cost drag in taxable accounts that is invisible in the headline expense ratio. Holding MTUM in a Roth or 401(k) sidesteps this; holding it in a taxable account gives back some of the factor premium to the IRS. The same caveat applies less severely to QUAL (lower turnover) and not at all to VOO. If you are evaluating these for a brokerage account, the after-tax comparison is materially different from the pre-tax one.
What the data cannot tell us: whether the next decade looks like the last one. Factor returns are notoriously sensitive to data-mining concerns, look-ahead bias in backtests, and decay as strategies become crowded. MTUM and QUAL have roughly 13 years of live data each — better than most factor products, but still one full cycle and change. Treating any 10-year backtest as "the answer" overweights a single regime.
At-a-glance scoreboard
| Category | Winner | Margin |
|---|---|---|
| Cost | VOO | Material — 12 bp/yr |
| Realized return (5Y) | VOO | ~155 bp/yr over MTUM |
| Realized return (10Y) | MTUM | ~90 bp/yr over VOO |
| Realized risk (5Y vol & MDD) | VOO | Strong |
| Risk-adjusted (5Y Sharpe) | VOO | ~0.56 vs 0.39 / 0.45 |
| Suitability for long-term core | VOO | Strong |
| Suitability as a satellite tilt | MTUM or QUAL | Conditional on regime view |
Scenarios where each fund actually fits
- Investor in their 30s building a 401(k)-only core. VOO (or its mutual-fund equivalent). The 12 bp savings compound over 35+ years, the broad exposure removes regime-bet risk, and the simplicity reduces behavioral mistakes during drawdowns. MTUM/QUAL are hard to justify as the core here.
- Investor with a fully built broad-market core who wants a 5–10% factor satellite. QUAL is the easier defense: lower drawdown than MTUM, similar 10Y profile to VOO, and behaves more like a refined index than a regime bet. Acceptable as a tilt; do not expect it to "save" the portfolio in a downturn.
- Investor with strong conviction that price-momentum regimes will persist over the next decade. MTUM is the cleanest expression. But this is a regime bet, not a core holding, and should be sized accordingly. If the next decade is a regime-transition decade, the same data that sold MTUM will be the data that explains its underperformance.
- Taxable-account investor. VOO is materially more tax-efficient than MTUM (turnover-driven distributions). QUAL sits in between. The after-tax comparison shifts the case further toward VOO for taxable holdings.
Editor's read
If forced to pick one for the long-term core sleeve, the editor leans clearly toward VOO. The 12 bp fee advantage is unforgiving over decades, the 5-year risk-adjusted numbers favor it, and the broad exposure removes the implicit regime bet baked into either factor product. QUAL is a defensible 5–10% satellite for an investor who already owns broad market exposure and wants a small tilt toward profitable-franchise quality; the case for MTUM as anything beyond a tactical satellite has weakened materially in the trailing five years. The earlier numerical-backtest version of this comparison framed the same question differently; this revision reflects the updated data and a more honest reading of regime risk.
FAQ
Q: Did factor ETFs really underperform plain VOO over the last 5 years? Why?
Yes. Over the trailing 5 years, VOO returned 13.1% annualized versus MTUM at 11.5% and QUAL at 11.4%. The most likely explanation is regime: 2022's rate-driven selloff hit momentum-led growth names hard, and 2023–2024's narrow leadership rotated quickly enough to penalize MTUM's semi-annual rebalancing. Factor premia are real on long horizons but conditional in any specific window.
Q: Does MTUM's 10-year lead over VOO mean it is the right long-term bet?
Not by itself. The 10-year MTUM advantage (~90 bp/yr) was earned mostly in the first half of the window. If the next decade resembles the trailing 5 years more than the trailing 10, MTUM underperforms net of fees and tax drag. The data is consistent with the academic finding that momentum works on long averages but is highly path-dependent.
Q: How much of MTUM's premium survives the 12 bp expense gap and turnover?
In a tax-advantaged account, the expense gap alone consumes about 12 bp of any gross alpha. In a taxable account, MTUM's higher turnover adds an additional tax-cost drag that further erodes the after-tax premium. A factor needs to deliver materially more than 12 bp of alpha to be worth holding over VOO; over the trailing 5 years it has delivered negative alpha.
Q: Does QUAL behave like a low-volatility fund?
Not really. Its 5-year volatility (17.4%) is only modestly below MTUM and slightly above VOO. The quality screen rewards profitability and balance-sheet strength, not low beta. Investors looking for genuine low-vol exposure should look at funds explicitly built for that factor rather than expecting QUAL to provide it.
Q: Are factor ETFs worth holding in a core portfolio at all?
For most long-horizon individual investors, no. The cost, regime risk, and tax drag make them better suited as small satellite positions than as core building blocks. The core argument for broad index exposure remains: low cost, low turnover, no regime bet, and behavioral simplicity during stress. Factor tilts can be defensible at the margin but should be sized as such.
Key takeaways
- Over 5 years, VOO beat both MTUM and QUAL on absolute return, volatility, drawdown, and Sharpe. Over 10 years, MTUM edges VOO; QUAL trails. The "winner" depends entirely on the window.
- The 12 bp expense gap is the only certain number in this comparison and compounds against the factor ETFs every year regardless of regime.
- MTUM's 8-point-deeper 5Y drawdown is the lived cost of momentum exposure. QUAL's drawdown was also worse than VOO's in this window.
- For taxable accounts, MTUM's turnover adds an after-tax drag that is invisible in the headline ER and shifts the comparison further toward VOO.
- Reasonable use of MTUM and QUAL is as a small satellite tilt for an investor who already owns broad market exposure — not as a core replacement for VOO.
What this comparison can and can't tell you
The 5- and 10-year numbers cover roughly one and a half cycles each — long enough to see how each fund handled COVID, the 2022 rate shock, and the 2023–2024 narrow-leadership rally, but not long enough to be the verdict. Factor premia documented in academic backtests run over 50+ years; 13 years of MTUM and QUAL live data is a small sample by that standard. None of these funds has been tested in a prolonged stagflation regime or a credit-driven recession comparable to 2008. Treat any single-window CAGR comparison as one input, not the answer.
The editor does not currently hold MTUM or QUAL. The editor holds broad U.S. market exposure equivalent to VOO as part of a long-horizon allocation managed via the open-source rebalancing tool.
Methodology
Total-return CAGR, annualized volatility, and max drawdown computed from yfinance adjusted-close daily series, fetched 2026-05-05. The 5-year window covers approximately May 2021 – May 2026; the 10-year window covers approximately May 2016 – May 2026. Volatility is annualized from daily log returns (252-day convention). Sharpe ratio uses a risk-free proxy of 3.64% (effective Fed funds rate, FRED, asof 2026-04-01). Expense ratios, AUM, distribution yields, inception dates, and methodology descriptions taken from each issuer's fact sheet as of 2026-05-05.
This article is for educational purposes and does not constitute personalized financial advice. See the Disclaimer for full terms.