
The short version
- QQQM and QRFT both invest in U.S. large caps, but the construction logic — index-mechanical versus model-driven multi-factor — produces very different fee, concentration, and drawdown profiles.
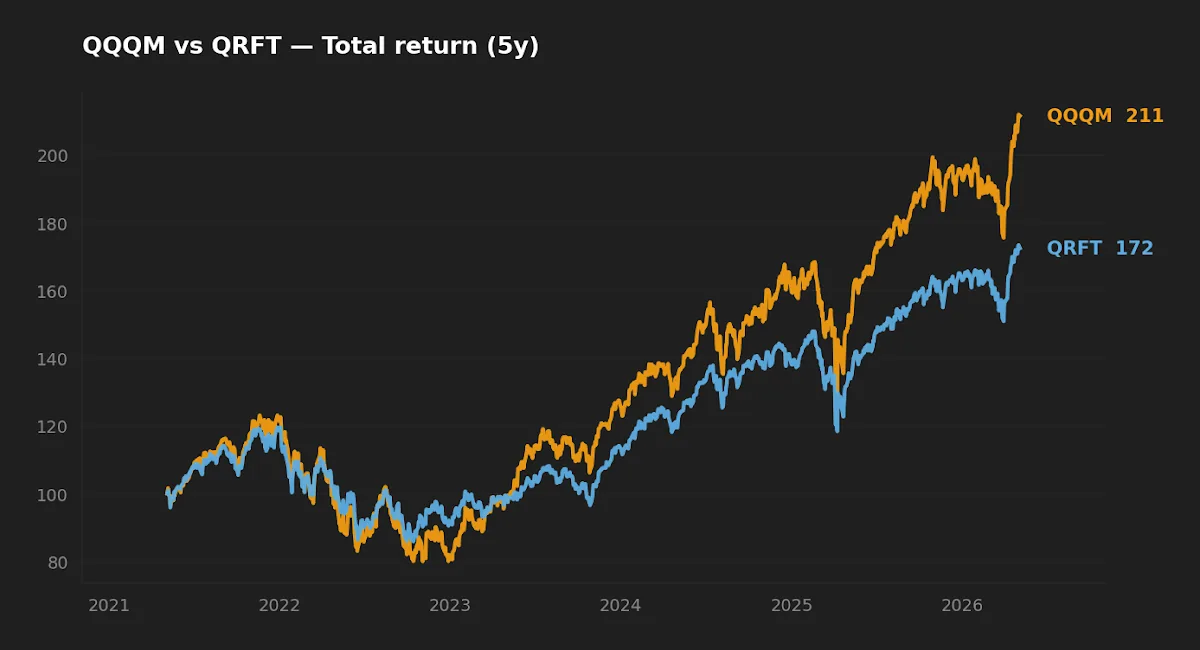
- Over the trailing five years, QQQM compounded at 15.5% annualized against QRFT's 10.5%, but QRFT took a shallower max drawdown (-28.2% vs -35.0%) on lower realized volatility.
- The decision is less about which fund "wins" and more about whether a 0.60% annual fee, $16M AUM, and concentrated factor bets fit alongside whatever core exposure the reader already owns.
Two ETFs, both U.S. large cap, both pitched as disciplined construction. One charges 0.15% and replicates the Nasdaq-100 mechanically. The other charges 0.75% and rebuilds a large-cap universe with a multi-factor model under an "AI-enhanced" label. Over the past five years the cheaper, simpler wrapper delivered roughly five percentage points more annualized return — and a deeper drawdown along the way. The interesting question for a long-horizon holder is which of those gaps actually matters more.
This piece compares Invesco NASDAQ 100 ETF (QQQM) with QRAFT AI-Enhanced U.S. Large Cap ETF (QRFT) on cost, factor exposure, realized risk, and capacity, using fund data pulled on 2026-05-05.
Context: same universe, different construction logic
QQQM tracks the Nasdaq-100 Index, which holds the 100 largest non-financial companies listed on Nasdaq, weighted by modified market cap. The methodology is deterministic and disclosed by the index provider. Because Nasdaq listings skew toward technology and consumer-platform businesses, QQQM ends up with roughly half its weight in information technology and another 15-20% across communication services and consumer discretionary, with no direct exposure to financials, energy, real estate, or utilities. The wrapper is "broad" only in name; functionally it is a concentrated growth-and-tech sleeve packaged at index-fund cost.
QRFT, run by QRAFT Technologies, takes a U.S. large-cap universe and combines several academic factors — quality, value, momentum, low volatility, and size — into a composite score, then holds the highest-scoring constituents at periodic rebalances. The fund is actively managed but rules-driven, with the rules generated by a model rather than a discretionary portfolio manager. The realized portfolio is more sector-balanced than QQQM, with meaningful weight outside mega-cap technology.
The pricing reflects the difference. QQQM at 0.15% is one of the cheapest U.S. large-cap growth wrappers available. QRFT at 0.75% sets a much higher bar: the model has to add enough risk-adjusted return after fees to justify the gap. We have explored the methodological case for factor investing in an earlier piece on Fama-French in the AI era; the empirical question here is whether one specific implementation has earned its premium.
Data table
Numbers are from yfinance, retrieved 2026-05-05. Inception, expense ratio, and AUM cross-check against the issuer fact sheets. CAGR and volatility are computed over the trailing five-year window; max drawdown is the largest peak-to-trough decline within that window. Realized Sharpe uses a zero risk-free rate to keep the comparison clean — using the prevailing 3.64% Fed funds rate (FRED, asof 2026-04-01) would shift both numbers down by similar amounts and would not change the ordering.
| Metric | QQQM | QRFT |
|---|---|---|
| Name | Invesco NASDAQ 100 ETF | QRAFT AI-Enhanced U.S. Large Cap ETF |
| Inception | 2020-10-13 | 2019-05-20 |
| Expense ratio | 0.15% | 0.75% |
| AUM | $68.8B | $16.4M |
| Dividend yield (TTM) | 0.5% | 0.3% |
| NAV (2026-05-05) | $277.52 | $66.34 |
| 5Y CAGR | 15.5% | 10.5% |
| 5Y annualized volatility | 22.3% | 17.4% |
| 5Y max drawdown | -35.0% | -28.2% |
| Realized Sharpe (rf=0) | 0.70 | 0.60 |
Source notes: QQQM data and methodology — Invesco fund page (QQQM); QRFT data and methodology — QRAFT fund page (QRFT). Macro reference points: 10-year Treasury 4.39%, VIX 16.99 (FRED, asof 2026-05-01).
The 60 basis point fee gap, in compounding terms
The headline fee difference is 0.60% per year. To make that concrete: an investor placing $50,000 in either fund for 25 years and earning identical 7% gross annualized returns ends with roughly $271,000 in QQQM and $235,000 in QRFT. The $36,000 difference is fee drag — pure overhead, nothing to do with what either fund holds. That math is not a verdict; it is the bar the QRFT model has to clear every year, on average across full cycles, just to tie at the after-fee level.
Over the trailing five-year window the realized after-fee CAGR gap was much larger than 60 bp — closer to a five-percentage-point shortfall — but reading that as a permanent verdict overweights a single regime. Initially I expected the gap to narrow once the analysis isolated the fee component, but the 2020-2025 window was unusually concentrated in mega-cap technology, exactly the regime that mechanically penalizes a factor-balanced wrapper. The right framing is that QRFT needs roughly 60 bp of net factor alpha across cycles to justify its existence; whether it has earned that bar is something we cannot answer from a six-year live track record covering one dominant regime.
Realized risk: where QRFT actually delivers
The volatility numbers favor QRFT. Annualized 5-year volatility was 17.4% against 22.3% for QQQM — roughly four-fifths of the Nasdaq-100 swing. The 5-year max drawdown was -28.2% for QRFT against -35.0% for QQQM, consistent with a portfolio less concentrated in long-duration growth names and with an explicit low-volatility tilt in the factor blend.
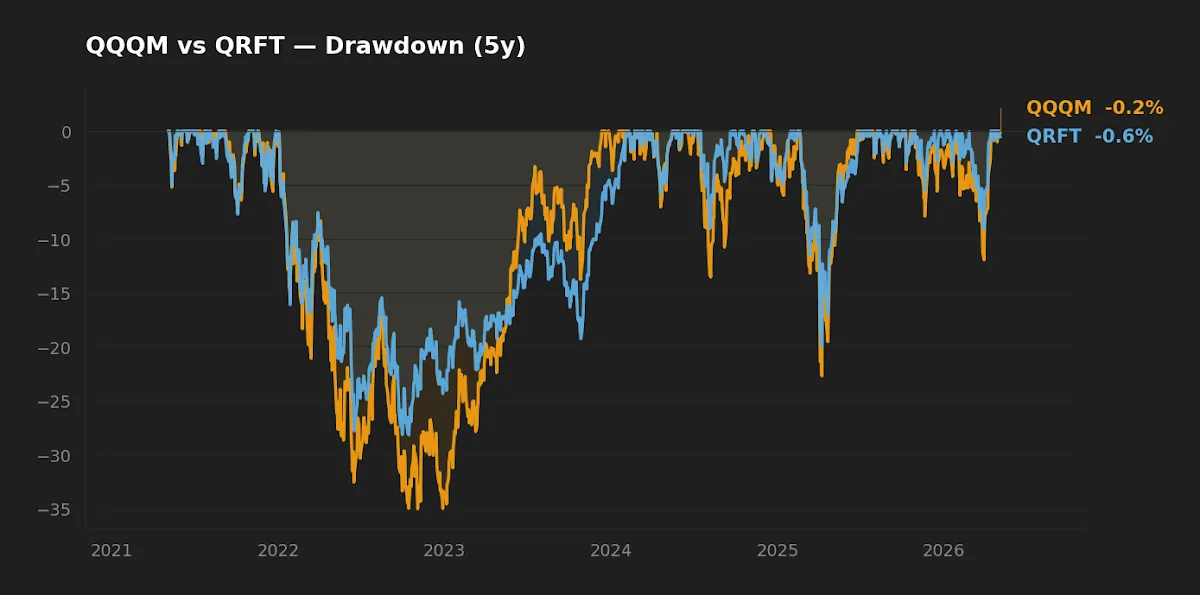
For an investor genuinely worried about sequence-of-returns risk in early retirement, or about a defined drawdown window such as tuition funding, the smaller realized drawdown is a real feature, not just a softer line on a chart. The empirical record on investor behavior is consistent: realized investor returns lag fund returns largely because of poorly-timed selling during deep drawdowns. A wrapper an investor can actually hold through a full cycle is worth more than a wrapper with a higher trailing CAGR they sell at the bottom. The roughly seven-percentage-point difference in worst-case drawdown is small in raw numerical terms and very large behaviorally — a point we developed in a separate piece on surviving a crash.
The "AI-enhanced" label describes the technique used to combine signals; it is not a separate source of return. The factors underneath — quality, value, momentum, low volatility, size — have been documented in academic finance for decades.
Factor exposure and the "AI" label
QQQM's exposures, in factor terms, are dominated by large-cap, growth, and momentum, with a heavy sector tilt to technology and communication services. There is no value tilt and effectively no small-cap exposure. The fund's tracking error against a broad U.S. market index is meaningful and largely sector-driven — it diverges from the market in both directions when the relative fortunes of mega-cap tech diverge from everything else.
QRFT, by design, runs a more diversified factor book. Quality and low-volatility tilts pull the portfolio toward profitable, lower-beta companies; the value sleeve adds names trading at lower multiples than the growth-heavy Nasdaq-100; momentum keeps it in trending winners. Because the model rotates exposures at each rebalance, the realized factor mix at any given moment is not a constant — that is both the appeal (the model can lean into what is working) and the risk (factor rotation can mistime regime changes, and the snapshot in any prospectus may not match the holdings six months later). Treat QRFT as a multi-factor U.S. large-cap fund with an active overlay and a 0.75% fee, judged against other multi-factor wrappers, not as a separate asset class.
Capacity, liquidity, and closure risk
The AUM gap deserves its own treatment because it changes the risk profile in a way the headline expense ratio does not capture. QQQM has roughly $68.8B in assets and is one of the most heavily traded ETFs in the U.S. — bid-ask spreads at retail size are negligible, creation-redemption is liquid, and there is effectively no fund-closure risk on a multi-decade horizon. QRFT has roughly $16.4M. That is genuinely small for a U.S.-listed ETF.
Two practical consequences follow. First, secondary-market spreads on QRFT can be wider than on a large-AUM peer, particularly outside the open and close, which raises the effective cost of trading. Second, U.S. ETF issuers do close small funds — the threshold at which a sponsor decides a product is not commercially viable varies, but the empirical tail is observable in industry data. A forced closure typically results in a taxable distribution at the sponsor's chosen date, not at the shareholder's chosen date. None of this makes QRFT unownable; it does mean the small-AUM tax should be added to the headline 0.75% when estimating total cost of ownership.
At-a-glance scoreboard
| Category | Winner | Margin |
|---|---|---|
| Cost | QQQM | Material — 60 bp/yr |
| Capacity / liquidity | QQQM | Decisive — ~4,200× AUM |
| Realized return (5Y) | QQQM | Wide — 5.0 pp/yr |
| Realized risk (5Y) | QRFT | Modest — 4.9 pp lower vol, 6.8 pp shallower drawdown |
| Risk-adjusted return (Sharpe) | QQQM | Marginal — 0.70 vs 0.60 |
| Suitability for long-term core | QQQM | Strong, with the standard concentration caveat |
Frequently asked questions
Does QRFT's small AUM really matter for a buy-and-hold investor?
It matters more than retail-facing materials usually suggest. AUM near $16.4M creates two practical risks: wider effective spreads at the point of trading, and a non-trivial probability that the issuer eventually closes the fund and forces a taxable distribution at a moment of the issuer's choosing rather than the shareholder's. Neither makes a small ETF unownable, but both reduce realized after-cost performance below what the published expense ratio implies. By contrast, QQQM at $68.8B has effectively no liquidity or closure risk on a multi-decade horizon.
Is "AI-driven" a meaningful descriptor or marketing?
Mostly descriptive of method. The factors QRFT combines have been documented in academic finance going back several decades. Machine learning is the technique used to weight those signals; it is not a separate source of return. The honest evaluation of QRFT is the evaluation of any multi-factor fund: are the factors well chosen, is the implementation cost reasonable, and does the realized portfolio match the description?
Do QQQM and QRFT overlap enough to be redundant?
They overlap meaningfully on individual names — both will hold many of the same large-cap U.S. companies — but they are not redundant in factor terms. QQQM concentrates in growth and technology; QRFT diversifies across quality, value, and low volatility. Holding both moves the combined portfolio closer to broad U.S. large-cap with a mega-cap-tech tilt, at a blended fee somewhere between 0.15% and 0.75% depending on weights. For most investors, holding a broad-market ETF alongside QQQM is a cleaner way to achieve that effect — see our prior comparison of VOO and QQQM.
Why is the dividend yield so low on both?
QQQM's TTM yield is 0.5% and QRFT's is 0.3%. Both are low because both tilt toward growth and quality companies that reinvest earnings rather than distribute them. An investor whose primary goal is current income should not start with either; the appropriate comparison set is broad-market dividend or high-yield-equity ETFs, which is a different analysis.
How should the trailing five-year window be interpreted?
With caution. The window is short relative to a full market cycle, and 2020-2025 was an unusually strong regime for U.S. mega-cap technology, which is QQQM's natural beneficiary. A factor-balanced portfolio that intentionally caps mega-cap-growth concentration was, mechanically, going to lag in such a regime. Whether that lag persists depends on whether the regime persists — which is not a question anyone can answer with confidence.
What this comparison can and can't tell you
The trailing five-year window covers one dominant regime: low-then-rising rates, narrow leadership in mega-cap technology, and the early innings of the AI capex cycle. We do not yet have a 2008-style credit-driven stress test for QRFT — its full live history begins in 2019. The 5Y CAGR comparison is meaningful, but treating it as the verdict overweights a single regime. We also cannot directly observe QRFT's factor loadings month by month from public data; the rebalance-driven rotation means a snapshot in one quarter may differ materially from the next.
Scenarios where each fund fits
- Reader in their 30s, broad-market core already in place via VOO/VTI, looking for a growth tilt: QQQM as a 10-25% satellite is a defensible way to add explicit large-cap-growth exposure at index-fund cost. QRFT is harder to justify in that role given the fee and AUM.
- Reader within a decade of retirement, prioritizing shallower drawdowns over peak return: A factor-diversified wrapper has appeal, but the right comparison set is large-AUM multi-factor or quality ETFs, not a $16M sleeve. QRFT's realized risk profile is genuinely better than QQQM's, but you can buy a similar profile elsewhere with less closure risk.
- Reader with a small portfolio (<$25k) and one slot for U.S. equities: Neither fits as the only U.S. equity holding. A broad-market ETF belongs there first; QQQM or QRFT comes later as a tilt, if at all.
- Reader who specifically wants exposure to a model-driven multi-factor strategy: QRFT is internally consistent with that thesis. The questions to answer are whether its factor blend matches the literature you find persuasive and whether 0.75% is competitive against alternative multi-factor wrappers.
Editor's read
If forced to pick one for a long-term core or growth-tilt sleeve, the editor leans toward QQQM. The 60 bp fee gap compounds unforgivingly over decades, the $16M AUM at QRFT carries closure risk that is rarely priced in, and the "AI" branding is descriptive rather than alpha-generating. QRFT is not a bad fund — its drawdown discipline is real — but the same factor exposure can usually be obtained through larger, cheaper multi-factor wrappers. The strongest case for QRFT is a small satellite for an investor who already owns broad-market exposure and specifically wants a model-driven factor overlay; the weakest case is replacing a core position with it.
Editor's holdings disclosure: the editor does not hold either QQQM or QRFT at the time of writing.
Methodology. Price-history-derived statistics (5Y CAGR, annualized volatility, max drawdown, realized Sharpe) computed from yfinance daily total-return series, retrieved 2026-05-05, over the five-year window ending 2026-05-05. Expense ratio, AUM, NAV, and inception cross-checked against issuer fact sheets linked above. Macro reference points from FRED (10Y Treasury asof 2026-05-01, Fed funds rate asof 2026-04-01, VIX asof 2026-05-01, headline CPI YoY asof 2026-03-01). Realized Sharpe uses a zero risk-free rate for cross-fund comparability; substituting a positive short rate shifts both numbers in parallel.
Key takeaways
- QQQM is materially cheaper (0.15% vs 0.75%), much larger ($68.8B vs $16.4M AUM), and concentrated in mega-cap growth and technology — a focused tilt at index-fund cost.
- Over the trailing five-year window, QQQM compounded at 15.5% annualized versus 10.5% for QRFT, with 22.3% and 17.4% realized volatility respectively.
- QRFT delivered a shallower max drawdown (-28.2% vs -35.0%) — a meaningful behavioral feature for investors who care about hold-through during stress, even if the headline return lagged.
- 5Y realized Sharpe (rf=0) was 0.70 for QQQM against 0.60 for QRFT; the strong tech regime in the window favored the more concentrated wrapper, which limits how much the result generalizes.
- The choice is less about which fund "wins" and more about which factor exposures and which capacity profile fit alongside the rest of an investor's holdings; broad-market exposure remains the appropriate core for most long-horizon investors.
This article is for educational purposes and does not constitute personalized financial advice. See full Disclaimer.
— the Mulden editor