The short version
- Gold and bonds get grouped as "safe havens", but they hedge different risks — real rates and fiat credibility for gold; nominal yields and growth expectations for bonds. They are not substitutes.
- 2022 is the test case the five-year data still remembers: AGG's 5Y max drawdown sits at -17.8% and BND's at -17.9% — within shouting distance of gold's -21.0%, despite "bond" and "gold" feeling like opposite assets.
- For a long-horizon investor in 2026, the question isn't gold or bonds. It is how much of each, what duration of bonds, and which role you actually need — volatility damping (intermediate bonds), monetary-tail insurance (gold), or a positive-real-yield parking spot (SGOV).
The phrase "smart money hides during uncertainty" is one of the more misleading sentences in financial media. Capital does not hide — it gets repositioned, and the right repositioning depends entirely on which kind of uncertainty you are worried about. Gold and bonds get filed together as defensive assets, but they hedge different risks, and in some regimes they fall at the same time. 2022 was one of those regimes, and the trailing five-year data through May 2026 still carries its fingerprints.
The two roles, briefly stated
Investment-grade duration ETFs like the iShares Core U.S. Aggregate Bond ETF (AGG) and the Vanguard Total Bond Market ETF (BND) are interest-rate instruments. Their price moves inversely with nominal yields. When growth slows and the Federal Reserve eases, intermediate Treasuries rally. That is the textbook diversification case for a 60/40 portfolio: in the equity drawdowns of 2000–2002 and 2008–2009, intermediate Treasuries delivered positive total return and offset some of the equity loss.
Gold — accessed cheaply through GLD or its lower-fee sibling GLDM — is a different animal. It pays no coupon, has no earnings, and its value derives from being a non-sovereign monetary asset. It tends to perform when real interest rates fall, when the dollar weakens, or when the credibility of fiat currency comes into question (geopolitical fragmentation, sustained sovereign debt expansion, central bank purchases). It does not reliably hedge equity drawdowns the way bonds historically have — it hedges monetary drawdowns. The short-duration end, represented here by the iShares 0-3 Month Treasury Bond ETF (SGOV), is a third role entirely: a positive-real-yield place to park cash that carries almost no duration risk.
The funds in this comparison — the actual numbers
| Ticker | Fund | Expense | AUM | Yield | 5Y CAGR | 10Y CAGR | 5Y Vol | 5Y Max DD | Inception |
|---|---|---|---|---|---|---|---|---|---|
| GLD | SPDR Gold Shares | 0.40% | $153.5B | 0.0% | 19.4% | 13.2% | 17.9% | -21.0% | 2004-11 |
| GLDM | SPDR Gold MiniShares | 0.10% | $31.0B | — | 19.7% | n/a | 17.9% | -20.9% | 2018-06 |
| AGG | iShares Core U.S. Aggregate Bond | 0.03% | $135.4B | 4.0% | 0.1% | 1.6% | 6.1% | -17.8% | 2003-09 |
| BND | Vanguard Total Bond Market | 0.03% | $389.7B | 3.9% | 0.1% | 1.6% | 6.0% | -17.9% | 2001-11 |
| SGOV | iShares 0-3 Month Treasury | 0.09% | $85.2B | 3.9% | 3.5% | n/a | 0.2% | -0.0% | 2020-05 |
Source: yfinance, fetched 2026-05-16. Expense ratios cross-checked against issuer fact sheets linked above. CAGR, volatility, and max drawdown computed on trailing 5-year total-return windows. SGOV and GLDM lack a full 10-year history because their inception dates are 2020 and 2018 respectively.
What the 5-year window actually shows
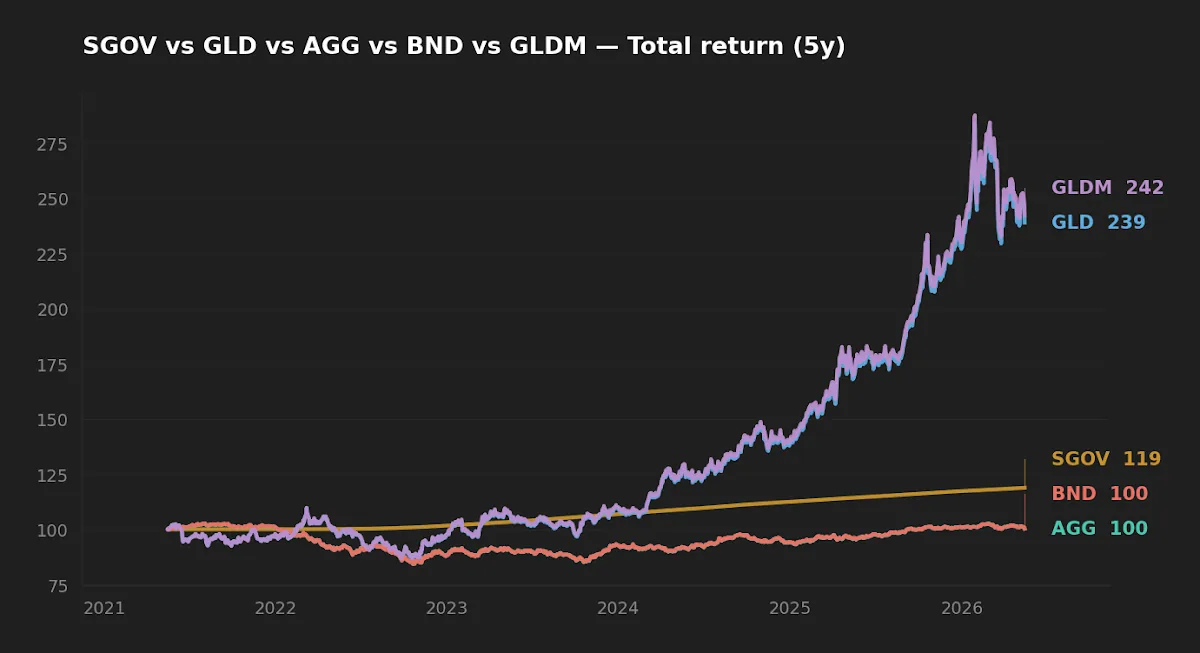
The most striking line in the table is not the gold return — it is what happened to the bonds. AGG and BND, both diversified investment-grade aggregates with effective duration near 6 years, have compounded at roughly 0.1% annually over the past five years. Their longer 10-year CAGRs of 1.6% are themselves modest, but the 5Y number is essentially flat. The reason is sitting in the max-drawdown column: a -17.8% to -17.9% peak-to-trough loss, which is overwhelmingly the 2022 rate-shock event. Gold over the same five years compounded at 19.4–19.7% annually, with similar volatility (17.9%) to its own historical norm and a peak drawdown of around -21%.
Two takeaways from these numbers, neither of which is "gold beat bonds":
- Gold's realized return is regime-specific. Five years that include a major inflation shock, a sustained period of central bank purchases, and persistent geopolitical risk premia is not a representative 5Y window for gold. A long-horizon expected return for gold remains essentially the real risk-free rate plus a small premium — not 19%/year.
- Bonds did not "fail." They did exactly what fixed-income instruments do when discount rates re-price upward: their NAV fell. The 4% starting yield available today is itself the consequence of that re-pricing — and a much better entry point than what existed five years ago. Forward returns for investment-grade bonds are dominated by starting yield, not by trailing return.
Realized risk: how 2022 still distorts the picture
If you only look at standard deviation, AGG and BND at ~6% appear to be roughly one-third the volatility of GLD/GLDM at ~18%. The drawdown picture tells a more honest story.
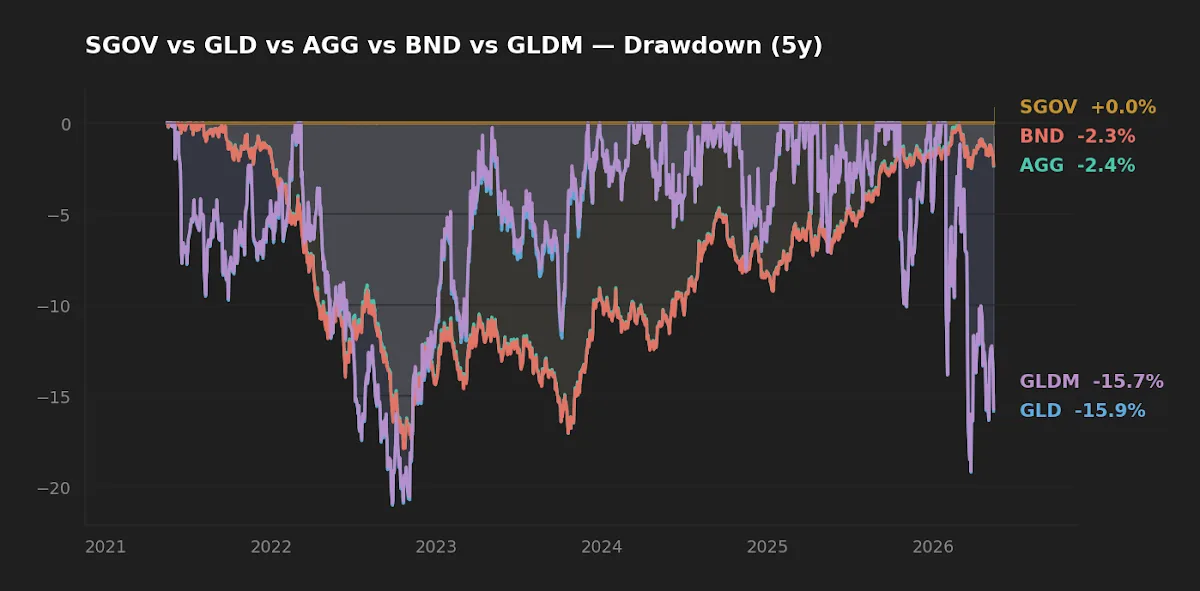
Gold's drawdown is larger in magnitude (-21.0% for GLD) but recovers via mean reversion in the spot price. Intermediate-bond drawdowns of -17.8% recover through coupon accrual and pull-to-par — slower, and meaningfully painful for an investor who was relying on these instruments as the volatility-damping sleeve during the worst of 2022. SGOV's drawdown is essentially zero (-0.0% on this trailing window). That is the point of zero-duration exposure: it is not a hedge against anything, but it is a place where the price does not move.
Five years of data tells us bonds at 6 years of duration can draw down nearly as much as gold — what differs is the recovery path, not the size of the hole.
The Mulden piece on SGOV versus a gold ETF for defensive allocation takes the duration-versus-monetary-asset trade-off in more depth. For the trend-following alternative to gold, see GLD vs. DBMF: Gold vs. AI-Managed Managed Futures.
What the 2026 macro setup means for each role
The current macro picture, pulled from FRED: the 10-year Treasury yields 4.47% (DGS10, asof 2026-05-14), the Fed funds rate sits at 3.64% (DFF, asof 2026-04-01), headline CPI is running 3.9% year-over-year (CPIAUCSL, asof 2026-04-01), and VIX is 17.3 (VIXCLS, asof 2026-05-14). Three observations follow:
- Real yields are positive but not punitive. A 4.47% nominal 10Y against ~3.9% realized CPI implies a real yield in the rough vicinity of 0.5% on a backward-looking basis (using market-implied breakevens would give a slightly different number). Historically, gold has struggled when real yields are high and rising; it has performed best when real yields are negative or falling. The current setup is mid-regime — not obviously bullish, not obviously bearish for gold.
- Bond carry is meaningful again. A 3.9–4.0% trailing yield on AGG and BND is the best entry yield since before the 2010s. Forward-return math for investment-grade bonds is dominated by starting yield. If yields fall from here, you get capital gains on top; if they rise, you have meaningful carry to absorb price loss. The Mulden piece on interest rate cuts and their effect on stocks, bonds, and gold walks through the rate-channel mechanics.
- Volatility is quiet on the surface. A VIX in the 17 range is consistent with a calm equity tape. That tells you nothing about whether the calm holds — VIX is coincident, not leading. It does mean any defensive allocation made today is being made at low insurance prices, not high ones.
Implementation: which vehicle, not just which asset
"Hold gold" and "hold bonds" are abstractions. The vehicle changes the risk you actually take.
For gold, the cost gap between GLD (0.40%) and GLDM (0.10%) is 30 basis points annually. For a 5% allocation in a $200,000 portfolio, that is $30 per year — small in absolute terms, but compounded over a 30-year horizon, around $1,500 of lost compounding on a sleeve doing the same job. GLD's advantage is the deepest options market in the gold complex, which matters for short-term hedgers and zero for long-horizon holders. For a buy-and-hold investor, GLDM is the obvious default; the 5Y CAGR delta of roughly 30 bp between GLD (19.4%) and GLDM (19.7%) is the expense-ratio gap showing up in the data.
For bonds, the duration choice is the more consequential decision. AGG and BND at effective duration near 6 years are how you take the recession-and-rate-cuts hedge. SGOV at effective duration near zero is how you park cash with positive real yield and almost no rate sensitivity. They are not interchangeable. Investors who held SGOV-equivalents through 2022 were essentially unaffected; investors who held AGG or BND for the wrong reason took the full -18% drawdown.
At-a-glance scoreboard
| If you need… | Better-fit asset | Why |
|---|---|---|
| Hedge against recession + falling yields | AGG / BND | Duration ~6yr benefits from rate cuts; starting yield ~4% |
| Hedge against currency / sovereign-credibility tail | GLD / GLDM | Non-sovereign monetary asset |
| Hedge against inflation-driven yield shock | Gold (bonds lose) | 2022 precedent — both AGG and BND took ~-18% drawdowns |
| Park cash with positive real yield, no rate risk | SGOV | 5Y vol 0.2%, 5Y max DD -0.0% |
| Lowest implementation cost per unit of role | Bonds (AGG/BND at 0.03%) | Gold ETFs cost 0.10–0.40%; cash equivalents 0.09% |
Frequently asked questions
Q1. With the 10Y at 4.47%, is now a good entry for AGG or BND?
"Good entry" depends on holding period. Forward returns for investment-grade bonds are dominated by starting yield. A 4.4% nominal entry is materially better than the sub-2% entries of 2020–2021. Whether yields rise from here is unpredictable; what is predictable is that the starting carry is meaningful for the first time in over a decade.
Q2. Why did AGG and BND draw down nearly -18% over five years if bonds are supposed to be safe?
Because "bonds" is not a single risk. AGG and BND carry roughly 6 years of effective duration. When the policy rate moved from near zero to over 5% inside 18 months, every duration-bearing instrument re-priced. That is not a malfunction; it is duration risk showing up as expected. SGOV, which carries essentially zero duration, drew down ~0% over the same window.
Q3. Why hold both gold and bonds rather than picking one?
Because they hedge different risks. Bonds protect against recession and falling yields; gold protects against currency-credibility and real-rate shocks. 2022 was the case where bonds failed and gold held — the cleanest argument for not treating them as redundant safe-haven slots.
Q4. What's a defensible gold allocation size?
The academic literature broadly supports a 5–10% range as the size at which gold has historically reduced portfolio drawdowns without materially reducing return. Below that, the diversification effect is small; above that, the no-yield drag becomes more visible. Mulden offers no specific recommendation for any individual reader.
Q5. Aren't TIPS a better inflation hedge than gold?
For known, US-CPI-measured inflation, TIPS are arguably more direct — they index to CPI by construction. Gold hedges a broader and harder-to-define category: currency credibility, geopolitical stress, monetary debasement, which may or may not show up in measured CPI. The two are complementary, not substitutes.
What this comparison can and can't tell you
The trailing 5-year window is a single regime. It includes one major inflation shock and a historic rate-hiking cycle — events that flatter gold and punish duration. The next five years could just as easily run the opposite way, with falling yields restoring the negative stock-bond correlation and real rates compressing gold's tailwind. SGOV and GLDM also have shorter live track records than the older funds, so any forward inference based on their 5Y numbers carries higher uncertainty. Treat the table as a starting point for thinking about role, not a forecast of which sleeve will win.
Scenarios where each role fits
- 30+ year horizon, equity-heavy, tax-advantaged account: a small gold sleeve (3–5%, GLDM as the cost-efficient vehicle) for monetary-tail insurance is defensible. Intermediate bonds add less because the equity sleeve is doing the compounding work.
- 10–20 year horizon, balanced: bonds become the larger of the two roles. AGG or BND at 4% starting yield is doing real work for the first time in over a decade. Gold optional, sized small.
- Within 5 years of drawing income: the question is duration matching, not gold. SGOV and laddered intermediate Treasuries dominate. Gold's role here is small and mostly psychological.
- Specifically worried about a fiat-credibility tail: gold is the cleaner expression of that view than bonds, since long-duration bonds lose in that scenario.
Key takeaways
- Gold and intermediate bonds are not redundant safe-haven slots. They hedge different risks, and the trailing 5Y data (AGG and BND both ~-18% peak drawdown) reminds us they can fall in the same window.
- The 4% starting yield on AGG and BND is the most attractive bond entry in over a decade. Forward bond returns are dominated by starting yield, not trailing return.
- Gold's 19% trailing 5Y CAGR is regime-flattered. Treat it as evidence the role works, not as a forward expected return.
- For the same gold exposure, GLDM at 0.10% beats GLD at 0.40% for buy-and-hold use. The 30 bp gap compounds.
- SGOV is not a hedge — it is zero-duration cash with positive real yield. Use it for cash, not for portfolio protection.
Editor's read
The editor's working frame for 2026: bonds are interesting again on starting yield alone, for the first time in over a decade — a regime change that deserves attention before any allocation decision. Gold remains a small, persistent insurance line, sized for the scenario it actually hedges (monetary-system tail) rather than the broader "uncertainty" framing media tends to use. The mistake to avoid is treating gold and bonds as redundant safe-haven slots competing for the same allocation. They are not.
Editor's holdings disclosure: the editor maintains broad-market diversified exposure including small allocations to gold and short-duration Treasuries. Specific tickers and weights are not disclosed. For context on how the in-house weekly portfolio review framework approaches sleeve sizing, see the May 2026 portfolio snapshot.
Methodology
ETF data (expense ratio, AUM, dividend yield, 5Y CAGR, 10Y CAGR, 5Y annualized volatility, 5Y maximum drawdown, inception date) sourced from yfinance, fetched 2026-05-16. CAGR computed on total-return series; volatility from daily log returns annualized at √252; max drawdown from cumulative total-return peak. Expense ratios cross-checked against issuer fact sheets linked inline. Macro figures pulled from FRED: 10-year Treasury constant maturity (DGS10, asof 2026-05-14), Federal funds effective rate (DFF, asof 2026-04-01), CPI year-over-year (CPIAUCSL, asof 2026-04-01), VIX (VIXCLS, asof 2026-05-14). Historical references to 2022 calendar-year performance for the S&P 500 and Bloomberg US Aggregate Bond Index are widely reported and not the subject of original computation here.
This article is for educational purposes and does not constitute personalized financial advice. See Disclaimer.