
The short version
- GLD compounded at roughly 20.0% per year over the past five years; DBMF at 8.5%. Reading that gap as "gold won" misunderstands what DBMF is built to do.
- DBMF runs at meaningfully lower realized volatility (12.6% vs 17.9%), but its 5Y max drawdown is essentially identical to GLD's — the drawdowns simply happened in different regimes.
- For most long-horizon investors, GLD is the cleaner, cheaper diversifier. DBMF earns its place only as a small satellite alongside an equity-heavy core.
On the surface this is a lopsided comparison. SPDR Gold Shares (GLD) has compounded at 20.0% per year over the past five years; the iMGP DBi Managed Futures Strategy ETF (DBMF) has managed 8.5%. The gap is real — but reading it as evidence that gold beats managed futures misunderstands what each fund is built to do, and overweights a single regime in which gold experienced one of the largest secular moves in its modern history.
The honest question for a long-horizon investor isn't which one printed the better number from 2021 to 2026. It is whether either fund earns a small allocation in a portfolio whose primary engine is broad equities, and if so, on what theory.
What each fund actually holds
GLD is the simplest possible exposure to physical gold. The fund holds gold bars in an HSBC London vault and tracks the spot price minus a 0.40% expense ratio. It has no yield, no active decision logic, and no leverage. Its one job is to give an investor gold price exposure with the operational hassle of a brokerage trade rather than a safe deposit box.
DBMF is structurally far stranger. It does not pick its own trends. Instead, it runs a rolling regression of a peer group of large managed-futures hedge funds against a small set of liquid futures factors — equity index futures, US Treasuries at long and short maturities, the dollar index, gold, and a handful of commodities — and reconstructs the implied positioning each month using the same futures contracts. The fund's collateral sits in T-bills, which is why DBMF distributes a 5.3% yield even though it is not a fixed-income product. The yield is mechanical, not strategic; it tracks whatever short rates happen to be at the time.
So GLD is a one-line bet on gold. DBMF is a synthetic, leveraged, regression-replicated basket of dozens of futures positions, rebalanced monthly. They are answering different questions.
The data, side by side
| Metric | GLD | DBMF |
|---|---|---|
| Name | SPDR Gold Shares | iMGP DBi Managed Futures Strategy |
| Expense ratio | 0.40% | 0.85% |
| AUM | $155.1B | $3.3B |
| Distribution yield | 0.0% | 5.3% |
| Inception | 2004-11-18 | 2019-05-07 |
| 5Y CAGR | 20.0% | 8.5% |
| 10Y CAGR | 13.3% | n/a (under 10Y track) |
| 5Y annualized volatility | 17.9% | 12.6% |
| 5Y max drawdown | -21.0% | -20.4% |
Sources: price and total-return statistics computed from yfinance daily series, fetched 2026-05-05; expense ratios, AUM, distribution yield, and inception verified against the SPDR Gold Shares fact sheet and the iMGP DBi Managed Futures Strategy ETF fact sheet.
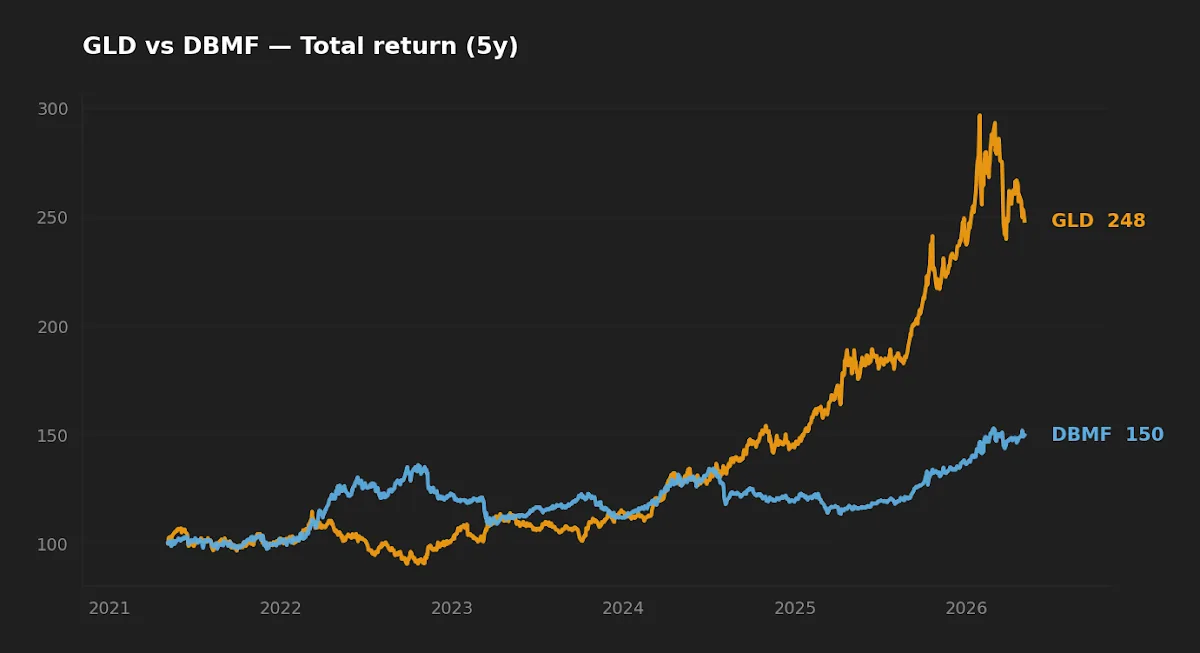
The five-year return gap is mostly a gold story
From May 2021 through May 2026, gold roughly doubled. That move was driven by a specific macro stack — sticky inflation early in the window (CPI peaked above 9% before settling near the current 3.3% year-on-year reading from FRED, asof 2026-03-01), a multi-year central bank gold accumulation cycle, geopolitical risk premia, and a Fed cutting cycle that began as the long end of the curve sat at 4.39% (FRED, asof 2026-05-01). Read in isolation, GLD's 20.0% five-year CAGR looks like a stable property of gold. It isn't. The fund's longer-run 13.3% ten-year CAGR is closer to what a long-horizon investor should plan around, and even that is regime-dependent. For a fuller treatment of gold across cycles, see the precious-metals ETF guide.
DBMF, meanwhile, made its reputation in 2022, when its replication caught the short-bond and long-dollar trends that defined that year. The 2023-2024 whipsaw period — when the Fed kept rates higher for longer than the curve had initially priced — was less kind. DBMF's job is to capture trends when they exist, and to lose modestly when markets chop. Five years is a short window for a strategy whose entire investment thesis is regime-dependent.
Realized risk: lower vol, identical drawdown
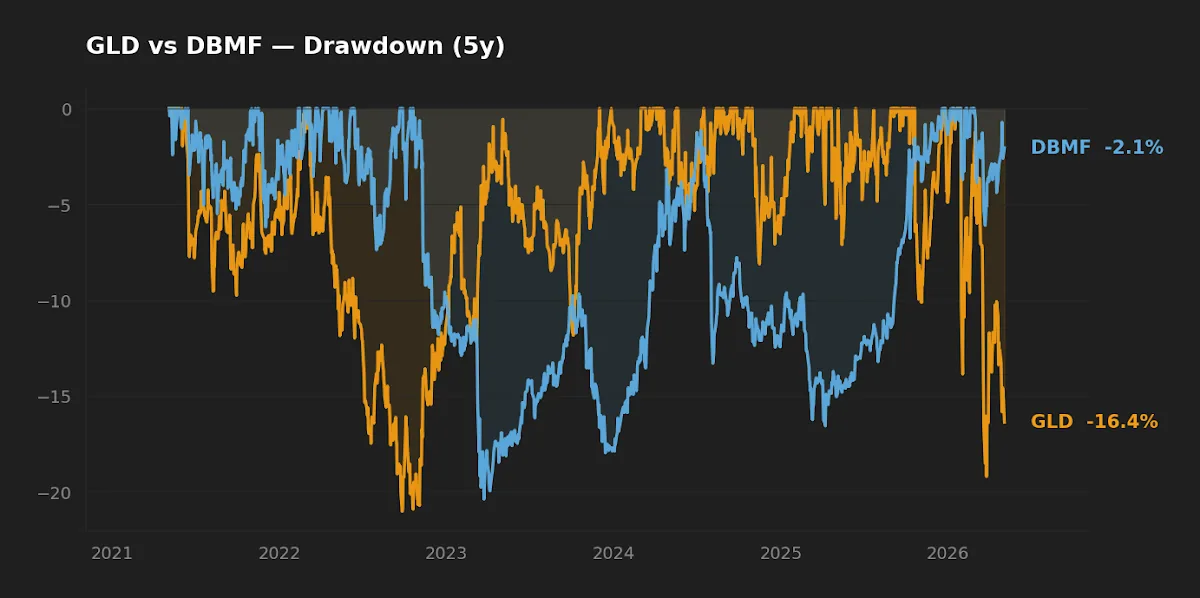
The drawdown chart is the most useful single image in this comparison. DBMF runs at roughly 70% of GLD's volatility — 12.6% versus 17.9% — which would normally imply a meaningfully shallower max drawdown. It does not. Over the same five-year window, DBMF's worst peak-to-trough is -20.4% against GLD's -21.0%. The two numbers are nearly identical.
The non-obvious lesson: realized volatility and tail loss are not the same statistic. DBMF's drawdown is concentrated in trend-reversal episodes — 2023's rate-cut head-fakes, the dollar's mean reversion in 2024 — where its replicated positioning was on the wrong side of a sharp change. GLD's drawdown sat in the 2022 dollar-strength window, when real rates were rising and gold had not yet decoupled from the Treasury curve.
Trend-following ETFs are not bought for the return they print in calm regimes. They are bought for the return they generate when stocks are down 20% — and that test has not yet arrived for DBMF.
The drawdowns also happened at different times. That is the real diversification value, and it does not show up in either CAGR or volatility numbers. The relevant statistic is the rolling correlation between each fund and a 60/40 portfolio during equity stress windows. The five-year window we have is too short and too benign to settle that question for DBMF, which has roughly six years of live track record and has not yet been through a 2008-style equity bear market.
Correlation, not absolute return, is the case for DBMF
The strategic argument for managed futures, going back to the academic literature on the SocGen Trend Index, is not that the strategy reliably beats stocks. It is that the strategy delivers positive returns in roughly two-thirds of the worst quarters for equities — what the industry calls "crisis alpha." The premise is that large drawdowns in equities are usually accompanied by sustained directional moves in bonds, currencies, or commodities, and that a strategy long the up-trends and short the down-trends will tend to be on the right side of those moves.
That premise is not falsified by DBMF's middling absolute return — it is, in fact, what the design promises. The legitimate criticism is that DBMF is a replicator, not a primary trend-follower, so it inherits the basket's behavior with a lag and a tracking error. Whether the post-fee version of that exposure is worth 0.85% per year is a question the next equity bear market will answer more honestly than the past five years can. Initially I was skeptical of the AUM-versus-fee math; running the regression behavior against the SocGen index changes how much that fee feels like a tax versus a cost of doing business.
Implementation friction: tax, capacity, and fee
For taxable US investors, GLD is structured as a grantor trust holding a collectible. Long-term gains are taxed at the 28% collectibles rate, not the 15-20% long-term capital gains rate. That is a meaningful drag for a buy-and-hold investor, and it is the strongest argument for holding gold inside a tax-deferred account. DBMF distributes Section 1256 contracts gains, which receive blended 60% long-term / 40% short-term tax treatment regardless of holding period — generally more favorable than ordinary income, but worse than pure long-term capital gains. The 5.3% T-bill collateral yield, distributed annually, adds friction in a taxable account.
On capacity, the gap is significant. GLD's $155.1B AUM is far beyond any practical concern. DBMF's $3.3B is large enough to be liquid, but small enough that closure risk has to enter the calculation for a position intended to be held for decades. The 0.85% expense ratio is high in absolute terms — the gap to GLD's 0.40% compounds to roughly 4.5% of position value over ten years before any return assumption — but defensible if the strategy delivers the diversification it claims. For investors weighing similar trade-offs in defensive sleeves, SGOV versus a gold ETF is the related framing.
What this comparison can and can't tell you
The five-year window covers a single, unusual macro regime: post-COVID liquidity, a once-in-a-generation gold rally, and one strongly trending year (2022) for managed futures. It does not cover an equity-only bear market, a deflationary shock, or a sustained low-volatility regime. The 5Y CAGR comparison is therefore directionally informative but not predictive. DBMF has six years of live data and a longer simulated history; treat any verdict on its long-run behavior as provisional. GLD has 20+ years live, but the 13.3% ten-year CAGR is itself biased upward by the recent rally.
At-a-glance scoreboard
| Category | Winner | Margin |
|---|---|---|
| Expense ratio | GLD | 45 bp |
| Realized 5Y CAGR | GLD | ~11.5 pp/yr (regime-dependent) |
| Realized 5Y volatility | DBMF | ~5 pp lower |
| 5Y max drawdown | Functional tie | ~60 bp |
| Track-record length | GLD | 20+ years vs ~6 years |
| Equity-stress diversification (theory) | DBMF | By design; live test pending |
| Capacity / closure risk | GLD | Material |
Where each fund actually fits
- Long-horizon investor seeking a single inflation/currency hedge in a tax-deferred account. GLD is the cleaner, cheaper choice. The 0.40% expense ratio, 20+ year track record, and operational simplicity outweigh the lack of yield.
- Equity-heavy investor (80%+ stocks) wanting explicit crisis-alpha exposure. A 3-5% DBMF satellite is defensible alongside a separate gold position. The diversifier you don't want is one that correlates with stocks during stress.
- Investor in a rate-sensitive 60/40 portfolio. A small DBMF allocation can substitute for a portion of long-duration bond exposure in a regime where stocks and bonds correlate more than historically.
- Taxable-only account with no gold or futures exposure today. Neither fund is ideal here. The tax friction on both makes a tax-deferred wrapper a near-prerequisite for a long-term position.
- Investor seeking absolute return as the primary goal. Neither. Both are diversifiers, not return engines, and treating them as such will produce disappointment in calm regimes.
Editor's read
If forced to pick one as the single diversifier alongside a broad equity core, the editor leans toward GLD: the longer track record across more regimes, the lower fee, and the operational simplicity make it the easier position to hold for decades without second-guessing. DBMF is interesting as a small (3-5%) satellite for an investor whose equity exposure is large enough that the next 20%+ drawdown will hurt — and who wants a position with a different drawdown timing, not just a different drawdown shape. The 5Y return gap is not a reason to dismiss DBMF; the unfinished live track record is the legitimate caveat.
The editor does not currently hold either fund.
FAQ
Is DBMF really an "AI" fund?
Not in the modern AI sense. DBMF uses a rolling regression — a standard quantitative technique that predates the current AI vocabulary by decades — to infer the positioning of a peer group of managed futures hedge funds, then replicates that positioning with liquid futures. It is a quantitative replicator, not a machine-learning forecaster. Treating it as a black-box AI bet would mischaracterize the strategy. For a separate look at funds that genuinely use ML in their stock-selection process, see the AIEQ and AMOM deep dive.
Why does GLD have no yield while DBMF distributes 5.3%?
Gold itself produces no cash flow, so GLD has nothing to distribute. DBMF holds T-bills as collateral for its futures positions, and the interest on those T-bills flows through to shareholders. With the Fed funds rate at 3.64% and the 10-year Treasury at 4.39% (FRED, asof 2026-05-01), that yield is meaningful but mechanical. If short rates fall, the distribution falls too — it is not a feature of the trend-following strategy itself.
Has DBMF actually delivered "crisis alpha" yet?
Partially. DBMF's standout year was 2022, when bonds and equities sold off together and the fund's replicated short-bond and long-dollar positioning paid off. That episode is consistent with the academic story for managed futures. The fund has not yet been tested in a 2008-style equity-only bear market, in which crisis alpha would need to come primarily from short-equity or long-bond positioning. Six years of live data is not enough to settle the question.
Are gold and managed futures redundant in a portfolio?
They overlap less than they appear to. Gold is a static, scarcity-driven store of value whose returns concentrate in regimes of inflation, currency debasement, or rising real risk premia. Managed futures aim to profit from sustained directional moves in any direction — bonds, currencies, equities, commodities. Their drawdowns also tend to occur at different times, which is the meaningful diversification statistic. A small allocation to each, alongside core equity exposure, is defensible; doubling down on either as the sole diversifier is harder to justify.
What about taxes in a taxable account?
Both funds are tax-inefficient relative to a broad equity index ETF. GLD is taxed at the 28% collectibles rate on long-term gains. DBMF distributes Section 1256 gains (60/40 long/short blended), plus an ordinary-income-like T-bill yield. For most investors, holding either or both inside a tax-deferred account (IRA, 401(k)) materially improves after-tax outcomes. This is one of the few decisions in this comparison where account location matters at least as much as fund selection.
Key takeaways
- The 11.5 percentage-point 5Y CAGR gap is mostly a gold-regime story, not evidence that managed futures are broken.
- Lower realized volatility (12.6% vs 17.9%) did not produce a shallower max drawdown — both funds drew down roughly 21% in the past five years, in different regimes and for different reasons.
- The strategic case for DBMF is correlation behavior in equity-stress windows, which the past five years did not stress-test.
- Both funds are tax-inefficient outside qualified accounts; account location matters as much as fund selection.
- For the typical long-horizon investor, GLD is the simpler core diversifier; DBMF is a satellite, not a substitute.
Methodology
Price and total-return statistics (5Y CAGR, 10Y CAGR, annualized volatility, max drawdown) computed from yfinance daily series, pulled 2026-05-05. The five-year window covers approximately May 2021 through May 2026. Expense ratios, AUM, distribution yield, and inception dates verified against the SPDR Gold Shares fact sheet (spdrgoldshares.com) and the iMGP DBi Managed Futures Strategy ETF fact sheet (imgpfunds.com/dbmf). Macro reference rates (10Y Treasury 4.39%, Fed funds 3.64%, CPI YoY 3.32%) sourced from FRED, asof 2026-05-01.
This article is for educational purposes and does not constitute personalized financial advice. See Disclaimer.