
The short version
- VNQ is the cheap, deep, market-cap-weighted way to own U.S. listed real estate; PPTY is a fundamentals-tilted alternative that markets itself as smarter selection — but in the live 5Y window it has slightly underperformed VNQ on total return.
- The largest practical issue with PPTY is not its methodology — it is the $22.6M AUM, which puts capacity, spread, and closure risk on the table before any factor argument starts.
- For a long-horizon REIT sleeve, the case for VNQ is straightforward; the case for PPTY requires believing in a process that has not yet shown alpha against the simple index.
The empirical hook
On paper, PPTY's pitch should beat VNQ. The Vident U.S. Diversified Real Estate ETF tilts toward REITs with stronger property-level fundamentals — occupancy, geographic diversification, balance-sheet quality — and away from market-cap concentration in struggling office and mall names. That is a coherent story, especially in a post-pandemic environment where commercial real estate has visibly bifurcated.
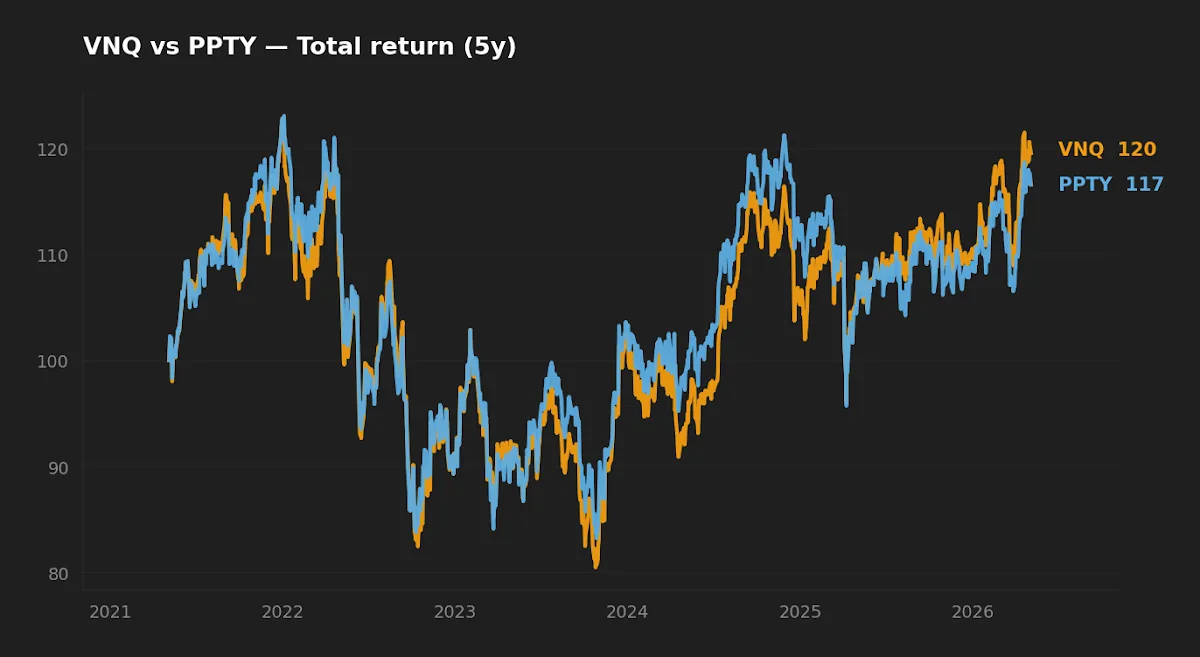
The live data does not yet tell that story. Over the trailing five years, VNQ has compounded at 3.4% against PPTY's 2.8%, with similar realized volatility (18.8% vs 18.6%) and a deeper but comparable maximum drawdown for VNQ (-34.5% vs -32.4%). The fundamentals tilt cushioned the drawdown by about two percentage points and cost roughly 55 bp per year in compounded return, before fees. That is the trade actually on the table — not the marketing version.
What each fund actually owns and why
VNQ tracks the MSCI US Investable Market Real Estate 25/50 Index — broad, capitalization-weighted exposure to U.S. listed real estate. You own roughly the U.S. REIT market in proportion to how much of it the market thinks each name is worth. That includes the dominant data-center, telecom-tower, industrial, and residential REITs at the top, and forces inclusion of large office and retail names that the market may be struggling to reprice.
PPTY follows the Vident U.S. Diversified Real Estate Index, which screens and weights REITs on rules-based fundamentals — geographic diversification at the property level, balance-sheet quality, and underlying real-estate income characteristics. It is sometimes described as "AI-driven" in third-party copy, but the methodology is a deterministic factor screen, not a machine-learning model. That distinction matters: the fund's edge, if any, comes from which factors are encoded and how they are weighted, not from a model that adapts. A reader who has skimmed our VOO vs. AMOM analysis or QQQM vs. QRFT piece will recognize the pattern: when "AI" appears in marketing copy, the right move is to look at factor loadings and live track record, not the deck.
Headline numbers
| Metric | VNQ | PPTY |
|---|---|---|
| Issuer | Vanguard | Vident |
| Inception | 2004-09-23 | 2018-03-26 |
| Expense ratio | 0.13% | 0.53% |
| AUM | $64.7B | $22.6M |
| NAV (2026-05-05) | $96.07 | $32.41 |
| 30-day SEC yield (approx.) | 3.9% | 3.0% |
| 5Y CAGR | 3.4% | 2.8% |
| 10Y CAGR | 5.5% | n/a (post-2018) |
| 5Y annualized vol | 18.8% | 18.6% |
| 5Y max drawdown | -34.5% | -32.4% |
| Construction | Cap-weighted broad index | Rules-based fundamentals tilt |
Sources: yfinance pull 2026-05-05; Vanguard fund profile (VNQ) and Vident issuer materials for PPTY methodology. Yields are trailing approximations and will differ from each issuer's stated 30-day SEC yield depending on the calculation date.
Cost is the part that compounds with certainty
The 40 bp annual fee gap is the only difference here that we can quantify with no estimation. Everything else — factor exposure, manager judgment, regime — is uncertain. The fee is not. On a $50,000 REIT sleeve held for 25 years at an 8% gross return, the difference between paying 0.13% and 0.53% is roughly $30,000 of terminal wealth, paid in exchange for a methodology that has not yet outperformed the cheap alternative in the only live track record we can measure. That is the asymmetry to keep in front of mind.
For PPTY's higher fee to be worth it, the methodology has to add at least 40 bp per year of return — net of any drawdown cushion — over a long horizon. The 5Y window we have shows roughly a 55 bp per year shortfall on CAGR and a ~2 percentage point drawdown improvement. Whether you would trade the cushion for the cost depends on how you weigh path versus terminal value.
For PPTY's higher fee to be justified, the fundamentals tilt has to add at least 40 bp per year — net of any drawdown cushion — over a long horizon. The 5Y window we have shows the opposite.
Realized risk: similar vol, slightly shallower drawdown
The 5Y volatility numbers are essentially indistinguishable (18.8% vs 18.6%). Where PPTY shows up is in the depth of the worst drawdown — about two percentage points shallower than VNQ in the 2022 rate-shock cycle. That is consistent with the fund's stated tilt away from concentrated office exposure, which absorbed the most pain when long-duration cash-flow assets were repriced.
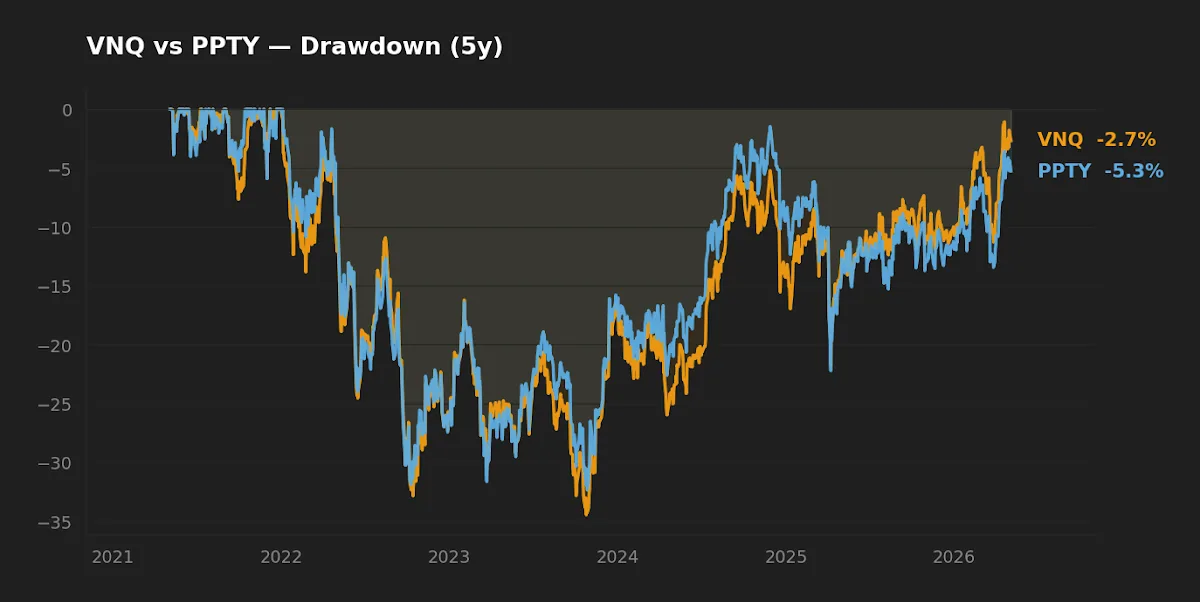
Two cautions on reading this. First, a 2 pp drawdown improvement is modest relative to the absolute size of the drawdown — both funds lost roughly a third of their value at the trough. Neither is a meaningful diversifier inside an equity-heavy portfolio in stress. Real estate fell with equities in 2022, not against them. Second, the 5Y sample covers essentially one full cycle (COVID-era low rates → 2022 rate shock → partial recovery). That is not enough to claim the cushion is structural.
The capacity problem PPTY cannot dismiss
PPTY's AUM is $22.6 million. This is the number that, in the editor's read, makes the methodology debate secondary. Funds at that size carry real implementation friction:
- Bid-ask spread. PPTY trades thinly relative to VNQ. For a buy-and-hold investor, this is one-time cost on entry and exit, but it is not zero, and it widens during stress — exactly when an investor might want to rebalance.
- Closure risk. Issuers routinely close ETFs that fail to scale. If PPTY closes, holders receive cash at NAV — fine in a tax-deferred account, a forced taxable event in a brokerage account. For a position meant to be held for decades, this risk is non-trivial.
- Tracking quality. A small fund implementing a rules-based fundamentals screen has to make trade-offs in rebalancing that a larger fund does not. The actual portfolio may diverge from the indexed methodology more than the prospectus implies.
VNQ does not have these problems at $64.7B. Whatever its limitations as a pure cap-weighted vehicle, it is not going to close, and the spread is institutional-tight.
REITs against today's rate stack
The macro frame matters more than usual right now. As of the most recent FRED prints (2026-05), the 10Y Treasury sits at 4.39%, the federal funds rate at 3.64%, and CPI year-over-year at 3.3% (FRED, 2026-05). VNQ's trailing yield of ~3.9% is, for the first time in over a decade, below the risk-free rate. That is a regime change worth naming. In the 2010s, REITs were the classic "yield grab" trade against a sub-2% 10Y; the math today is different. A long-horizon REIT investor is buying for total return — rent growth and asset-value appreciation — not a yield premium over Treasuries that no longer exists.
This applies to both funds equally and is not a reason to prefer one over the other. It is a reason to size the entire REIT sleeve realistically. A 5–10% allocation as a real-asset diversifier is defensible; expecting REITs to behave as a bond substitute, as they did in the post-2008 era, is not.
At-a-glance scoreboard
| Category | Winner | Margin |
|---|---|---|
| Cost | VNQ | Material — 40 bp |
| Realized return (5Y) | VNQ | Modest — ~55 bp/yr |
| Realized risk (vol, 5Y) | Tie | Indistinguishable |
| Drawdown depth (5Y) | PPTY | Modest — ~2 pp shallower |
| Capacity / closure risk | VNQ | Decisive — $64.7B vs $22.6M |
| Track record length | VNQ | Decisive — 22Y vs 7Y |
| Suitability for a core REIT sleeve | VNQ | Strong |
What this comparison can and cannot tell you
The 5Y window is essentially one regime — pandemic shock, rate-cycle compression, partial recovery. It cannot tell us how PPTY's fundamentals tilt would behave through a multi-year credit-driven downturn (2008-style) or a sustained inflationary regime favoring real assets. PPTY's live track record begins in 2018; we have no 2008, no 2000-2002, no early-1990s S&L cycle to read from. The methodology may carry an edge that simply has not had its moment in the sample we have. It also may not.
What we can say is that the cost is paid every year, in cash, regardless of regime, and that capacity risk is not a function of methodology — it is a function of size. Both observations are robust to whatever happens next.
Scenarios where each fits
- Long-term core REIT exposure in a tax-advantaged account. VNQ is the straightforward answer. The fee, capacity, and track-record case is decisive.
- Investor who already owns broad VNQ-like exposure and wants a small fundamentals tilt as a satellite. A 10–20% PPTY tilt within the REIT sleeve is defensible if the investor is comfortable with the AUM risk and views the fundamentals factor as a long-horizon bet, not a 5Y verdict.
- Taxable-account investor concerned about forced ETF closure. Avoid PPTY. The taxable event from a closure can erase years of methodology benefit even if the methodology works.
- Investor wanting to avoid office REITs specifically. Neither fund is a clean tool for this — VNQ owns them by index rule, PPTY underweights but does not exclude. A targeted property-type ETF (residential, industrial, data-center — see our data-center REIT analysis) is a more direct expression.
Editor's read
If forced to pick one for a long-term real-estate sleeve, the editor leans toward VNQ. The methodology argument for PPTY is plausible, but it has not earned its 40 bp fee in the only live track record we can measure, and the $22.6M AUM puts capacity and closure risk on the table before any factor debate. PPTY is interesting as a small satellite tilt for an investor who already owns a broad REIT core, accepts the AUM risk, and treats the fundamentals tilt as a multi-decade bet rather than a five-year claim. Framing it as an "AI-powered" alternative to indexing is a marketing layer to discount, not a thesis to underwrite.
FAQ
Is PPTY actually AI-driven?
Not in the machine-learning sense. The methodology is a rules-based factor screen using property-level fundamentals (geographic diversification, balance-sheet quality, real-estate income characteristics). The "AI" framing is marketing copy more than a description of the index construction.
Why is PPTY's AUM so low after seven years live?
A combination of a competitive REIT-ETF landscape (VNQ, SCHH, IYR, USRT, REET all dominate distribution) and the fact that the fundamentals-tilt argument has not produced visible outperformance to attract flows. ETFs that fail to differentiate on either cost or live performance struggle to scale.
Does the lower drawdown make PPTY a better diversifier?
Modestly. A 2 pp shallower drawdown on a -34% vs -32% range is real but not transformative. Neither fund decoupled from equities meaningfully in 2022 — both fell in the same direction at roughly the same magnitude as the broad market. REITs are not a stress hedge; they are a real-asset diversifier in normal times.
How does the current 4.39% 10Y Treasury yield change the REIT case?
It removes the yield-grab thesis that drove much of the 2010s REIT bid. Both VNQ and PPTY now yield less than risk-free Treasuries. A long-horizon REIT investor today is underwriting rent growth and asset-value appreciation, not a yield premium over bonds. This applies to the asset class, not the choice between funds.
Should a long-term investor reduce REIT allocation given the rate environment?
That is a portfolio-construction question, not an ETF-selection question, and depends on the rest of the holdings. As a general frame, a 5–10% real-asset diversifier sleeve remains defensible across rate regimes; expecting it to behave like a bond proxy does not.
Key takeaways
- The 5Y data shows VNQ ahead of PPTY by ~55 bp/yr CAGR with comparable risk, against a 40 bp annual fee in PPTY's favor to overcome.
- PPTY's $22.6M AUM is the dominant practical issue; capacity, spread, and closure risk should be priced in before the factor argument.
- "AI-powered" describes the marketing, not the methodology — PPTY is a deterministic rules-based fundamentals screen.
- The REIT yield premium over Treasuries that defined the 2010s is gone in the current rate stack; both funds need rent growth and asset-value appreciation to deliver, not yield arbitrage.
- For a long-term core REIT sleeve, the case for VNQ is straightforward; for PPTY, it requires a multi-decade view that has not yet shown up in the live track record.
The editor does not hold either VNQ or PPTY at the time of writing.
Methodology
Price, total-return, AUM, NAV, and yield data pulled from yfinance on 2026-05-05; expense ratios and methodology descriptions cross-referenced against the Vanguard VNQ profile and Vident issuer materials for PPTY. CAGR, volatility, and maximum drawdown computed on adjusted-close daily returns over the trailing five years ending 2026-05-05; 10Y CAGR shown only where the inception date supports the window. Macro context (10Y Treasury, federal funds rate, VIX, CPI) sourced from FRED, latest available prints as of 2026-05.
Disclaimer: This article is for educational purposes and does not constitute personalized financial advice.