
The short version
- The "REITs for income, ETFs for growth" framing collapses on contact with five-year data: SRVR yields 2.6% but delivered just 0.3% annualized total return with a 41% drawdown, while PAVE and GRID returned 16-18% CAGR with smaller drawdowns and lower yields.
- At a 10Y Treasury near 4.47% (FRED, asof 2026-05-14), a 2.6% REIT dividend is a negative real spread to the risk-free rate — the rate-sensitivity that hurt data center REITs in 2022-2024 has not fully reversed.
- If the goal is sustainable distributions plus capacity to compound, XLU's 2.5% yield from regulated cash flows looks more defensible than SRVR's concentrated, rate-sensitive payout. EQIX is a single-name bet, not a diversified income vehicle.
The intuitive case is tidy: data center REITs are required to distribute 90% of taxable income, so they should be the "cash flow" answer. Infrastructure ETFs reinvest more, so they should be the "growth" answer. The actual five-year record tells a different and more uncomfortable story — one that any investor looking at these funds for income needs to confront before allocating capital.
What the comparison actually asks
The question is not "do data center REITs distribute more cash than industrial infrastructure ETFs." They do — the dividend yields make that obvious. The question is whether the higher headline yield translates into a higher total return at acceptable risk, or whether the cash flow is being financed by capital erosion. That distinction is the entire purpose of looking past the dividend line on a fact sheet.
The funds at the center of this comparison fall into two camps. SRVR (Pacer Data & Infrastructure Real Estate) is the closest thing to a pure data center REIT ETF available — it owns Equinix, Digital Realty, cell tower REITs, and adjacent landlords. EQIX is the largest single-name in that space; useful as a benchmark for the underlying business, not as a diversified allocation. PAVE (Global X U.S. Infrastructure Development) and GRID (First Trust NASDAQ Clean Edge Smart Grid) sit on the industrial-equity side: they own the engineering, electrical equipment, and grid companies that build the physical layer. XLU (Utilities Select Sector SPDR) is the legacy yield-and-regulated-rate-base vehicle that the AI power-demand narrative re-energized in 2024-2025.
The data, with sources
All trailing returns and risk figures are from yfinance as of 2026-05-17. Expense ratio, AUM, and inception are from issuer fact sheets (linked in the table). The 10-year CAGR is blank for funds with inception after 2016.
| Ticker | Expense ratio | AUM | Dividend yield | 5Y CAGR | 10Y CAGR | 5Y vol | 5Y max DD | Inception |
|---|---|---|---|---|---|---|---|---|
| PAVE | 0.47% | $13.4B | 0.8% | 16.4% | n/a | 21.6% | -26.2% | 2017-03-06 |
| XLU | 0.08% | $24.1B | 2.5% | 9.2% | 9.4% | 17.3% | -25.3% | 1998-12-16 |
| SRVR | 0.49% | $0.4B | 2.6% | 0.3% | n/a | 19.7% | -41.0% | 2018-05-15 |
| GRID | 0.56% | $10.0B | 0.8% | 18.5% | 19.6% | 20.9% | -29.6% | 2009-11-16 |
| EQIX | n/a (stock) | n/a | 1.8% | 10.2% | 14.2% | 27.7% | -41.8% | n/a |
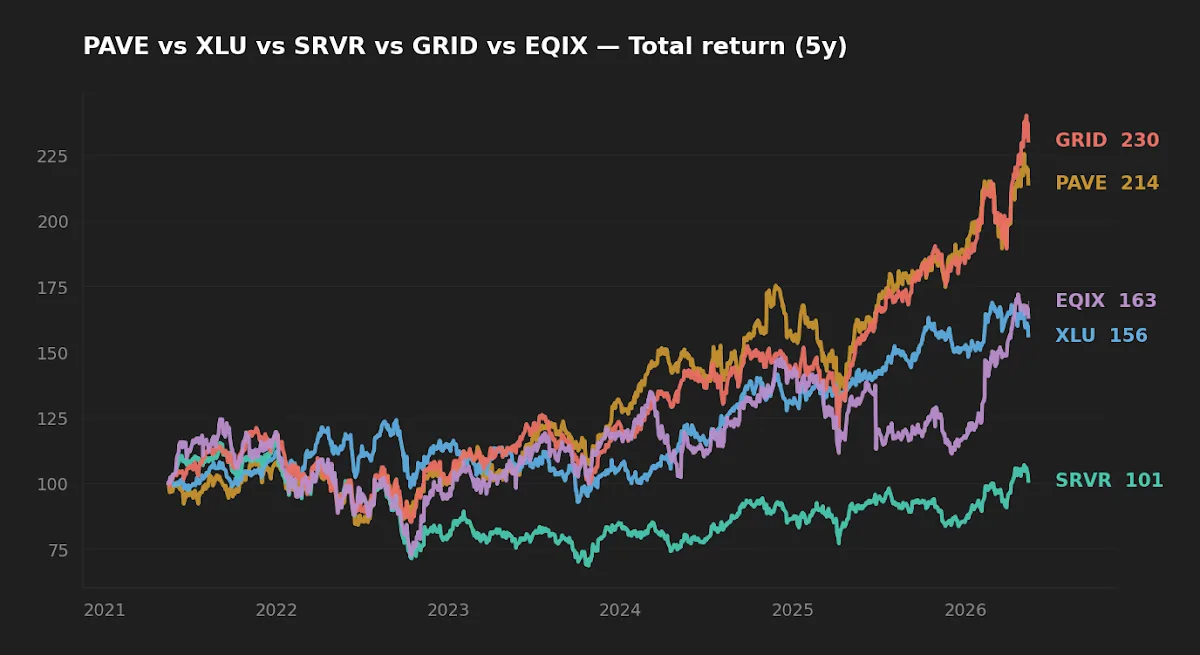
The yield illusion: when a "cash flow" thesis loses money
SRVR is the clearest case of what happens when an investor lets the dividend yield carry the entire argument. A 2.6% yield is real income, but stacking that against a 0.3% five-year CAGR means the price action has been a near-total drag on the total return. An investor who held SRVR for the dividend collected roughly 13 percentage points of yield over five years and gave back nearly all of it (and then some) in capital depreciation. The dividend was not financing a long-term position — it was diluting losses.
The mechanism is not a mystery. Data center REITs carry meaningful leverage to build and lease facilities; their valuations move inversely with long-term rates. The 10-year Treasury yield (FRED, asof 2026-05-14) sits at 4.47%, the fed funds rate at 3.64%, and CPI year-over-year at 3.9%. A REIT distributing 2.6% is offering a negative spread to the risk-free rate, before accounting for the equity risk of holding a leveraged real-estate vehicle. That gap has narrowed from 2024 peaks but has not closed, and the price action reflects it.
EQIX as a single name is more nuanced — the underlying business has compounded AFFO at a faster rate than SRVR's broader basket — but the 27.7% realized volatility and 41.8% drawdown show that owning one operator's equity is not income investing. It is a concentrated equity bet that happens to distribute cash.
A 2.6% dividend financed by a 0.3% five-year total return is not income. It is the appearance of income, paid for with capital.

The industrial side did the heavy lifting
PAVE and GRID are not income funds. Their yields of roughly 0.8% are low because the underlying companies — engineering & construction, electrical equipment, transmission specialists — reinvest at high rates of return. But across the same five years that punished SRVR, PAVE delivered 16.4% CAGR and GRID 18.5% CAGR, with maximum drawdowns of 26% and 30% respectively. The total-return gap to SRVR is roughly 16 percentage points per year. That is not a rounding error; it is a different asset class behaving differently.
GRID's 10-year CAGR of 19.6% deserves a footnote on factor exposure. It loads heavily on the smart-grid and clean-energy industrial sub-sector, which has benefited from a single regime — concentrated capex into grid modernization. That regime may continue (and the data-center power demand narrative argues it will), but the live track record reflects one cycle of policy and demand, not two or three. The realized return is what happened; it is not a forecast.
XLU is the most interesting middle ground. A 2.5% yield from regulated utilities (mostly qualified dividends, which matters for taxable-account investors) compounded to a 9.2% five-year CAGR and 9.4% over ten years. That is unflashy and durable. The yield is being paid out of rate-base earnings, not financed by share-price decline. For the income half of the comparison, XLU is the version that actually delivered both the cash flow and the principal — see also VPU vs XLU: Battle of the Lowest Fees for a closer look at how the two largest utilities ETFs compare on cost and tracking.
Realized risk: drawdown and capacity
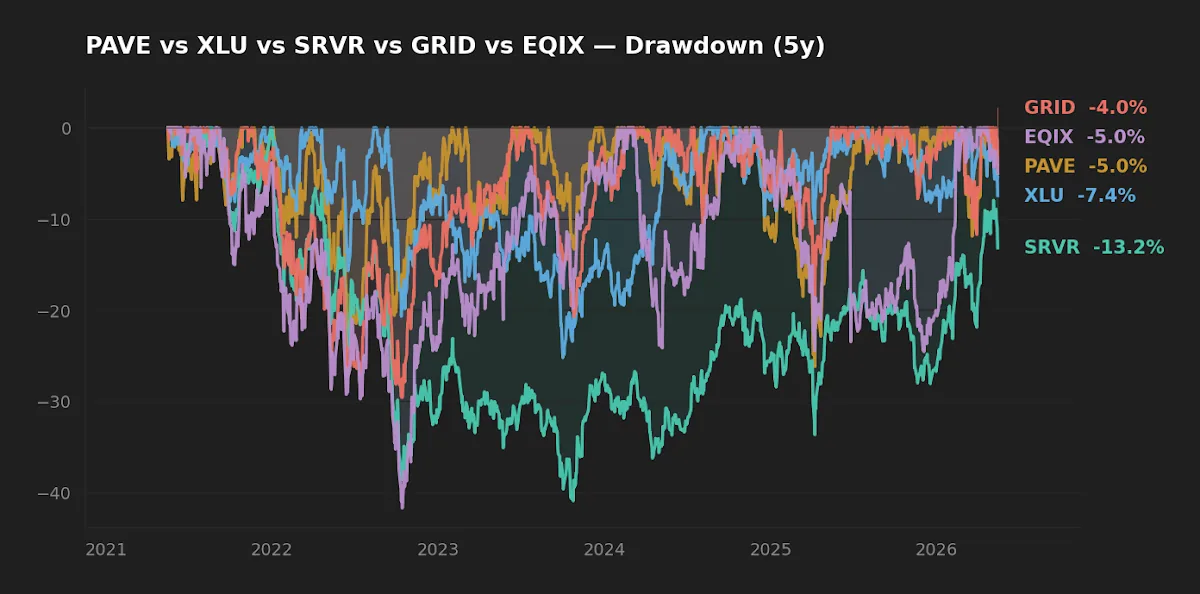
Drawdown is where the "REITs are defensive income" narrative breaks down hardest. SRVR's -41.0% five-year drawdown and EQIX's -41.8% are deeper than every infrastructure ETF in the comparison, including the aggressive industrial-equity exposures of PAVE (-26.2%) and GRID (-29.6%). The intuition that "real estate equals stability" fails in a rate-driven drawdown — and the 2022 episode showed exactly that.
SRVR has a second-order problem that does not appear in the headline numbers: scale. At $395 million AUM, it is roughly 1/60th the size of XLU and 1/30th the size of PAVE. Small-AUM ETFs carry wider bid-ask spreads, higher tracking error around index reconstitutions, and a non-trivial closure-risk tail. An investor building a long-term income sleeve around a sub-$500M fund is taking on operational risk that no return chart will show until the fund is closed or merged. For context on the broader infrastructure-ETF landscape, see Best Infrastructure ETFs for 2026.
Scoreboard
| Category | Winner | Note |
|---|---|---|
| Cost | XLU (0.08%) | Roughly 6x cheaper than the smaller funds; meaningful over decades. |
| Realized 5Y return | GRID (18.5%) / PAVE (16.4%) | Single-regime; should not be extrapolated. |
| Realized 5Y risk (drawdown) | XLU (-25.3%) | Lowest of the five despite paying the second-highest yield. |
| Income suitability | XLU | Qualified dividends, defensible yield, durable scale ($24B AUM). |
| Concentrated AI-real-estate bet | EQIX | Single-name; not an income product. |
FAQ
Q. Isn't a 2.6% yield from SRVR better than 0.8% from PAVE?
Only if total return is also positive. Over the past five years it has not been — the dividend has been more than offset by price decline. Yield is a component of total return, not a substitute for it.
Q. Why is XLU's drawdown smaller than SRVR's even though both are rate-sensitive?
Regulated utilities have lower leverage and more predictable rate-base earnings than data center REITs, which rely on lease repricing and new-build capex. When rates rose in 2022-2024, the REIT side took the larger hit. XLU also benefited from the late-cycle AI power-demand rerating.
Q. Is EQIX a better single-name choice than SRVR for data-center exposure?
On five-year total return, yes (10.2% vs 0.3%). On risk, no — its drawdown and volatility are higher. The trade-off is concentration: one company's operational outcomes, one balance sheet, one management team. That is a different decision than buying a basket.
Q. Should the macro backdrop change the conclusion?
Possibly. With the fed funds rate at 3.64% and the 10Y at 4.47% (FRED, asof 2026-05-14), rate-sensitive REITs are still pricing the higher-for-longer regime. A more aggressive cut cycle would help SRVR and EQIX more than XLU. That is a tactical bet, not a long-term thesis.
Q. How does data-center REIT exposure compare to a broad REIT index?
SRVR is narrower and more cyclical than VNQ. For a closer look at the broad REIT index versus an AI-screened approach, see VNQ vs PPTY.
What this comparison can and can't tell you
The five-year window covers one rate-hiking cycle, one growth-stock drawdown, and the AI capex acceleration. It does not cover a full credit cycle for REITs, nor a sustained low-rate regime that would favor SRVR's valuation. Ten-year data is only available for XLU, GRID, and EQIX — PAVE and SRVR have not lived through the prior cycle. The results are realized, but the sample is narrow. Treat any forward-looking inference as conditional.
The analysis also does not account for tax location. REIT distributions are largely ordinary income and inefficient in taxable accounts; XLU's qualified dividends are taxed at long-term capital gains rates. For a U.S. taxable-account investor, the after-tax gap between XLU and SRVR is wider than the pre-tax gap shown above.
Scenarios where each fits
Reader in 50s, taxable brokerage, drawing income within 5-10 years: XLU is the cleaner choice. Qualified dividends, durable scale, regulated cash flows.
Reader in 30s, tax-advantaged account (IRA/401k), 20+ year horizon, comfortable with industrial-equity volatility: PAVE or GRID for the growth sleeve; SRVR is hard to defend versus the broader infrastructure basket given the realized return.
Reader with high conviction in data-center physical capacity as a multi-decade theme: EQIX as a single-name satellite position, sized small. SRVR's scale and tracking issues make it a weaker vehicle for the same view.
Reader looking for non-correlated yield to a broad index portfolio: Neither REIT nor infrastructure ETF gives that — both are equity. A short-duration Treasury or quality bond sleeve does.
Editor's read
The headline framing of this comparison — REITs for cash flow, ETFs for growth — does not survive the five-year data. SRVR has delivered the cash flow but eroded principal; XLU has quietly done both jobs at lower cost and lower drawdown. If forced to pick one income vehicle from this group, the editor leans toward XLU: a 2.5% qualified-dividend yield from regulated utilities at 0.08% expense, with durable AUM, is a sturdier foundation than a sub-$500M REIT ETF whose dividend has been financed by capital loss. PAVE or GRID belong in a separate conversation about industrial-equity exposure, not a cash-flow sleeve.
Holdings disclosure: the editor does not hold PAVE, SRVR, GRID, or EQIX at the time of writing. The editor holds a long-term utilities allocation indirectly through a broad U.S. equity position.
Methodology: trailing returns, volatility, and drawdowns from yfinance, pulled 2026-05-17, window 2021-05 to 2026-05. Expense ratio, AUM, and inception date from issuer fact sheets linked in the data table. Macro figures (10Y Treasury, fed funds, CPI, VIX) from FRED, as-of dates shown inline. Total returns assume reinvested distributions. The analysis covers a single rate cycle and one AI-capex acceleration; results should not be extrapolated to a full credit cycle.
This article is for educational purposes and does not constitute personalized financial advice. See full Disclaimer.