
The short version
- NLR, URA, and NUKZ all carry the "nuclear ETF" label but express three very different bets: utility cash flows, uranium spot leverage, and small modular reactor (SMR) optionality.
- Realized 5-year CAGR is high across the surviving funds (NLR 21.7%, URA 22.8%), but annualized vol is 29.0% and 43.5% respectively — these are not core-portfolio holdings.
- NUKZ has only ~16 months of history and $861M AUM; treat its forward record as unproven, not validated.
The thesis that AI data centers need firm, dispatchable, low-carbon power is now mainstream enough that three nuclear-themed ETFs have re-priced sharply over the past 24 months. The question worth investigating is not whether the thesis is correct — the data centers are being built either way — but whether public-market vehicles let a long-term investor actually capture the operating cash flows, or whether most of the return has already been pulled forward into the share price.
The three funds usually grouped together — VanEck's NLR, Global X's URA, and Range's NUKZ — share a label but differ on almost every dimension that matters: holdings concentration, beta to uranium spot, AUM scale, and how much of their record was generated under the current AI-power narrative versus pre-2022 conditions. This article works through the numbers and what they can, and cannot, tell a long-horizon investor.
Why nuclear is being repriced now
Three macro inputs are doing most of the work. First, hyperscaler power-purchase agreements signed since 2024 (Microsoft–Constellation at Three Mile Island, Amazon's Susquehanna deal, Meta's 2026 RFP for up to 6.6 GW of nuclear capacity) have given utility operators visibility into multi-decade contracted revenue at premium prices. Second, the U.S. 10-year Treasury yield sits at 4.47% with the Fed Funds rate at 3.64% (FRED, asof 2026-05-14 and 2026-04-01) — high enough to compress capital-intensive long-duration projects, but with a falling policy rate that improves the discount math each quarter. Third, the regulatory environment for advanced reactors has changed in kind, not just degree: the ADVANCE Act of 2024 explicitly directed the NRC to streamline licensing.
None of this guarantees the return profile from here looks like the return profile of the last five years. Backward-looking CAGR is partly a measure of how much the market re-rated the sector once the thesis became consensus.
The data: three funds, three different exposures
| Fund | Ticker | ER | AUM | Inception | Yield | 5Y CAGR | 10Y CAGR | 5Y Vol | Max DD (5Y) |
|---|---|---|---|---|---|---|---|---|---|
| VanEck Uranium & Nuclear | NLR | 0.52% | $5.1B | 2007-08-13 | 2.2% | 21.7% | 13.7% | 29.0% | -30.5% |
| Global X Uranium | URA | 0.69% | $7.8B | 2010-11-04 | 3.8% | 22.8% | 17.2% | 43.5% | -37.9% |
| Range Nuclear Renaissance | NUKZ | 0.85% | $0.86B | 2024-01-10 | 0.8% | n/a | n/a | n/a | n/a |
Source: yfinance, fetched 2026-05-17; issuer fact sheets (VanEck, Global X, Range Funds). NUKZ inception 2024-01-10 — no 5/10-year history available.
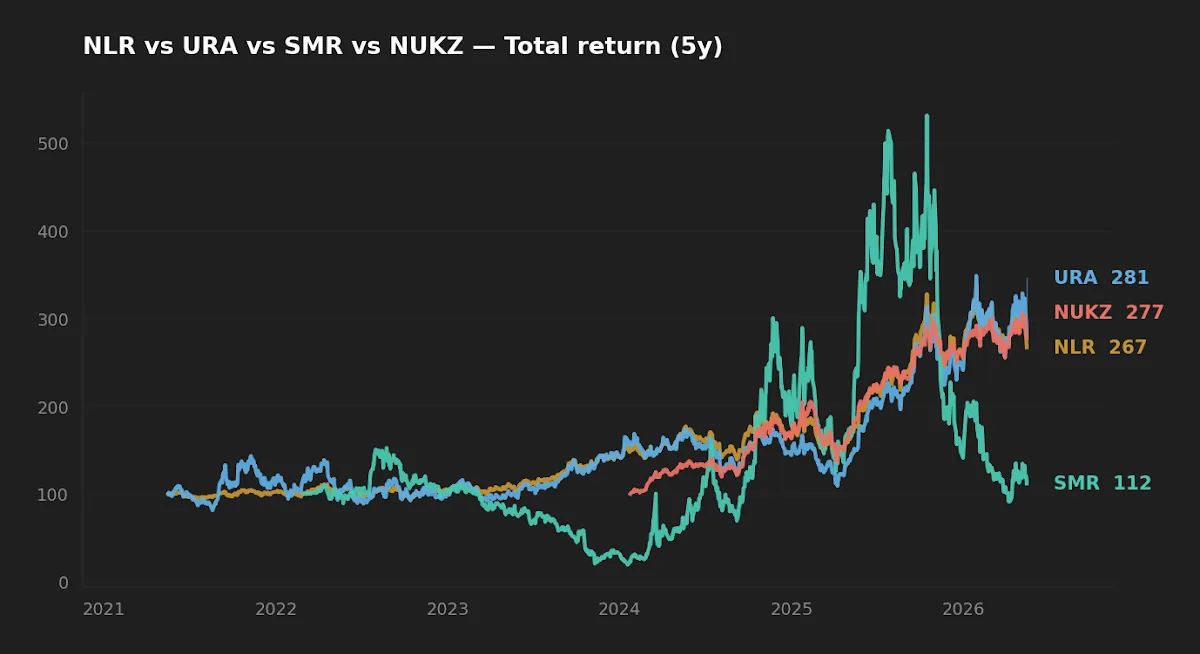
The first thing the table makes obvious: NLR and URA are not interchangeable. NLR's portfolio is dominated by listed nuclear utilities and operators — Constellation, Public Service Enterprise Group, Korea Electric Power, EDF — and its 2.2% trailing yield reflects that. URA pulls in the upstream chain: Cameco, Kazatomprom, NexGen, Sprott Physical Uranium Trust. The 43.5% annualized volatility versus NLR's 29.0% is a direct readout of that supply-chain leverage. Same theme, very different factor exposure.
NUKZ sits in a third category. It targets SMR developers and advanced-reactor pure-plays (NuScale Power, BWX Technologies, GE Vernova, Oklo). The interesting and unsettling fact is that it has only existed since January 2024 — its entire reported history is inside a single regime where the AI-power thesis was being priced in. There is no available record of how this basket behaves in a market that has lost interest in the theme.
The AI-power thesis, examined

The investable claim is straightforward: training and inference need round-the-clock electrons that intermittent renewables alone cannot supply, and hyperscalers are willing to sign 20-year power-purchase agreements at premium prices to lock that supply in. The independent variable to watch is not "is AI demand real" — it manifestly is — but how much of the future operating cash flow has already been capitalized into current equity prices.
A useful sanity check: a fund delivering 21.7% annualized over five years has roughly tripled. To deliver another 21.7% annualized over the next five would require either continued multiple expansion or a step-change in earnings power that matches the price action so far. Multiple expansion from a re-rating already underway is mechanically harder than from a forgotten sector, which is closer to where uranium-linked equities sat in 2020. Energy equities and the regimes that move them is worth reading alongside this.
A 21.7% five-year CAGR is partly a measure of how far the sector was repriced once the AI-power thesis became consensus — and consensus is exactly the wrong moment to assume the same compounding rate continues.
Realized risk: drawdowns matter more than headline returns
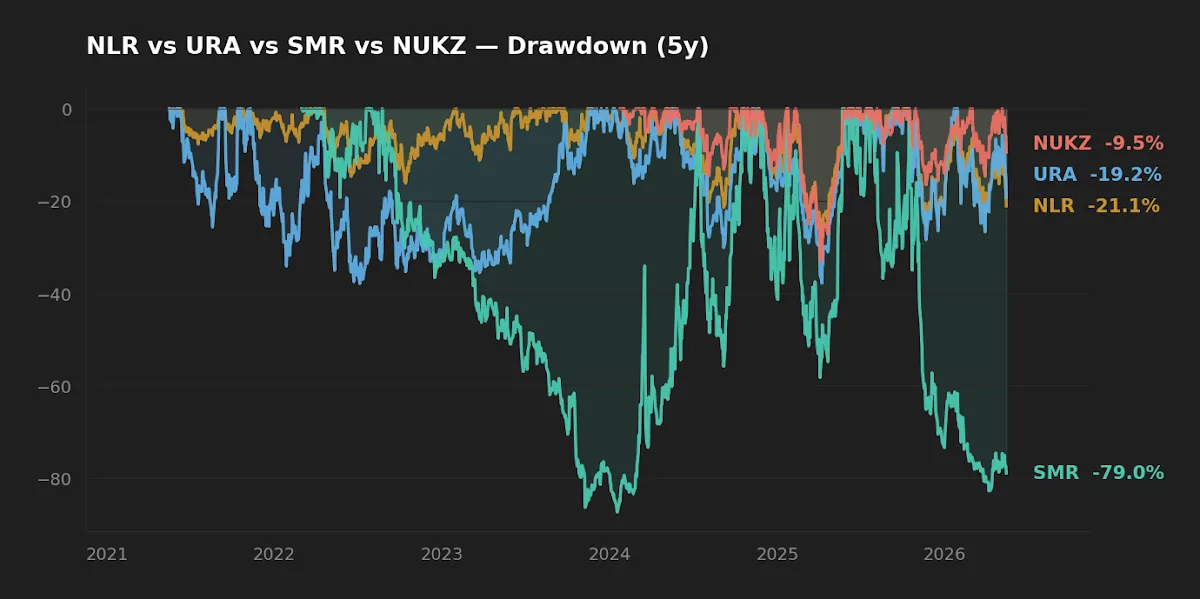
NLR's worst 5-year drawdown was -30.5%. URA's was -37.9%. Neither happened in a generalized bear market — they happened during a period when the S&P 500 was within a few percent of its highs. That is the part most coverage of thematic ETFs underplays: the sector-specific drawdown is not synchronized with broad equity drawdowns, which means it does not get cushioned by diversification within an equity sleeve. Behavior in stress is what determines whether a holding survives in a portfolio. A 37% drawdown on a thematic sleeve, in isolation, while the index is flat, is the kind of experience that causes investors to abandon a position at the worst possible point.
This is the single most important reason these ETFs belong in a satellite sleeve, not a core. The CAGR is real. So is the path.
Scoreboard: winner by category
| Category | Winner | Reason |
|---|---|---|
| Cost | NLR | 0.52% vs 0.69% (URA) and 0.85% (NUKZ) |
| Realized risk (lower is better) | NLR | 29.0% vol, -30.5% max DD vs URA's 43.5% / -37.9% |
| Realized 5Y return | URA | 22.8% vs NLR's 21.7% (marginal, with much higher path risk) |
| Suitability for a long-term sleeve | NLR | Larger AUM, lower turnover, dividend yield, longer history |
FAQ
Q: Should a nuclear ETF go in the core or a satellite sleeve?
Satellite. A single-theme equity sleeve with 29-44% annualized volatility does not behave like a diversified equity holding. Position-size accordingly — for most investors, that means a single-digit percentage of total equity exposure, capped by an explicit rebalancing band.
Q: NLR or URA — which one?
They are not substitutes. NLR is a utility-leaning bet on operating nuclear capacity and contracted cash flow; URA is a commodity-leaning bet on uranium spot. If the thesis is "AI demand pulls power-purchase prices higher", NLR is the more direct expression. If the thesis is "fuel supply tightens faster than new mines come online", URA is. Holding both dilutes the thesis without diversifying the risk much, because both move on the same headlines.
Q: Is NUKZ a better way to play SMRs?
NUKZ is the cleanest listed SMR exposure available today, but with 16 months of history, $861M AUM, and an 0.85% expense ratio, it is best treated as an unproven vehicle in an unproven sub-sector. Most SMR designs have not been commercially deployed; a meaningful share of the basket's value rests on developmental milestones that may or may not arrive on the implied schedule.
Q: Is the AI-power thesis already priced in?
Partially, by definition — that is what the 5-year CAGR represents. Whether it is fully priced in is unknowable in advance. The data-supported statement is that the margin of safety is smaller now than it was in 2021, which raises the bar for new entries.
Q: How does the 10-year Treasury at 4.47% affect this?
Utilities and capital-intensive infrastructure projects discount future cash flows at a rate tied to long Treasuries. A 4.47% 10Y (FRED, asof 2026-05-14) is meaningfully tighter than the post-2020 backdrop in which the initial repricing happened. A falling Fed Funds rate helps; a sticky long end does not. 2026 energy policy and long-term portfolios covers the policy side.
What this analysis can and cannot tell you
The CAGR, volatility, and drawdown numbers cover at most a 10-year window, much of which was a single macro regime (zero rates through 2022, then a sharp re-rating). NUKZ has not yet been observed through a single full sector cycle. The data does not include 2011-2015, when uranium equities fell roughly 70% post-Fukushima — a reminder that political and operational tail events can override fundamentals for years. None of the realized numbers should be projected forward without a haircut for regime-shift risk.
Scenarios where each fits
Reader with a diversified equity core and capacity for a 5-10% thematic sleeve: NLR is the closer fit to a "long-duration infrastructure" exposure with a modest dividend; pair with a strict rebalancing band so position drift is enforced.
Reader explicitly betting on uranium supply tightness: URA expresses that thesis directly. Size for the 43.5% annualized vol, not for the headline 22.8% CAGR.
Reader wanting SMR optionality with capped downside per position: NUKZ provides diversified SMR exposure that single-name buyers (NuScale, Oklo) do not get. Accept that the fund itself may not survive a sustained reversal in theme sentiment — closure risk is real for any sub-$1B thematic ETF.
Editor's read
If forced to pick one for a long-term satellite sleeve, the editor leans toward NLR: lower cost, lower realized volatility, an actual dividend yield, and a 19-year operating history that includes the post-Fukushima drawdown. URA has the higher beta to the most-discussed catalyst (uranium price), but its 43.5% annualized vol is not behavior most multi-decade investors will hold through. NUKZ is the most interesting of the three intellectually, and the hardest to underwrite — it deserves a small tactical position at most, not a long-term allocation.
The editor does not currently hold NLR, URA, or NUKZ at the time of writing.
Key takeaways
- Three nuclear ETFs, three exposures: NLR (utilities + operators), URA (uranium supply chain), NUKZ (SMR developers).
- Realized 5-year CAGR is high (21-23%) but came with 29-44% annualized vol and 30-38% max drawdowns — satellite sleeve sizing only.
- NLR wins on cost, on realized risk, and on having a track record across more than one regime.
- NUKZ's short history is the single largest unknown — do not project its peer-group return into its forward record.
- Position sizing and an explicit rebalancing band matter more than the ticker choice. A 10% sleeve with discipline outperforms a 25% sleeve held emotionally.
Methodology
Price and total-return series from yfinance, fetched 2026-05-17. Expense ratios, AUM, dividend yields, and inception dates cross-checked against issuer fact sheets (VanEck for NLR, Global X for URA, Range Funds for NUKZ). CAGR is annualized over trailing 5- and 10-year windows ending 2026-05-17; volatility is annualized daily standard deviation; max drawdown is peak-to-trough over the 5-year window. Macro data (10Y Treasury, Fed Funds, CPI) from FRED, asof dates noted inline.
This article is for educational purposes and does not constitute personalized financial advice. Disclaimer.