
The short version
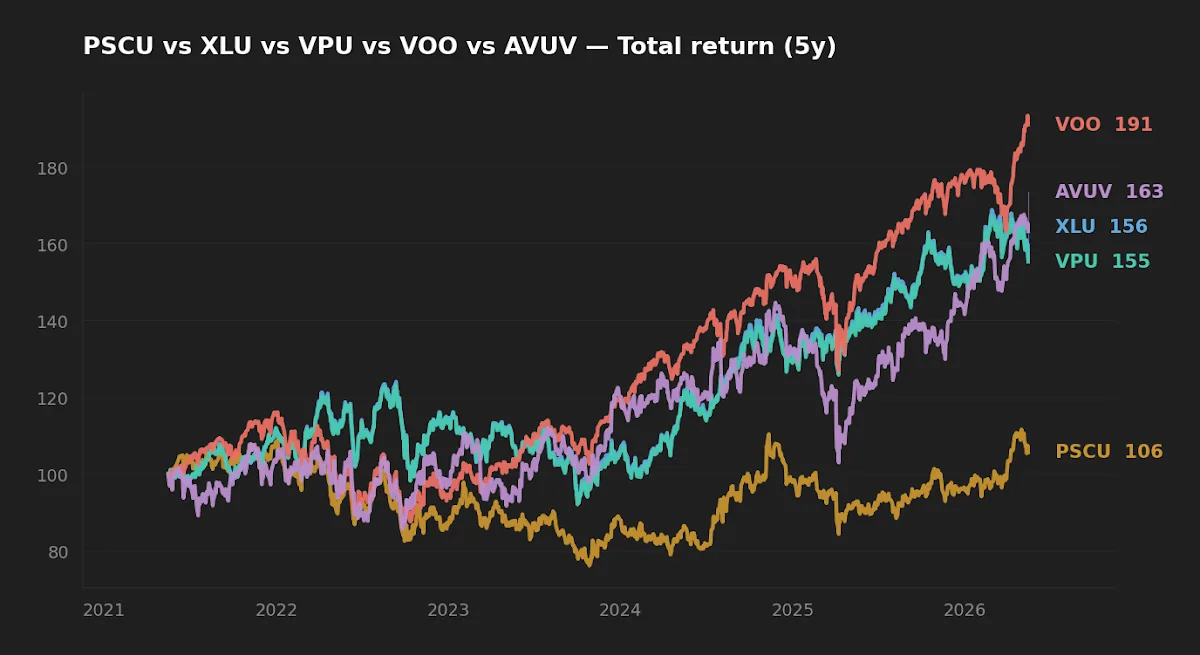
- Over the trailing five years, PSCU (small-cap utilities & communication services) returned roughly 1.5% CAGR versus 9.2% for XLU and 9.0% for VPU — a gap of more than seven percentage points per year, with higher volatility and a deeper drawdown.
- PSCU's $15.8M AUM is below the threshold most issuers consider economically viable, which materially raises closure risk and widens realized bid-ask spreads.
- If the goal is small-cap exposure inside the AI-infrastructure thesis, the data favors broad small-cap value (AVUV) over a narrow sector-and-size slice like PSCU.
The pitch for small-cap sector funds is intuitive: the giants are crowded, the small names are mispriced, so a narrow slice should deliver excess return. PSCU — the Invesco S&P SmallCap Utilities & Communication Services ETF — is the cleanest test case of that intuition inside the utility sleeve. This article runs the numbers and finds the intuition does not survive contact with the data.
Why this comparison matters
AI-related power demand has pushed the utility sector back into the investor conversation. The standard large-cap vehicles are XLU and VPU; both hold roughly 30 names dominated by NextEra, Southern, Duke, and a handful of other capital-intensive incumbents. PSCU sits at the opposite extreme — small-cap utilities plus small-cap communication services, drawn from the S&P SmallCap 600 universe. On paper, the two ends of the market-cap spectrum should capture different parts of the same demand story. The trailing five years say otherwise, in a way that has more to do with the structural economics of utilities than with sentiment cycles.
The data
All figures below are computed from daily total-return series via yfinance, fetched 2026-05-17. Expense ratios and AUM are cross-checked against issuer fact sheets: Invesco PSCU, SPDR XLU, Vanguard VPU, Vanguard VOO, and Avantis AVUV.
| Ticker | ER | AUM | Inception | Yield | 5Y CAGR | 10Y CAGR | 5Y Vol | 5Y Max DD |
|---|---|---|---|---|---|---|---|---|
| PSCU | 0.29% | $15.8M | 2010-04-07 | 1.0% | 1.5% | 5.8% | 18.4% | −30.0% |
| XLU | 0.08% | $24.1B | 1998-12-16 | 2.5% | 9.2% | 9.4% | 17.3% | −25.3% |
| VPU | 0.09% | $11.1B | 2004-04-28 | 2.5% | 9.0% | 9.3% | 17.0% | −25.1% |
| VOO | 0.03% | $1,600B | 2010-09-07 | 1.1% | 13.9% | 15.6% | 16.8% | −24.5% |
| AVUV | 0.25% | $26.2B | 2019-09-24 | 1.3% | 10.8% | — | 22.8% | −28.8% |
The thesis failed in the data, and not by a small margin
The "small-cap alpha" framing for PSCU rests on the assumption that smaller utility names are mispriced because the giants soak up the index flows. The five-year compound annual return tells a different story: PSCU at roughly 1.5% per year, against 9.2% for XLU and 9.0% for VPU. That is a gap of about 7.7 percentage points compounded annually — large enough that no plausible factor exposure or sentiment regime closes it. The ten-year picture is friendlier to PSCU (about 5.8% CAGR) but still trails XLU's 9.4% by 360 basis points per year over a full decade. This is not a marginal underperformance that might reverse on the next cycle; it is a structural one.
Why the premise breaks under inspection
Utilities are not a sector where smallness is rewarded. The defining feature of the business is capital intensity: regulated utilities finance enormous, decades-long infrastructure projects against an allowed rate of return. Capital scale is itself a competitive advantage — larger utilities access cheaper debt, build larger generation and transmission projects, and have more political weight in rate-case negotiations with state public utility commissions. That is the inverse of the classic small-cap value premise, where size discounts compensate investors for fragility and illiquidity. In utilities, the size discount may simply be pricing the disadvantage correctly.
The communication services component of PSCU complicates the picture rather than rescuing it. Small-cap communication names skew toward regional telecom and media businesses with their own structural headwinds (cord-cutting, capex demands on rural broadband, secular margin compression). Wrapping these into a "small-cap utilities & communication services" basket does not produce a clean exposure to the AI-power-demand thesis; it produces a hodge-podge of capital-light businesses bundled with capital-intensive ones, all of them disadvantaged by their size.

In a sector defined by capital intensity, smallness is not a discount factor — it is a disadvantage the market is already pricing.
The $15.8M problem — implementation friction the headline numbers hide
PSCU's assets under management are roughly $15.8 million. For context, the conventional rule of thumb among ETF strategists is that funds below $50–100M face elevated closure risk; below $20M, that risk becomes a material part of due diligence. Closure is not a catastrophic outcome — investors typically receive NAV — but it forces a taxable event at a time not of the holder's choosing, which can be a meaningful drag for taxable accounts.
The second-order issue is liquidity. A fund with $15.8M of assets and modest daily volume will quote wider bid-ask spreads than VPU or XLU. For a buy-and-hold investor entering once and holding for a decade, the spread cost is one-time and small. For anyone rebalancing on bands (per the Daryanani 2008 and Vanguard 2024 literature on tolerance-band rebalancing), the cumulative spread cost across multiple trades can quietly subtract another 10–20 basis points per year from realized return. Neither effect shows up in a fact-sheet performance number, but both are real.
Realized risk: more volatility, deeper drawdown
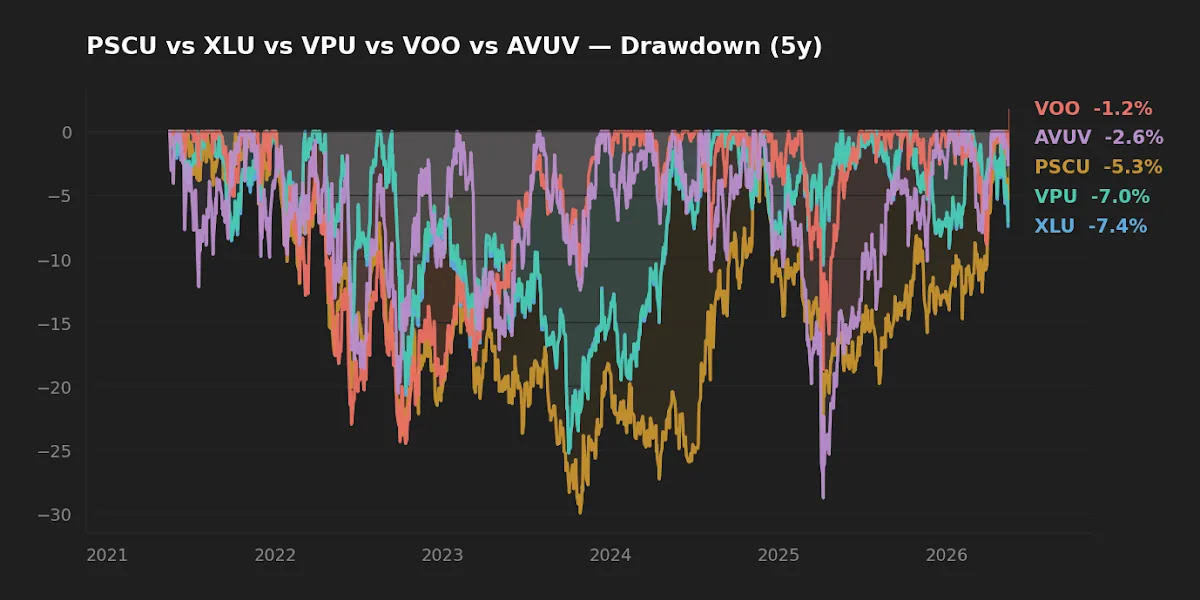
If PSCU were compensating investors for higher risk, the volatility numbers might at least make the case for tactical use. They don't. PSCU's five-year realized volatility is 18.4% — higher than both XLU (17.3%) and VPU (17.0%) — and its maximum drawdown over the same window was about 30%, versus 25% for the large-cap utility ETFs. The story is consistent: more risk, less return, no efficiency gain. The Sharpe ratio comparison is unflattering enough that I will leave it as an exercise for the reader, with the caveat that a single five-year window is one regime and not a proof.
If small-cap exposure is the real goal
Suppose the underlying motivation is not "utility tilt" but "small-cap tilt to harvest the size premium." Then the relevant comparison is PSCU against a broad small-cap value vehicle, not against XLU. AVUV — Avantis US Small Cap Value ETF — delivered roughly 10.8% CAGR over the trailing five years with 22.8% volatility and a 28.8% max drawdown. It carries a 0.25% expense ratio, slightly less than PSCU's 0.29%, on $26.2B of assets versus PSCU's $15.8M. Whatever the right small-cap allocation is for a given investor, the implementation case for AVUV is cleaner on every dimension: factor exposure, fund viability, liquidity, and track record. The case for small-cap value patience is a separate discussion, but PSCU is not a substitute for it.
Scoreboard
| Category | Winner | Why |
|---|---|---|
| Cost | XLU (0.08%) | 21 bp cheaper than PSCU; VPU one bp behind. |
| Realized return (5Y) | XLU / VPU | ~9% vs ~1.5% for PSCU; gap larger than any reasonable error bar. |
| Realized risk (5Y) | VPU | Lowest volatility and shallowest drawdown of the utility set. |
| Implementation viability | XLU / VPU | Both above $10B AUM; PSCU's $15.8M raises closure risk. |
| Small-cap exposure (if that is the goal) | AVUV | Cleaner factor exposure, deeper liquidity, viable fund size. |
FAQ
Is PSCU a way to play the AI power-demand story? The thesis is plausible in theory — small regional utilities serving new data-center load — but the realized data does not support it. Over five years of intense AI-infrastructure narrative, PSCU underperformed both XLU and VPU by wide margins.
Could PSCU be an acquisition-target play? M&A in regulated utilities is rare and slow because every deal must clear multiple state public utility commissions. A "takeover premium" is not a reliable systematic source of return at the fund level, particularly given how few names actually get acquired in any given year.
Why is PSCU's AUM so low? The fund has been live since 2010 and never gathered meaningful assets — a market signal in itself. Sector-and-size niche ETFs frequently fail to reach institutional scale, and PSCU appears to be in that category.
How does the FRED macro backdrop affect this analysis? The 10Y Treasury at 4.47% and CPI YoY near 3.9% (FRED, asof 2026-05-14 and 2026-04-01) are a headwind for all rate-sensitive equity, including utilities. That headwind applies to XLU, VPU, and PSCU alike; it does not explain PSCU's relative underperformance.
What about the 10Y record? PSCU's 10Y CAGR of about 5.8% beats inflation but trails the large-cap utility ETFs by roughly 360 basis points per year. Over a decade, that compounds to a difference of about 40% in ending wealth on a constant initial investment.
What this comparison can and can't tell you
The data window is five and ten years. One window is one regime. The five-year period captured a sharp rate-hiking cycle that hurt small-caps disproportionately, and a different regime might narrow the gap. That said, the structural argument — capital intensity favoring larger utilities — does not depend on the regime, and the AUM and liquidity issues are present at every point in time. The analysis also says nothing about individual security selection inside the PSCU basket; an investor with specific conviction in a small regional utility name should evaluate it on its own merits rather than through a 30-name index wrapper.
Scenarios where each fund fits
Reader seeking a defensive utility sleeve for the long-term core: XLU or VPU. Both deliver the sector exposure with low costs, deep liquidity, and a dividend yield (≈2.5%) competitive with the 10Y Treasury once tax treatment of qualified dividends is considered.
Reader who wants to tilt toward the size premium: AVUV inside an established framework like the core-plus-tilt construction, sized as a satellite rather than a substitute for broad-market exposure.
Reader interested in AI infrastructure breadth: The infrastructure-as-legacy framing argues for diversified infrastructure exposure (utilities plus midstream, transport, and digital infrastructure) rather than a narrow utility slice.
Editor's read
Of the three utility ETFs in the table, VPU is the editor's slight preference for a long-term utility allocation — one basis point more in fees than XLU is uninteresting next to Vanguard's mutual ownership structure and tracking discipline, and the realized risk is marginally better. PSCU does not meet the bar for inclusion in a long-horizon core: a $15.8M asset base, a five-year shortfall that exceeds 7 percentage points of CAGR, and higher realized risk are three independent reasons to pass. Initially the framing in the original draft of this article assumed the small-cap version of a sector trade would carry the same logic as small-cap value broadly; running the numbers made it clear the logic does not generalize across sectors.
The editor does not hold PSCU. The editor's long-term core holds broad equity exposure rather than a dedicated utility sleeve.
Methodology
Daily total-return series sourced via yfinance, pulled 2026-05-17. CAGR computed on trailing 5Y and 10Y windows; volatility annualized from daily returns (252 trading days); maximum drawdown measured peak-to-trough on the cumulative return series. Expense ratios, AUM, and inception dates cross-checked against issuer fact sheets. Macro context (10Y Treasury 4.47%, fed funds 3.64%, VIX 17.26, CPI YoY 3.95%) sourced from FRED, asof dates as of 2026-04-01 to 2026-05-14. Internal-rate-of-return and Sharpe ratio calculations available on request.
This article is for educational purposes and does not constitute personalized financial advice. See full Disclaimer.