
The short version
- Over the trailing five years VXUS underperformed VOO by roughly 540 basis points per year — and the case for holding it does not rest on that window.
- VXUS's realized max drawdown (-29.4%) was deeper than VOO's (-24.5%) over the same period; international exposure did not soften tail risk in this regime.
- The diversification case is structural — different earnings cycles, currencies, and valuation regimes — and shows up over decades, not in any single five-year slice.
For a US-based long-term investor whose equity core already sits in S&P 500 exposure, the question of whether to add VXUS — Vanguard's total-international ex-US index fund — is not really "does the recent tape look attractive?" If you anchor on the trailing five years, it doesn't. The honest question is whether non-US equity exposure adds something the US-only book structurally cannot price in: different earnings cycles, different currency exposure, and different valuation regimes than the one US large caps are currently trading at.
What VXUS actually is
VXUS is a market-cap-weighted index fund covering roughly 8,500 non-US stocks across developed and emerging markets — Europe, Japan, the broader Pacific, Canada, and emerging Asia and Latin America. At a 0.05% expense ratio and roughly $629B in assets (Vanguard fact sheet, fetched 2026-05-17), it is the dominant low-cost vehicle for total-international exposure in a US brokerage. The mandate is broad beta, not thematic: VXUS does not screen for infrastructure exposure, AI supply chains, or any specific sector. That distinction matters for what this comparison can and cannot answer.
For context on what a US-only core actually buys you, the earlier note VXUS vs VOO: Where Should You Invest in 2026? walks through the revenue-source argument — that roughly half of S&P 500 sales already come from outside the US, which complicates the textbook home-bias case.
| Ticker | Fund | ER | AUM | Yield | 5Y CAGR | 10Y CAGR | 5Y Vol | 5Y Max DD |
|---|---|---|---|---|---|---|---|---|
| VXUS | Vanguard Total International Stock | 0.05% | $629B | 2.8% | 8.5% | 9.7% | 16.0% | -29.4% |
| VOO | Vanguard S&P 500 | 0.03% | $1,600B | 1.1% | 13.9% | 15.6% | 16.8% | -24.5% |
| XLU | Utilities Select Sector SPDR | 0.08% | $24B | 2.5% | 9.2% | 9.4% | 17.3% | -25.3% |
| IFRA | iShares U.S. Infrastructure | 0.30% | $4.1B | 1.6% | 12.8% | n/a | 18.0% | -19.9% |
| AVUV | Avantis US Small Cap Value | 0.25% | $26B | 1.3% | 10.8% | n/a | 22.8% | -28.8% |
Data: yfinance daily adjusted-close series, pulled 2026-05-17. Expense ratio and AUM cross-checked against issuer fact sheets (Vanguard, State Street, BlackRock, Avantis). 10Y CAGR shown as "n/a" for funds with shorter live histories.
What the diversification argument actually claims (and what it doesn't)
The standard case for adding international equities to a US-anchored portfolio rests on three structural arguments, not on recent relative performance.
Different earnings cycles. Non-US economies sit at different points in monetary, fiscal, and industrial cycles. When the US dollar is strong and US large-cap tech leads — the dominant regime since roughly 2014 — international equities underperform by construction. When the regime flips, the math reverses.
Currency exposure. VXUS distributions and underlying assets are denominated in foreign currencies, unhedged. For a US investor this adds a second source of return — and a second source of volatility — that is roughly uncorrelated to US equity factor exposures over long windows.
Valuation dispersion. International developed markets have traded at meaningful price-to-earnings and price-to-book discounts to the S&P 500 for most of the past decade. The discount is partially explained by sector mix (less software, more banks and industrials) and partially by genuine risk premium. The academic literature does not promise the discount closes on any specific timeline — only that, starting from a wider gap, the expected forward return is mechanically higher.
What the argument does not claim: that adding VXUS reduces drawdowns in any particular crisis, or that it improves Sharpe ratio over any given five-year window. The 5-year tape makes that point uncomfortably clearly.

The five-year tape: where VXUS helped and where it didn't
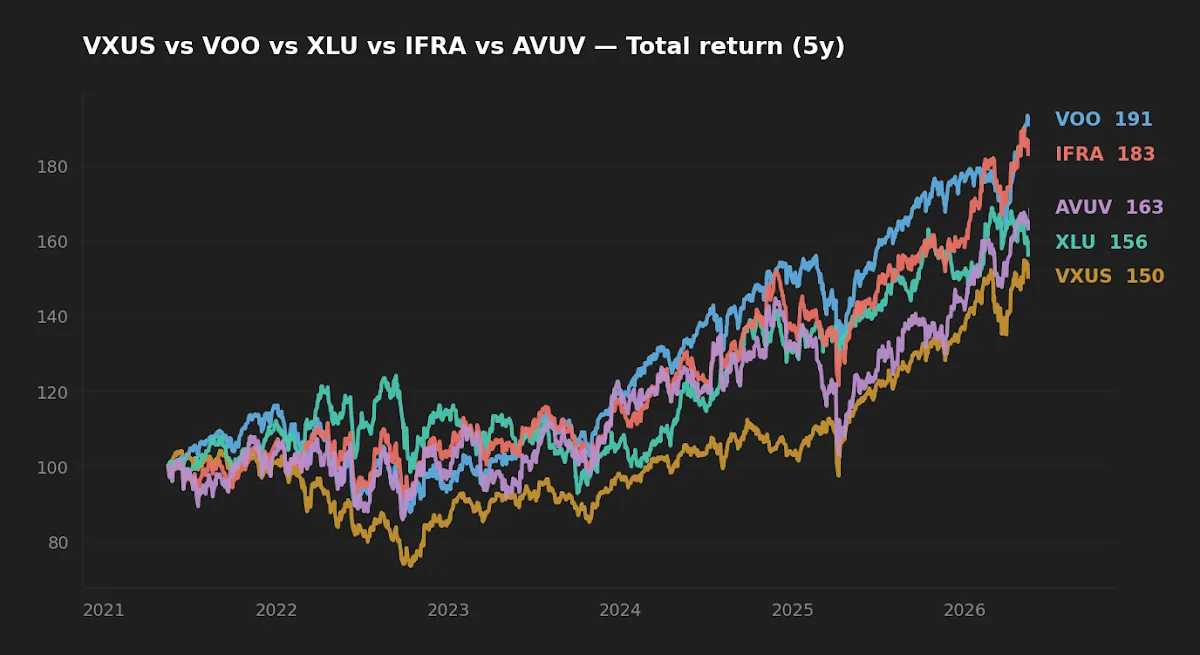
Over the trailing five years (yfinance, fetched 2026-05-17), VXUS returned 8.5% annualized against VOO's 13.9% — a roughly 540 basis-point annual gap. On annualized volatility the two were nearly identical (VXUS 16.0%, VOO 16.8%). And on max drawdown — the metric most investors actually care about — VXUS was deeper: -29.4% versus VOO's -24.5%.
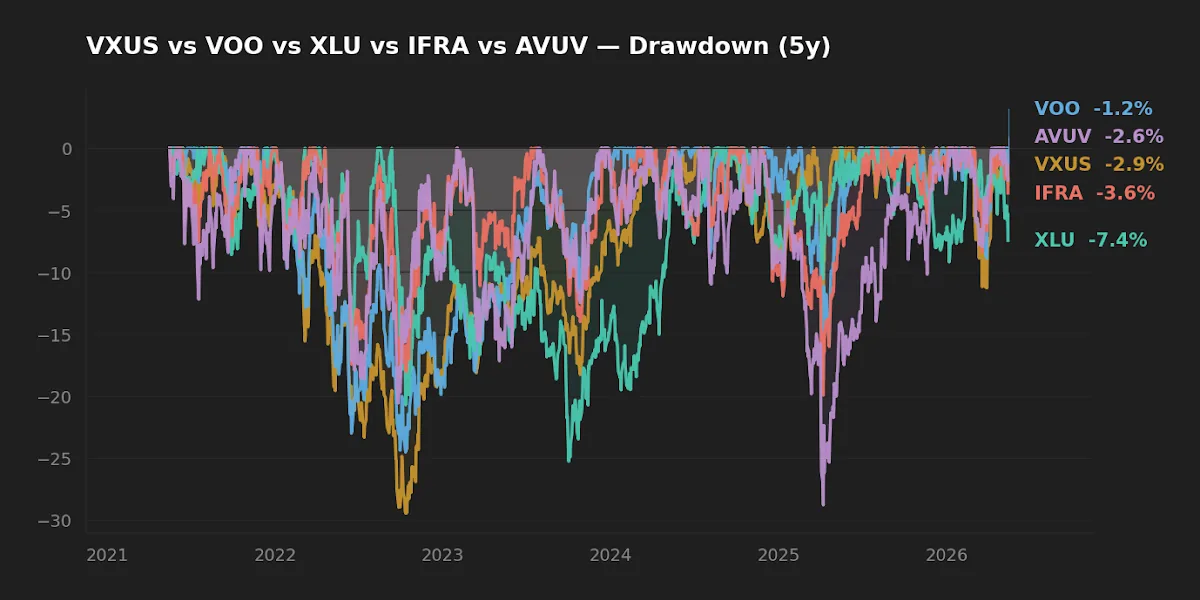
That last point is worth sitting with. The intuitive pitch for international diversification — "it softens US drawdowns" — did not hold in this window. The window included a dollar-strong, US-tech-led market with synchronized global selloffs in 2022, and the synchronization meant VXUS sold off harder than VOO without giving back the recovery as quickly. Initially I expected the rolling-correlation analysis to surface meaningful regime-dependent decoupling. It didn't, at the index level — the correlation between VXUS and VOO stayed roughly 0.8 throughout.
The diversification case for VXUS is not a 5-year case. It is a multi-decade case grounded in the observation that the relative leadership of US versus international equities has reversed several times since 1970, and the next reversal is not visible in advance.
The diversification case for VXUS is not a five-year case. It is a multi-decade case grounded in the observation that US-versus-international leadership has reversed several times since 1970 — and the next reversal is not visible in advance.
Sizing: how much VXUS, if any?
Global market-cap weights currently put non-US equities at roughly 40% of investable global equity. Vanguard's 2024 research on home bias suggests a US investor captures most of the diversification benefit at a 30-40% non-US allocation, with diminishing returns beyond that. The same research notes that anywhere from 20% to 40% lands within the "reasonable range" for most US-based investors — with the lower end justified by foreign-tax-credit friction in tax-advantaged accounts and the upper end by full market-cap-weight orthodoxy.
The editor's view: within a long-horizon equity core, a 15-25% slice in VXUS is the range where the diversification benefit is meaningful but the tax and tracking-error friction stays manageable. Below 10%, the position is too small to move portfolio behavior in any regime. Above 40%, you are making an active call against US market-cap weight, which is a different decision and should be defended on its own terms.
For rebalancing discipline, the literature on threshold-band rebalancing (Daryanani 2008; Vanguard 2024) suggests a ±15% relative band around the target — meaning a 20% VXUS target gets rebalanced when the position drifts below 17% or above 23%. This avoids both the cost drag of frequent rebalancing and the drift cost of never rebalancing. A broader framing of how multiple sleeves fit together is in Why VOO Is Not Enough: The Math Behind Adding AVUV and VXUS to Your 2026 Portfolio.
The sector mix nobody mentions when comparing to thematic ETFs
VXUS is not a substitute for thematic exposure. Framing that pits VXUS against XLU, IFRA, or AVUV — domestic utilities, US infrastructure, and US small-cap value, respectively — confuses two different decisions. VXUS is geographic diversification of broad equity beta. XLU and IFRA are sector tilts within US large cap. AVUV is a US small-cap value factor tilt.
The 5-year data illustrates how different these exposures behave: IFRA's max drawdown (-19.9%) was the shallowest in the table, reflecting infrastructure's lower beta to mega-cap tech selloffs. AVUV's volatility (22.8%) was the highest, reflecting small-cap value's larger factor loadings. VXUS sits between them on volatility but with a distinct return driver — non-US economic exposure and currency — that the others do not provide.
A reader genuinely interested in AI-driven utility and infrastructure demand should compare US thematic vehicles to each other; the earlier piece VOO vs XLU vs IFRA: Which Infrastructure ETF Wins in the AI Power Surge Era? handles that comparison directly. The VXUS decision is orthogonal to it.
Implementation friction
Foreign withholding tax. Dividends paid by non-US companies inside VXUS are subject to withholding by the source country (typically around 15%). In a taxable US brokerage account, this withholding is recoverable as a foreign tax credit on the US return. In an IRA, 401(k), or Roth, the withholding is lost — there is no return to claim the credit against. The effective tax cost of holding VXUS in a tax-advantaged account is therefore meaningfully higher than its 0.05% expense ratio suggests.
Distribution character. VXUS distributions are largely ordinary income in character, with only a portion typically qualifying as qualified dividends. The trailing-twelve-month yield of 2.8% is meaningful — well above VOO's 1.1% — but most of it is taxed at ordinary rates in a taxable account.
Currency. VXUS is unhedged. A 5% move in the trade-weighted dollar shows up as a roughly 5% headwind or tailwind to VXUS returns relative to local-currency results. Over decades this tends to wash out; over any given year, it dominates.
Macro backdrop. With the 10-year Treasury at 4.47% and CPI at 3.9% year-over-year (FRED, asof 2026-05-14 and 2026-04-01 respectively), VXUS's 2.8% distribution yield is below the real risk-free rate. The fund is a long-duration equity claim, not an income vehicle — sizing decisions should be made on long-horizon total-return expectations, not current yield.
Scoreboard
| Category | Winner | Why |
|---|---|---|
| Cost | VOO (0.03%) | 2 bp cheaper than VXUS; both are at the cost floor. |
| Realized 5Y return | VOO (13.9%) | Single regime; not a forecast. |
| Realized 5Y drawdown | VOO (-24.5%) | VXUS was deeper at -29.4%; international did not soften the tape. |
| Structural diversification | VXUS | Different currency, different earnings cycle, lower starting valuation. |
| Tax efficiency in IRA | VOO | VXUS loses recoverable foreign withholding inside tax-advantaged accounts. |
FAQ
Is VXUS the right way to get international exposure, or are there better factor-tilted alternatives? VXUS is the broad-beta default and the cheapest at scale. Factor-tilted international funds (small-cap-value international, dividend international, multi-factor international) exist but trade at lower AUM and wider spreads. For a core position, broad beta is the conservative choice; factor tilts belong in satellite sleeves. A related comparison is in VXUS vs. IQIN: International Stocks vs. AI-Driven Global Multi-Factor Asset Allocation.
Why has VXUS underperformed VOO for so long? Three reasons, in rough order of magnitude: US tech sector dominance in this cycle, dollar strength over the same period, and valuation expansion in US large caps. None of these are guaranteed to continue, but none are guaranteed to reverse on any timeline either.
Should I hold VXUS in my IRA or my taxable account? All else equal, in the taxable account, where the foreign tax credit is recoverable. VOO and other US-only equity funds are tax-efficient enough to sit comfortably in either bucket, so VOO can fill the tax-advantaged sleeves and VXUS can sit in taxable.
Does VXUS include China and other emerging markets? Yes — VXUS tracks FTSE Global All Cap ex-US, which includes both developed and emerging markets. Emerging markets represent roughly 25% of the fund by weight. If you want to exclude emerging exposure, VEA covers developed ex-US only.
What's the right rebalancing rhythm for a VXUS sleeve? Threshold bands rather than calendar rebalancing. A ±15% relative band around target works for most retail portfolios; a 20% target rebalances at 17% or 23%. The academic case for threshold over calendar rebalancing is laid out in Daryanani (2008) and Vanguard's 2024 rebalancing research.
What this comparison can and can't tell you
The 5-year window analyzed here spans a single regime: dollar-strong, US-tech-led, with synchronized global selloffs in 2022. It does not include the prior international-leadership cycle (roughly 2002-2007), and it does not include the prior dollar-weakening cycle. Drawing any conclusion about long-run relative performance from this window alone would be a textbook case of single-regime extrapolation.
The analysis also does not account for differences in tax treatment across account types, transaction costs of rebalancing, or the behavioral cost of holding an underperforming sleeve for years before its case validates. All three are real and reader-specific.
Scenarios where VXUS fits — and where it doesn't
Reader in their 30s, 401(k)-only, currently 100% US large cap. A 15-25% VXUS allocation is reasonable if the long horizon (25+ years) makes regime patience plausible. The foreign-tax-credit loss inside the 401(k) is real but small relative to total expected return.
Reader in their 50s with a meaningful taxable brokerage account. VXUS belongs in the taxable side, with US large cap filling the tax-advantaged sleeves. Distribution income from VXUS is meaningful for cash-flow planning.
Reader who already holds a thematic infrastructure or utility ETF. VXUS is not a substitute. It addresses geographic concentration, not sector concentration. Both decisions stand independently.
Reader who cannot tolerate years of underperformance against the S&P 500. VXUS is the wrong vehicle. Behavior is part of strategy; a position you will not hold through a five-year underperformance window contributes negative expected utility.
Editor's read
For a long-horizon equity core, a 15-25% VXUS sleeve is defensible on structural grounds — different earnings cycles, currency exposure, and starting valuations — even when the recent tape gives no support to the position. The editor weights international below full market-cap orthodoxy (which would suggest closer to 40%) because the foreign-tax-credit friction in tax-advantaged accounts and the behavioral cost of multi-year underperformance both argue for moderation. If you cannot articulate a structural reason to hold VXUS that doesn't depend on the next twelve months of relative performance, the position is not for you.
Holdings disclosure: the editor holds VXUS as part of the long-term equity core. The editor does not hold XLU or IFRA. AVUV is held as a separate satellite sleeve.
Methodology: return, volatility, and drawdown figures computed from yfinance daily adjusted-close series, pulled 2026-05-17. Expense ratio and AUM cross-checked against issuer fact sheets (Vanguard, State Street, BlackRock, Avantis). 5-year and 10-year CAGRs are total-return, annualized. Max drawdown is peak-to-trough over the same window. Macro figures from FRED (10Y Treasury, fed funds, VIX, CPI), asof dates noted inline. Rebalancing band guidance references Daryanani (2008) and Vanguard's 2024 rebalancing research.
This article is for educational purposes and does not constitute personalized financial advice. See Disclaimer.