
The short version
- Over five years, VOO (13.9% CAGR) beat both XLU (9.2%) and IFRA (12.8%) on raw return — the AI tailwind didn't show up in the "picks-and-shovels" trade the way headlines suggest.
- IFRA's 5Y max drawdown (-19.9%) was meaningfully shallower than VOO's (-24.5%) and XLU's (-25.3%), making it the only one of the three that actually behaved like a diversifier in stress.
- None of these is a substitute for VOO in a long-horizon core. XLU and IFRA are satellite tilts with specific factor and rate sensitivities you need to underwrite explicitly.
The AI capex story has reframed how a lot of investors think about the boring corners of the market. Utilities became "the AI power trade." Industrial infrastructure became "the AI picks-and-shovels trade." The pitch is compelling, but the actual five-year numbers tell a more measured story — and a few things in the data run counter to the popular narrative. This piece compares VOO (Vanguard S&P 500), XLU (Utilities Select Sector SPDR), and IFRA (iShares U.S. Infrastructure) on what the data shows, what it doesn't, and where each one might reasonably fit.
Context: why this comparison even exists
The case for utilities and industrial infrastructure as "AI plays" rests on a real economic premise. Hyperscaler datacenter capex is projected by major sell-side desks to exceed $400B annually by late decade, and most of those facilities draw power densities that strain existing transmission. Grid build-out, transformer manufacturing, and aggregate construction are downstream beneficiaries. That's the bull case in one paragraph.
The problem is that "downstream of a structural theme" and "outperforms a broad-market index" are not the same thing. Capacity gets built, competition compresses margins, regulated utilities still earn regulated returns on equity, and the marginal AI dollar flows to the companies designing the chips and selling the software — not the contractor laying conduit. The data below reflects this gap.
The numbers
Below: expense ratios from issuer fact sheets, total return CAGR and realized volatility from yfinance, AUM and NAV as of 2026-05-17.
| Metric | VOO | XLU | IFRA |
|---|---|---|---|
| Expense ratio | 0.03% | 0.08% | 0.30% |
| AUM | $1,600B | $24.1B | $4.1B |
| Dividend yield (TTM) | 1.1% | 2.5% | 1.6% |
| Inception | 2010-09 | 1998-12 | 2018-04 |
| 5Y CAGR (total return) | 13.9% | 9.2% | 12.8% |
| 10Y CAGR | 15.6% | 9.4% | n/a (post-2018) |
| 5Y annualized vol | 16.8% | 17.3% | 18.0% |
| 5Y max drawdown | -24.5% | -25.3% | -19.9% |
Sources: Vanguard VOO fact sheet, SPDR XLU fact sheet, iShares IFRA fact sheet. Return and risk metrics computed from yfinance daily total returns, window 2021-05 to 2026-05.
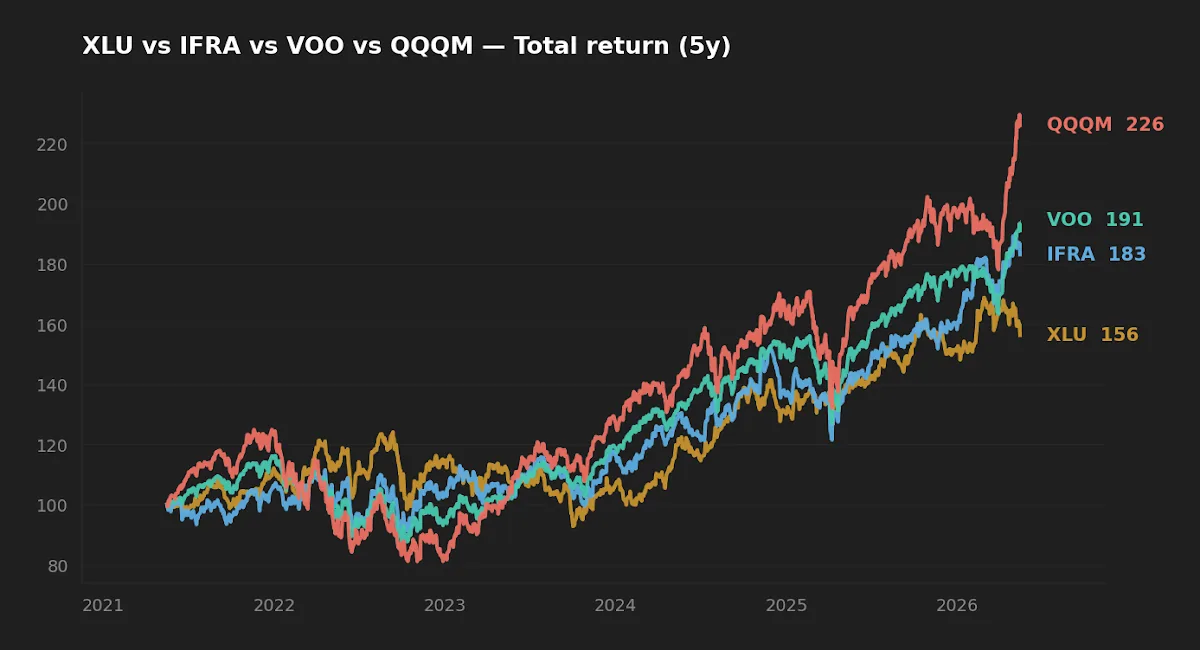
What the realized return tells us — and what it doesn't
VOO's 4.7 percentage-point CAGR lead over XLU and 1.1-point lead over IFRA is, in compounding terms, not small. On a $100,000 base over five years, the gap between VOO and XLU is roughly $36,000 of terminal wealth. The "rotation into utilities" trade that filled financial media in 2024-2025 produced periods of strong relative outperformance for XLU but did not change the longer-run gap.
The 5Y window also includes a specific regime: the 2022 rate-shock drawdown, the 2023-2024 AI-driven mega-cap rally, and the 2025 mid-cycle digestion. XLU's rate sensitivity (long-duration cash flows discounted against a 10Y Treasury that ran from 1.5% to a current 4.47% per FRED as of 2026-05-14) was a meaningful headwind for the first half of the window and a tailwind for the second. Reading XLU's 9.2% CAGR as steady-state is a mistake — the path was lumpy.
IFRA is more interesting than its top-line number suggests. Despite carrying a 0.30% expense ratio (10x VOO's), it produced a return within striking distance of the S&P 500 with a meaningfully different factor exposure. The fund's equal-weight construction across utilities, industrials, and materials means it tilts away from mega-cap tech concentration in a way XLU does not — IFRA is roughly 40% industrials, 20% utilities, 15% materials at the time of writing, not a pure utility play.

Realized risk: the one place IFRA actually wins
The drawdown chart is where the analysis stops being a straight return comparison. IFRA's worst 5Y drawdown of -19.9% is roughly 5 percentage points shallower than both VOO (-24.5%) and XLU (-25.3%). That's the kind of difference that materially affects sequence-of-returns risk for investors drawing down a portfolio.
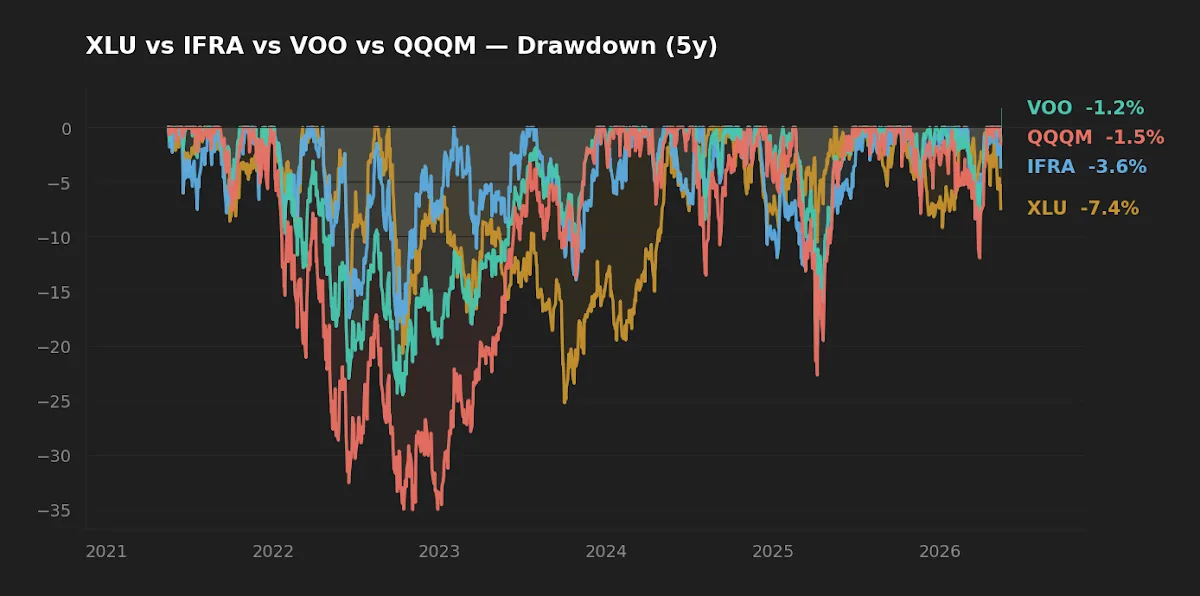
Worth noting what's not in this picture: IFRA launched in April 2018, so we have no data on how it behaved in 2008-09 or in any pre-QE rate regime. XLU has a 1998 inception and lived through both the dot-com bust and 2008 — its long-run drawdown profile is documented. IFRA's profile is inferred from less than seven years of live data, and the rolling correlation to the broad market has drifted higher as AI-themed flows pulled industrials toward the same factor crowding as mega-cap tech. Initially the diversification benefit looked structural; the recent data suggests at least part of it is regime-dependent.
IFRA's shallower drawdown is the most defensible reason to own it. The "AI infrastructure" narrative is the least defensible reason.
Cost, capacity, and the implementation friction nobody mentions
VOO at 0.03% is essentially free; the bid-ask spread is narrower than a basis point on a normal trading day. XLU at 0.08% with $24B in AUM behaves similarly — institutional-grade liquidity, tight spreads.
IFRA is a different animal. At $4.1B AUM it's well above the closure-risk threshold but small enough that thematic flows move the price meaningfully. The 0.30% expense ratio is a 27 basis-point annual drag versus VOO, which compounds to roughly 5.4% of terminal wealth lost to fees over 20 years (1.0027^20 − 1, expressed as fraction of return foregone). For a satellite position sized at 5-10% of portfolio, that drag is tolerable; for a core position it isn't.
One more friction point worth flagging: utilities-heavy funds like XLU distribute a higher fraction of ordinary (non-qualified) dividend income from REIT-like utility holdings than VOO does. The tax-cost ratio difference in a taxable account is typically 30-50 basis points per year on top of the expense ratio. Investors comparing the 2.5% XLU yield against the 1.1% VOO yield in a taxable account should net this down.
Macro overlay: where the rate path matters
With the 10Y Treasury at 4.47% and Fed Funds at 3.64% (FRED, as of 2026-05-14), utilities are no longer trading at the duration-driven valuations they enjoyed during ZIRP. XLU's forward P/E of roughly 18x is closer to its long-term average than the 22x it touched in 2021. That's a more honest entry point but not a screaming bargain. The income story (2.5% yield) is also less compelling when 1-3 month T-bills yield more than 4% with no equity risk.
IFRA's industrial component is more sensitive to the capex cycle than to rates directly. With CPI YoY at 3.95% (FRED, 2026-04-01) and the Fed in a measured easing posture, the macro setup for industrial build-out is constructive but not obviously a generational opportunity. The thesis depends on actual capex translating to actual revenue at portfolio-weighted companies — a chain of assumptions worth holding loosely.
Scoreboard
| Category | Winner | Why |
|---|---|---|
| Cost | VOO | 0.03% vs 0.08% / 0.30% |
| 5Y realized return | VOO | 13.9% CAGR, ~470 bps ahead of XLU |
| 5Y realized risk (drawdown) | IFRA | -19.9% vs -24.5% / -25.3% |
| Income | XLU | 2.5% yield, though tax-cost ratio offsets |
| Suitability as long-term core | VOO | Diversification, cost, capacity, regime coverage |
FAQ
Q: Doesn't the AI power-demand thesis make XLU a structural buy?
A thesis is not a CAGR. The five-year data shows XLU trailing VOO by ~470 bps annualized despite the AI-power narrative being in the news for most of that window. The narrative may eventually translate to realized returns; it has not yet meaningfully done so.
Q: Is IFRA a better diversifier than adding bonds?
For an investor with substantial equity exposure already, a small tilt to IFRA reduces drawdown depth modestly but does not provide the negative-correlation benefit a high-quality bond allocation does in a deflationary shock. They solve different problems.
Q: If I had to pick between VPU and XLU?
That's a different comparison covered in VPU vs XLU: Battle of the Lowest Fees. Short version: VPU is broader and slightly cheaper; XLU is more concentrated in the largest regulated utilities.
Q: What about international infrastructure exposure?
IFRA is U.S.-only by design. Global infrastructure funds (e.g., NFRA) exist but introduce currency exposure and a different regulatory mix. For investors who already hold an international equity sleeve, U.S.-only infrastructure overlap is the simpler choice.
Q: How does this fit into a broader long-term allocation?
The framework discussion in The Rationale Behind a Five-ETF Long-Term Core covers how satellite tilts should be sized relative to a broad-market core. As a rule of thumb, individual sector or thematic tilts shouldn't exceed ~10% of the equity sleeve.
What this comparison can and can't tell you
The five-year window covers exactly one full Fed tightening cycle and the early stages of an easing cycle. It does not cover a sustained deflationary recession, a 1970s-style stagflation, or any prolonged bear market in equities. IFRA has no live data outside this window. XLU has long history but in very different rate regimes. Drawing strong conclusions about future relative performance from this sample is statistically thin. The methodology footer notes the exact window and data source so the reader can replicate or extend the analysis.
Scenarios where each fund fits
- Reader in 30s, 401(k)-only, building the equity core: VOO (or a comparable total-market fund) does the work. Adding XLU or IFRA at this stage is a tilt looking for a justification.
- Reader nearing retirement, drawdown-sensitive: IFRA's shallower realized drawdown is the most defensible argument for a 5-8% satellite position alongside a bond allocation.
- Reader seeking taxable-account income: XLU's 2.5% yield is the highest of the three, but a Treasury ladder at 4%+ is a cleaner solution if income is the actual goal. XLU only beats Treasuries on after-tax basis in specific account types and yield-curve scenarios.
Editor's read
If the question is "VOO or one of these as a long-term core position," the answer is VOO — by cost, by regime coverage, by capacity, and by realized return. The interesting question is whether IFRA earns a satellite slot, and the honest answer is: maybe, on the basis of the drawdown evidence, sized small and underwritten on its own merits rather than as an AI proxy. The editor does not hold either XLU or IFRA at the time of writing; VOO is a core position.
Methodology: Return and risk metrics computed from yfinance daily adjusted close, total-return basis, window 2021-05-17 to 2026-05-17. Expense ratio, AUM, and inception from issuer fact sheets pulled 2026-05-17. Macro data from FRED, as-of dates 2026-04-01 (Fed Funds, CPI) and 2026-05-14 (10Y Treasury, VIX). 10Y CAGR for IFRA omitted because the fund's inception (2018-04) is inside the 10Y window.
This article is for educational purposes and does not constitute personalized financial advice. See Disclaimer.