
Photo by Bozhin Karaivanov on Unsplash
The short version
- "Energy equities rise on conflict" is true on average but conditional on physical supply transmission — not on how loud the headlines are.
- The post-2014 shift to capital discipline is the structural reason today's large-cap integrated producers convert oil rallies into shareholder return more cleanly than the 2000s did.
- For a long-horizon investor, an energy ETF sleeve is best understood as inflation-correlated equity with above-average yield. "Energy" splits into at least three distinct subsectors that behave very differently in a shock.
The claim that energy equities rally during geopolitical conflict is one of the most repeated lines in financial commentary and one of the least carefully examined. Sometimes it holds. Sometimes it doesn't. The useful question — for a long-horizon investor rather than a headline trader — is when and why the relationship actually shows up in returns, because the answer determines whether energy belongs in a portfolio as an inflation-correlated equity sleeve or as a tactical bet on the next news cycle.
Three forces complicate the simple story. The oil price reaction to a geopolitical event depends on whether the conflict actually disrupts physical supply, not on the volume of the headlines — markets distinguish, often quickly and on average correctly, between a shipping-lane scare that leaves barrels flowing and an event that takes real production offline. Energy equities then track crude with a beta below one because of corporate hedging, fixed capex commitments, downstream margin compression, and tax. And the equity transmission itself has changed structurally since the 2014–2015 oil bust, which pushed integrated producers from production-growth incentives toward what they now call capital discipline. Each of those layers deserves an honest look. Two earlier pieces — Why Energy ETFs Rise During Geopolitical Conflicts: The 2026 Hormuz Crisis and Iran–U.S. Conflict and Oil Markets — walked through specific worked examples; this piece is the framework underneath them.
The US energy ETF landscape
The three large US-listed ways most long-horizon investors actually access energy equity sit in two subsectors. Figures below are from yfinance (price, return, volatility, and drawdown) snapshot 2026-05-16, with expense ratios, AUM, and trailing yields cross-checked against each issuer's most recent fact sheet.
| Ticker | Exposure | ER | AUM | Yield | 5Y CAGR | 10Y CAGR | 5Y vol | Max DD (5Y) | Fact sheet |
|---|---|---|---|---|---|---|---|---|---|
| XLE | S&P 500 energy (large-cap integrated + E&P) | 0.08% | $41.4B | 2.5% | 22.3% | 10.7% | 26.1% | -26.0% | SPDR XLE |
| VDE | Broad US energy (MSCI US IMI Energy 25/50) | 0.09% | $12.7B | 2.3% | 22.6% | 10.3% | 26.5% | -26.6% | Vanguard VDE |
| AMLP | US midstream MLPs (Alerian MLP Infrastructure) | 1.01% | $12.6B | 7.4% | 19.1% | 7.9% | 20.0% | -20.9% | ALPS AMLP |
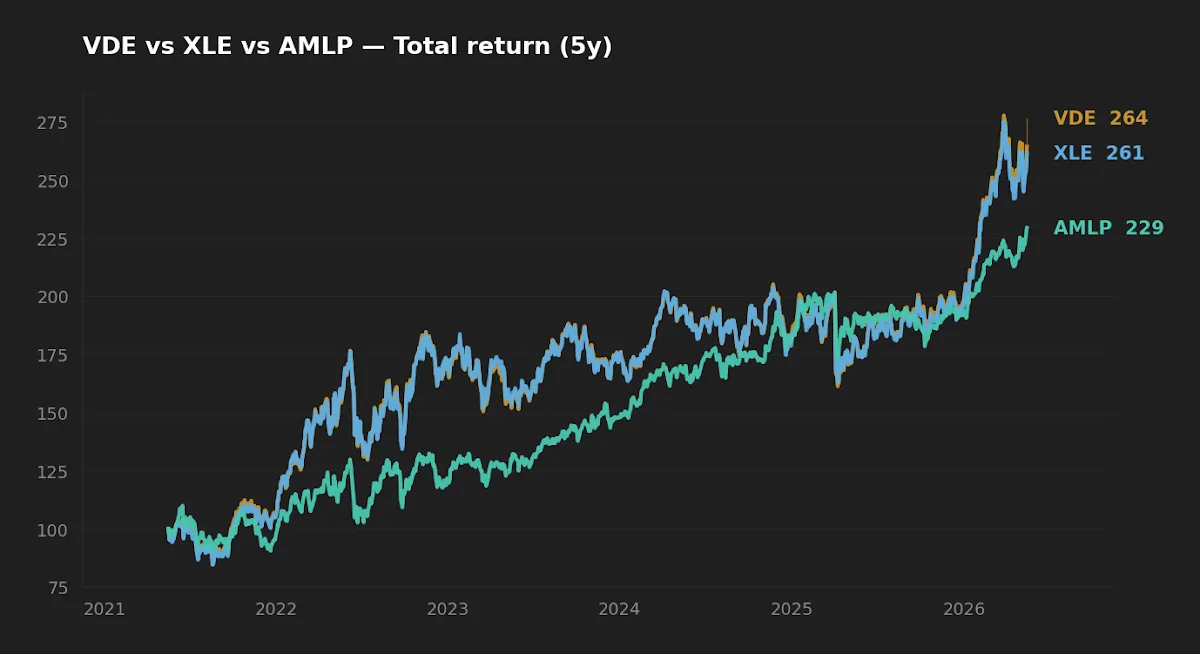
The XLE-versus-VDE choice is essentially a wash on cost (0.08% vs 0.09%) and on five-year delivered return (22.3% vs 22.6% CAGR); they are near-substitutes for most allocation purposes, as XLE vs. VDE examined more closely. AMLP is the interesting outlier in the table. The 92 basis-point fee gap relative to VDE is not a small detail: over a 30-year hold, that differential alone compounds to roughly a 24% drag on terminal value at an 8% gross return, before considering AMLP's higher tax-cost ratio from its MLP pass-through structure (corporate-level tax on the C-corp wrapper, plus K-1 complications outside this fund-of-MLPs wrapper). The headline 7.4% distribution must be evaluated against that cost, not in isolation.
What "rises in conflict" actually means empirically
The Kilian (2009) decomposition of oil shocks remains the most useful framework. Kilian splits crude moves into three components: supply-driven (a producer goes offline), aggregate demand-driven (global growth surprises up or down), and oil-specific demand-driven (precautionary buying ahead of expected disruption). Each has a different implication for energy equities.
Supply shocks — the kind most people picture when they hear "war and oil" — are unambiguously good for incumbent producers' equity. Their barrels now sell at a higher post-shock spot, and they do not bear the supply loss that drove the price up. Aggregate demand booms are good for the sector but inside a broader rally. Demand collapses, like early 2020, are catastrophic even when crude eventually recovers, because debt-burdened producers cannot survive the cash-flow gap. Precautionary spikes — the geopolitical headline trade — are the most ambiguous: they often reverse within weeks if the feared disruption fails to materialize.
The 2022 invasion of Ukraine was a textbook supply-component shock for European gas and a partial supply-component shock for crude; the S&P 500 energy sector returned roughly 60% that calendar year. The 2020 pandemic was a textbook aggregate-demand collapse; the same sector lost roughly 34%. The lesson is not that energy stocks rise during conflict — it is that they rise when conflict translates to lost barrels, and not otherwise.
The line "energy stocks rise on conflict" is true on average and false in detail. What actually rises is the share price of producers whose oil now sells at a higher post-shock spot — and only when the supply transmission is real.
Capital discipline changed the transmission
The structural reason today's integrated and large-cap E&P equities are a more honest oil proxy than in 2007 is the post-2014 capital discipline shift. Before the 2014–2015 bust, managers were rewarded for production growth; cash from rising prices got plowed back into rigs; capex outpaced cash flow; shareholders saw weak per-share metrics even when oil was at $100. After the bust, surviving managers — prodded by activist investors and more demanding boards — rebuilt the model around free cash flow and shareholder distributions.
The empirical signature shows up in payout ratios, debt-to-EBITDA, and the response of share count to oil prices. Where a 2007 oil rally produced share-count growth (issuance to fund drilling), a 2022 oil rally produced share-count shrinkage (buybacks). For a long-horizon shareholder this is the single most important change in the sector since the late 1990s — and it is the structural reason the 5Y CAGR figures for XLE and VDE sit above 22% rather than tracking what would in earlier cycles have been a price-only oil move with most of the equity benefit getting diluted away.
The condition still matters. Capital discipline holds while oil sits above producers' all-in sustaining cost — call it $50–60/bbl for most US shale, lower for integrated majors with offshore and Middle East assets. If crude breaks below that band for an extended period, the discipline narrative will be tested. Dividends are usually the last thing cut, but they are not unconditionally safe; 2020 is recent enough to remember.
Three subsectors, three different trades — and what realized risk looks like
Treating "energy" as one bucket obscures the actual decisions. The funds in the table sit in two equity subsectors with quite different drivers, and the realized risk profile makes that visible.
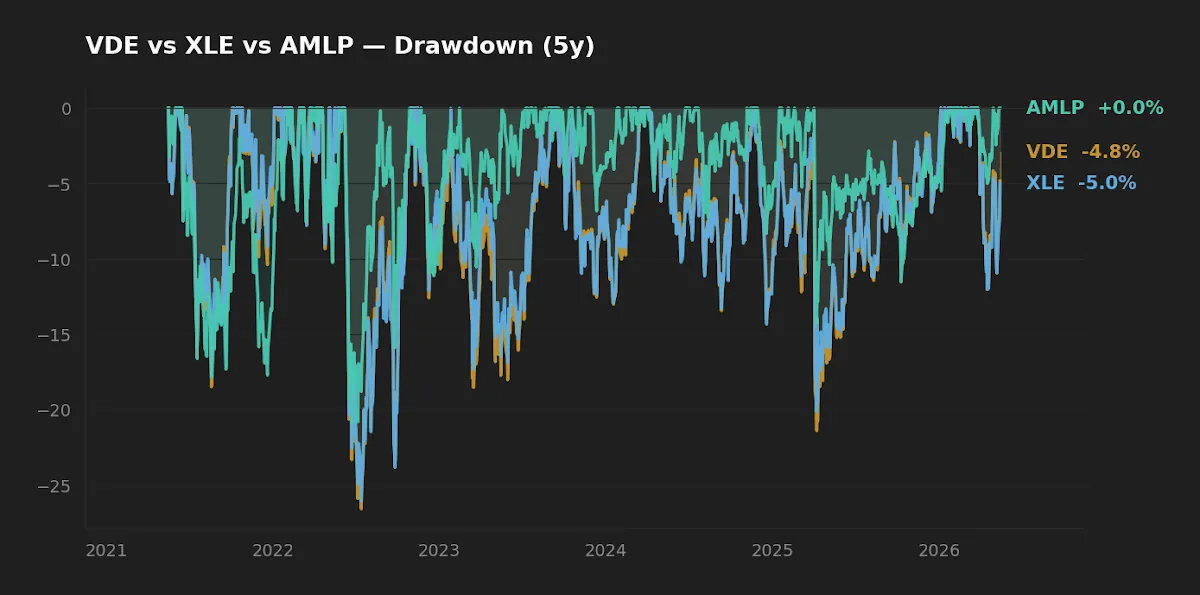
Large-cap integrated and broad E&P (XLE, VDE). The most direct expression of the capital-discipline equity thesis. XLE concentrates in the S&P 500's largest integrateds — the top two holdings typically run around 40% of the fund. VDE casts a wider net into mid-cap E&Ps. Realized five-year volatility runs around 26% and the worst drawdown around -26% for both — meaningful, but on the order of a single bad equity year, not a regime-defining loss. The 10-year CAGR sits near 10–11% for both, broadly in line with the S&P 500's long-run figure; the sector is not a structural underperformer over a full cycle.
Midstream (AMLP). Pipeline operators charge fee-based tolls, not spot prices. Their exposure to a geopolitical price spike is indirect and modest — what they care about is throughput volume. They behave more like rate-sensitive utility equity than oil-sensitive equity, which is why AMLP's five-year vol of 20.0% sits below the integrated producers despite the headline-grabbing 7.4% yield. With the 10-year Treasury at 4.47% (FRED, 2026-05-14) and CPI YoY at 3.9% (FRED, 2026-04-01), that 7.4% yield represents roughly a 290 bp spread to Treasuries — a defensible-but-not-generous level once the 1.01% fee and pass-through tax leakage are accounted for. This is not a "rises in conflict" instrument.
Beyond US equity producers. Two other buckets get asked about: global clean energy equity (rate-sensitive, long-duration, often inversely linked to an oil-shock-driven rate move) and commodity-linked futures vehicles (subject to contango decay, structurally poor long-run total return regardless of spot). Both can be useful in tactical contexts; neither is the same instrument as an integrated-producer equity ETF, and neither serves the inflation-correlation role examined here. For investors thinking about the transition side, 2026 energy policies and your long-term portfolio covers that lane more directly.
What this means for long-horizon allocation
The framing that survives all of the above is that an energy equity sleeve is best understood as inflation-correlated equity with above-average dividend yield — not a tactical headline trade. The conditional benefit during a supply shock is real, but it is not the reason to own the sector; it is a side benefit of holding a group of companies whose underlying economics are levered to commodity prices.
Sizing follows from that. Most long-horizon allocations already carry energy through broad-market index exposure — VOO or VTI gives an investor roughly 4–5% energy at S&P 500 weights, a global index slightly less. An additional satellite tilt is reasonable for an investor with a specific inflation-correlation thesis, but a large overweight (10%+ of equity) is hard to justify on diversification grounds alone given the sector's idiosyncratic political and ESG risks. Discipline matters more than the entry point: When to Stop Investing covers the rebalancing posture this conclusion implies.
At-a-glance scoreboard
| Category | XLE | VDE | AMLP |
|---|---|---|---|
| Cost | Winner (0.08%) | Near-tie (0.09%) | Loser (1.01%) |
| Realized 5Y return | 22.3% | Winner (22.6%) | 19.1% |
| Realized 5Y risk (lower is better) | 26.1% vol / -26.0% DD | 26.5% vol / -26.6% DD | Winner (20.0% / -20.9%) |
| Income | 2.5% | 2.3% | Winner (7.4%, with caveats) |
| Suitability as long-term core energy sleeve | Winner | Winner (near-substitute) | Income satellite at most |
FAQ
Q: Do energy stocks always rise when there's a war?
No. They rise on average when the conflict translates to lost barrels — a real supply disruption — and they can fall during conflicts that do not disrupt supply, particularly if the event triggers a broader risk-off move. The Kilian decomposition is the cleanest way to think about which case applies.
Q: Should I time energy exposure around geopolitical news?
Most retail attempts to do this lose to a static allocation. Headlines move faster than positioning, the supply-versus-precautionary distinction is hard to call in real time, and the trade frequently reverses within weeks. A constant tilt sized for long-horizon inflation correlation is more defensible than tactical entry.
Q: Is AMLP's 7.4% yield as attractive as it looks?
Headline yes, after-friction less so. Against a 10-year Treasury at 4.47% (FRED, 2026-05-14), the spread is roughly 290 bp; the 1.01% expense ratio compresses that, and corporate-level tax inside the C-corp wrapper plus higher ordinary-income character on distributions creates an additional tax-cost ratio drag. For taxable accounts in middle-to-upper brackets, a broad dividend ETF or even Treasuries may deliver a similar after-tax yield with less concentration risk.
Q: How does the 2026 inflation environment affect this thesis?
April 2026 CPI YoY of 3.9% (FRED, 2026-04-01) sits well above the Fed's 2% target but below the 2022 peak. The case for energy as an inflation-correlated equity sleeve is therefore moderate to firm. With the 10-year at 4.47%, the opportunity cost of holding lower-yielding equity exposure is also higher than during the zero-rate decade, which slightly raises the bar for sector overweights.
Q: Why does VDE marginally outperform XLE over five years if they're "near-substitutes"?
VDE's broader index includes more mid-cap E&P names that benefited disproportionately from the 2020–2022 oil rally. Over the 10-year window the relationship reverses (10.7% for XLE vs 10.3% for VDE), which is roughly what one would expect when a single-regime tailwind for smaller producers fades. For practical purposes the two are interchangeable; cost should not be the deciding factor at a 1 bp gap.
What this analysis can and can't tell you
The framework above is descriptive — it summarizes how the sector has behaved in recent shocks under capital-discipline-era management. It is not a forecast. The post-2014 transmission has not been tested by a sustained sub-$50 crude regime; the five-year window in the data table sits inside an unusually favorable period for traditional energy (the 2020 trough into the 2022 rally lifts the CAGR for XLE and VDE substantially); the sample of major geopolitical events in the 2020s is small; and the sector's policy environment, ESG capital flows, and refining capacity are all in slow flux. A reader who treats "energy rises in conflict" as a rule rather than a conditional should expect occasional surprises.
Scenarios where each fund fits
- Investor already overweight US large-cap via VOO/VTI: energy already represented at ~5%; an additional XLE or VDE tilt only makes sense alongside a stated inflation-correlation thesis, and a small (2–5% of equity) tilt is usually enough to matter without concentrating risk.
- Income-focused taxable account: AMLP's 7.4% distribution is attractive on the headline, but the 1.01% expense ratio and MLP pass-through tax treatment materially complicate it; for many readers a broad dividend ETF is the better expression of the same income goal.
- Investor wanting "the sector" without choosing a sub-bet: VDE is the more diversified expression by name count; XLE is the cleaner capital-discipline play. Either is defensible. Both are dominated as a single choice by the 92 bp fee differential against AMLP if cost is the deciding criterion.
- Tax-deferred retirement account: the AMLP fund-of-MLPs wrapper avoids the K-1 issue that direct MLP ownership creates in IRAs, but the C-corp tax drag inside the wrapper is real; the broad equity ETFs are simpler.
Editor's read
If forced to pick a structural energy posture, the editor leans toward broad index exposure (XLE or VDE at the core, near-substitutes on cost and realized return), sized within the inflation-correlated-equity bucket rather than as a tactical sleeve. AMLP is interesting as an income substitute when the term premium is generous, but it remains a rate trade more than an energy trade — and the 92 bp fee gap is unforgiving over decades. Active timing around geopolitical headlines has a poor track record relative to a constant tilt; calmer to set the weight once and rebalance with discipline.
The editor holds broad-market US and global index exposure that includes energy at index weights; the editor does not currently hold a targeted active energy ETF position at the time of writing.
Key takeaways
- Conflict-driven energy equity returns depend on real physical supply transmission, not headline volume — the Kilian (2009) decomposition is the framework that survives the empirical record.
- Capital discipline since 2014–2015 is the structural reason today's integrated producers convert oil rallies into per-share returns more cleanly than in the 2000s; XLE and VDE both posted 5Y CAGRs above 22% inside that regime.
- XLE (0.08% ER, $41.4B AUM) and VDE (0.09% ER, $12.7B AUM) are near-substitutes; cost differences are negligible and 10Y CAGRs are within 40 bp of each other.
- AMLP's 7.4% headline yield must be evaluated against a 1.01% expense ratio and meaningful tax-cost-ratio friction; the 92 bp fee gap to VDE compounds to roughly a 24% drag on terminal value over 30 years at an 8% gross return.
- For long-horizon investors, energy is best framed as inflation-correlated equity with above-average yield — a satellite tilt of 2–5% of equity is usually enough to matter without concentrating idiosyncratic policy risk.
Methodology
Price, return, volatility, and drawdown figures are computed from yfinance daily data, snapshot 2026-05-16. Expense ratios, AUM, and trailing dividend yields are from each issuer's most recent fact sheet linked inline in the data table. Macro figures (10-year Treasury, federal funds rate, CPI YoY) are from FRED as of the dates noted inline. Frameworks cited: Kilian (2009) on oil-shock decomposition; Caldara & Iacoviello (2018, 2022) on the Geopolitical Risk index. The five-year window includes the 2020 trough and 2022 rally — a favorable regime for traditional energy producers — and readers should weight 5Y CAGR figures accordingly; the 10Y window is a more sober reference.
This article is for educational purposes and does not constitute personalized financial advice. See the full Disclaimer.