
Photo by Brett Jordan on Unsplash
The short version
- XLE and VDE delivered nearly identical 5-year CAGR (22.3% vs 22.6%) at nearly identical volatility — the diversification VDE offers on paper barely registers in realized data.
- Both ETFs are essentially oil-price proxies; the concentration gap (XLE's top two names ~40% vs VDE's broader basket) explains less of the variance than most analyses assume.
- For a long-horizon satellite sleeve, the choice between them is mostly about fee preference and brokerage habit — not risk-adjusted return.
The Energy Select Sector SPDR (XLE) and the Vanguard Energy ETF (VDE) are the two largest US-listed energy sector funds, with combined assets above $54B. They share an obvious resemblance — same sector, near-identical fees, the same handful of names anchoring the top of the basket. The interesting question is whether the construction differences translate into anything investors can actually feel over a multi-year horizon.
The short answer, from a five-year window ending May 2026: not really. The longer answer is more useful, and it has implications for how to think about sector ETFs more generally.
Context: what each fund actually owns
XLE (inception December 1998) tracks the Energy Select Sector Index — a subset of S&P 500 energy stocks weighted by float-adjusted market cap, with a 25% single-issuer cap. The result is a fund that lives and dies on the integrated majors: Exxon Mobil and Chevron together typically represent 35–45% of assets, with roughly 22–25 holdings in total.
VDE (inception October 2004) tracks the MSCI US Investable Market Energy 25/50 Index. The "investable market" mandate pulls in mid- and small-cap exploration and production names that XLE excludes, taking the holding count past 100. The same two majors still anchor the top of the portfolio, but at lower concentration. On paper this is the more diversified vehicle.
The macro backdrop matters too. The 10-year Treasury sits at 4.47%, CPI year-over-year at 3.9%, and the VIX at 17.26 (FRED, asof 2026-05-14 and 2026-04-01) — a regime where energy's role in a portfolio is less about geopolitical theater and more about whether real cash flows can keep pace with persistent inflation.
The data side-by-side
| Field | XLE | VDE |
|---|---|---|
| Issuer | State Street (SSGA) | Vanguard |
| Inception | 1998-12-16 | 2004-10-07 |
| Expense ratio | 0.08% | 0.09% |
| AUM | $41.4B | $12.7B |
| Dividend yield (TTM) | 2.5% | 2.3% |
| 5Y CAGR | 22.3% | 22.6% |
| 10Y CAGR | 10.7% | 10.3% |
| 5Y annualized vol | 26.1% | 26.5% |
| 5Y max drawdown | -26.0% | -26.6% |
| Holdings count (approx.) | ~22 | ~110 |
Sources: SSGA fact sheet for XLE; Vanguard fact sheet for VDE; price and return series from yfinance, window 2021-05-17 to 2026-05-17.
Construction differences — and why they matter less than they should
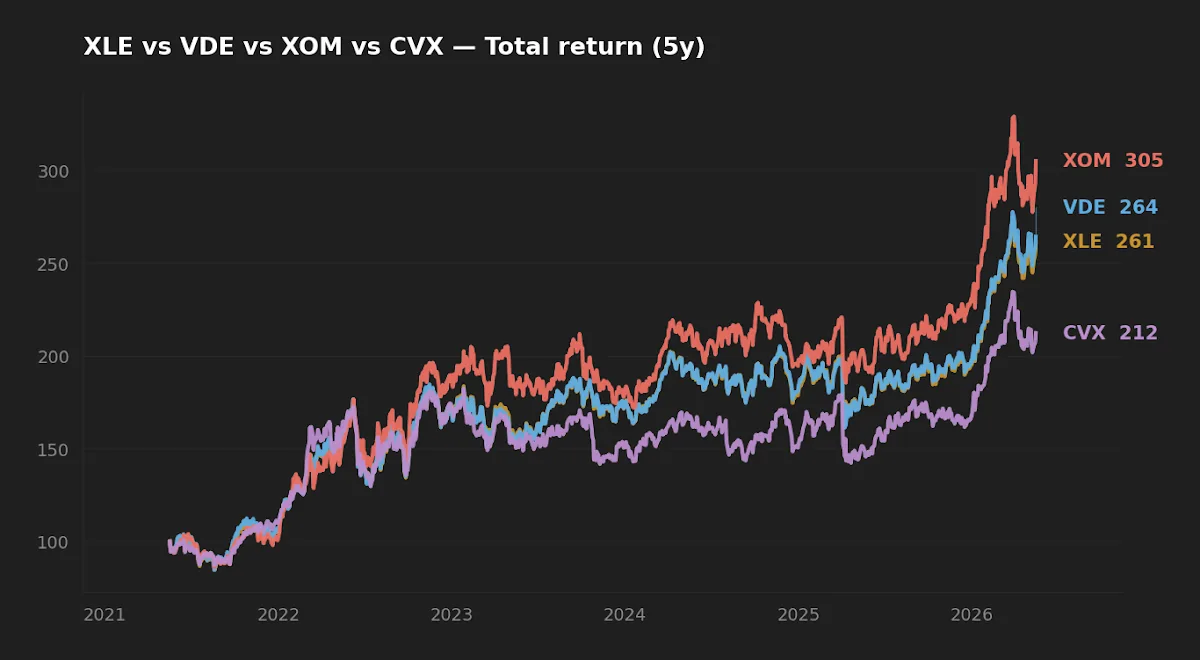
Consider what the data shows. Over a five-year window that includes the 2020 oil-price collapse aftermath, the 2022 inflation spike, and the geopolitical premium of 2024–2026, XLE returned 22.3% annualized and VDE returned 22.6%. Realized vol was 26.1% versus 26.5%. Maximum drawdown — the worst peak-to-trough loss inside the window — registered -26.0% for XLE and -26.6% for VDE. The differences sit inside the noise.
This is the non-obvious result. If you were told in advance that one fund concentrates roughly 40% of assets in two stocks and the other spreads across 100+, you would expect a meaningful gap in idiosyncratic risk. That gap doesn't show up — because energy sector returns are dominated by oil-price beta, not firm-level alpha. The smaller exploration-and-production names that VDE picks up are themselves levered to the same WTI and Brent prices that drive Exxon and Chevron. Diversifying across them doesn't diversify the underlying factor.
This point generalizes. Sector ETFs that look "more diversified" because they hold more names often aren't, in factor terms. The relevant question for risk decomposition isn't "how many holdings" but "how many independent return drivers." For US energy in this window, the answer was effectively one: the price of oil.
Realized risk: drawdown duration as much as drawdown depth
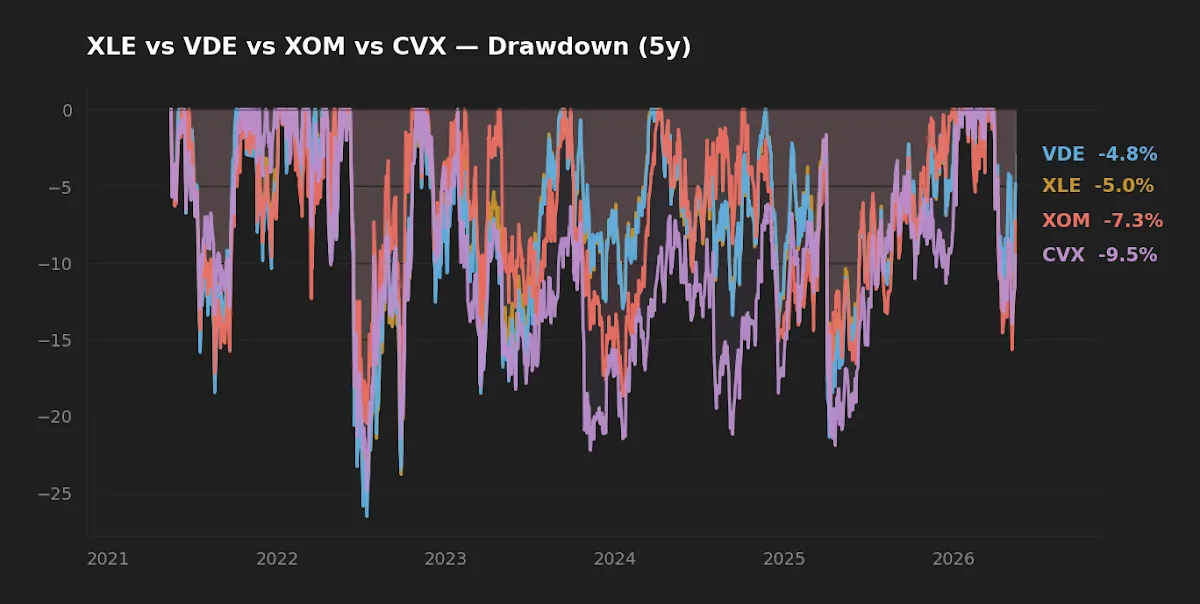
The drawdown chart shows what the summary statistics flatten. Both ETFs hit their five-year peak-to-trough lows during the same stress window, and both spent comparable time underwater. XLE's path is marginally smoother on the way down — concentration in Exxon and Chevron, both with strong balance sheets and disciplined capital allocation, acts as a partial cushion. VDE's broader basket includes smaller E&P names with thinner cash buffers, so the recovery from the bottom is slightly more dispersed.
For a long-horizon allocator, the salient point is drawdown duration. A 26% drawdown that recovers in eight months and a 26% drawdown that recovers in eighteen months are not the same risk, even if the headline number is identical. The 2021–2026 window happens to be a period in which energy recovered relatively fast. A different window — 2014–2020, say — would have produced very different patience requirements. Single-regime evidence is the meta-limitation of any five-year backtest, and the data here cannot tell you what the next regime will demand.
Single-stock alternatives: what XOM and CVX show
For investors considering whether to skip the ETF wrapper and just hold the two majors directly, the data offers a useful comparison. Exxon Mobil's 5-year CAGR was 26.0% with max drawdown of -20.5%; Chevron's was 17.1% with drawdown -24.9%. Dividend yields sit at 2.7% (XOM) and 3.7% (CVX) versus 2.5% (XLE) and 2.3% (VDE).
The single-stock route trades the diversification of the basket for wider dispersion of outcomes. Exxon happened to beat both ETFs on return and drawdown over this specific window. That is history, not a forecast — and it conceals the second-order point that holding individual stocks reintroduces decisions the ETF wrapper smooths over: rebalancing between the two majors, dividend reinvestment cadence, and the behavior risk of staring at a single ticker through a regional refining outage or an SEC inquiry. The realized advantage of the single-stock path is real but contingent on which name and which window.
Sector ETFs that look "more diversified" because they hold more names often aren't, in factor terms. The relevant question isn't holdings count — it's how many independent return drivers sit underneath.
The macro backdrop a five-year window won't show
Energy's role inside a long-horizon portfolio depends on the regime question, not the ticker question. With CPI running at 3.9% year-over-year and the 10-year Treasury at 4.47%, real yields are positive but thin. Energy equities have historically delivered real returns when commodity prices outpace headline inflation — but the link is loose, with correlations that drift across cycles and depend heavily on the marginal cost curve and the path of the energy transition.
The academic literature on factor investing (Fama and French 2015; Asness, Frazzini, and Pedersen 2019) has consistently found that sector concentration alone does not earn a reliable premium. What looks like a "sector tilt" toward energy is, in factor terms, mostly an exposure to value, plus a partial exposure to commodity beta. Investors choosing between XLE and VDE are not picking between factor exposures — they are picking between two slightly different vehicles for the same underlying bet.
| Category | Winner | Why |
|---|---|---|
| Cost | XLE (0.08%) | 1 bp gap. Real but trivial over decades. |
| Realized risk (5Y) | XLE (narrowly) | Marginally lower vol and shallower drawdown. |
| Realized return (5Y) | VDE (narrowly) | 30 bp annual CAGR edge. Inside noise. |
| Paper diversification | VDE | ~110 holdings vs ~22. |
| Suitability as long-term satellite | Either | Choose by broker and issuer preference. |
FAQ
Is XLE or VDE better for a long-term portfolio?
Over the five-year window analyzed, realized return and risk are statistically indistinguishable. The decision should rest on the 1 bp fee preference, brokerage commission structure, and personal preference between SSGA and Vanguard as issuers. There is no defensible quantitative case that one materially outperforms the other on a risk-adjusted basis.
Does VDE's broader diversification actually reduce risk?
Marginally and inconsistently. Holding 110+ names instead of 22 does not diversify away the common factor — oil-price exposure — that drives the bulk of energy sector returns. The realized 5-year vol gap between the two funds was 40 bp, well inside measurement noise.
How much should energy be in a portfolio?
The S&P 500 energy weight as of mid-2026 sits around 4%. A market-weighted exposure already gives an investor that allocation through any broad index fund. A satellite tilt above market weight is an active bet that requires a thesis. Without one, the default answer is whatever the index already provides.
Why not just hold Exxon and Chevron directly?
Over the past five years, XOM outperformed both ETFs and CVX paid a higher yield. But single-stock outcomes have wider dispersion than baskets, and the historical edge is not a forecast. The ETF wrapper costs 8–9 bp and removes rebalancing decisions and concentrated idiosyncratic risk.
How does energy correlate with inflation?
The historical correlation between energy equities and headline CPI is positive but unstable — typically around 0.3 to 0.5 on rolling windows, with strong regime dependence. Energy is sometimes a useful inflation hedge and sometimes not; the relationship breaks down when supply disruptions and demand shocks move in opposite directions, as they did in 2020.
What this comparison can and can't tell you
The window is five years. It includes one major dislocation (the post-2020 oil recovery) and the inflation regime that followed, but it excludes the prolonged 2014–2020 bear in energy. A backtest that includes the earlier window would show drawdowns of 50%+ and recovery periods measured in years, not months. The 22% CAGR you see here is partly a function of starting near a regime low. The data also cannot tell you what oil prices will do, what the global energy transition path looks like over a 20-year horizon, or how stranded-asset risk should be discounted into terminal value. Those are the variables that matter for a true long-horizon position.
Scenarios where each fund fits
Reader holding broad US index funds, no current sector tilt: Either ETF works as a 3–7% satellite. The marginal decision is brokerage cost; Vanguard customers typically default to VDE for ecosystem reasons, while SSGA-aligned platforms favor XLE.
Reader already holding XOM or CVX as individual positions: Adding XLE roughly doubles existing concentration in the two majors. VDE's broader basket adds genuine breadth on top of the single-stock holdings.
Reader specifically seeking inflation protection: Both ETFs offer similar exposure. A broader commodities approach (energy plus materials plus TIPS) typically matches inflation better than a pure-energy tilt, since energy carries equity-level drawdown risk that TIPS do not.
Editor's read
If forced to choose, the editor leans toward VDE — not on return, which is indistinguishable, but because the broader holding count provides a small hedge against governance or accounting risk at a single dominant name. The 1 bp fee penalty is meaningless next to the optionality of holding 110+ E&P firms rather than effectively two. That said, this is a sleeve-level decision, not a core one. Energy as a long-horizon satellite belongs at market weight or modestly above, sized so the inevitable 50%+ drawdown — which a five-year window doesn't show — doesn't damage portfolio behavior.
The editor does not currently hold XLE, VDE, XOM, or CVX as individual positions; exposure to US energy is via broad index funds at market weight.
Related reading: an earlier note on how energy ETFs behave during oil shocks · a 2026 rotation playbook for long-term ETF portfolios · how the Strait of Hormuz frames oil-price tail risk.
Methodology: Total-return series pulled from yfinance for the window 2021-05-17 to 2026-05-17. CAGR computed as the compound annual growth rate on total return; volatility as the annualized standard deviation of daily log returns; maximum drawdown as the worst peak-to-trough loss inside the window. Expense ratios, AUM, and trailing-twelve-month yields from issuer fact sheets (SSGA, Vanguard), retrieved 2026-05-17. Macro indicators from FRED, retrieved 2026-05-16.
This article is for educational purposes and does not constitute personalized financial advice. See full Disclaimer.