
Photo by Vitaly Gariev on Unsplash
The short version
- SCHD, AVUV, and VXUS occupy three different rows of the factor matrix — quality-dividend, small-cap value, and international beta. The realized data confirms they diversify each other rather than substitute for one another.
- Across the five-year window through 2026-05-17, SCHD posted the lowest realized volatility (14.4%) and the shallowest max drawdown (-16.8%). AVUV delivered the highest five-year CAGR (10.8%) at 22.8% volatility. VXUS sat in the middle on return but suffered the deepest drawdown (-29.4%).
- With the 10-year Treasury at 4.47% (FRED, asof 2026-05-14), SCHD's 3.3% yield is no longer an income story bonds can't match. The case for SCHD now rests on its cash-flow-quality screen, not on the headline yield.
Geopolitical headlines force a useful question: which sleeves of an equity portfolio are doing the work, and which are along for the ride? The Iran–U.S. tension that lifted crude and pushed the 10-year Treasury yield higher is a tractable case study, because three distinct factor exposures — quality dividends (SCHD), US small-cap value (AVUV), and broad international equity (VXUS) — sit on different sides of the macro variables that move during a shock.
This piece compares the three using five-year realized data through 2026-05-17, with ten-year context where available. The argument is structural rather than directional: the question isn't which fund "wins" a particular crisis, but how their realized risk and return profiles compose into a long-horizon allocation.
For context: SCHD tracks the Dow Jones U.S. Dividend 100 Index — large-cap US companies screened on cash flow / total debt, return on equity, dividend yield, and five-year dividend growth. AVUV is the Avantis US Small Cap Value ETF — a rules-based active fund tilting hard into small, cheap, profitable companies, run by a team with DFA roots. VXUS holds roughly 8,500 non-US stocks across developed and emerging markets at a 0.05% expense ratio that is structurally hard to beat.
Reference data (yfinance, fetched 2026-05-17)
| Field | SCHD | AVUV | VXUS |
|---|---|---|---|
| Issuer | Schwab | Avantis | Vanguard |
| Inception | 2011-10-20 | 2019-09-24 | 2010-11-29 |
| Expense ratio | 0.06% | 0.25% | 0.05% |
| AUM | $91.1B | $26.2B | $629.1B (fund total) |
| Dividend yield (TTM) | 3.3% | 1.3% | 2.8% |
| 5Y CAGR | 8.2% | 10.8% | 8.5% |
| 10Y CAGR | 12.7% | n/a (<10Y history) | 9.7% |
| Realized vol (5Y, ann.) | 14.4% | 22.8% | 16.0% |
| Max drawdown (5Y) | -16.8% | -28.8% | -29.4% |
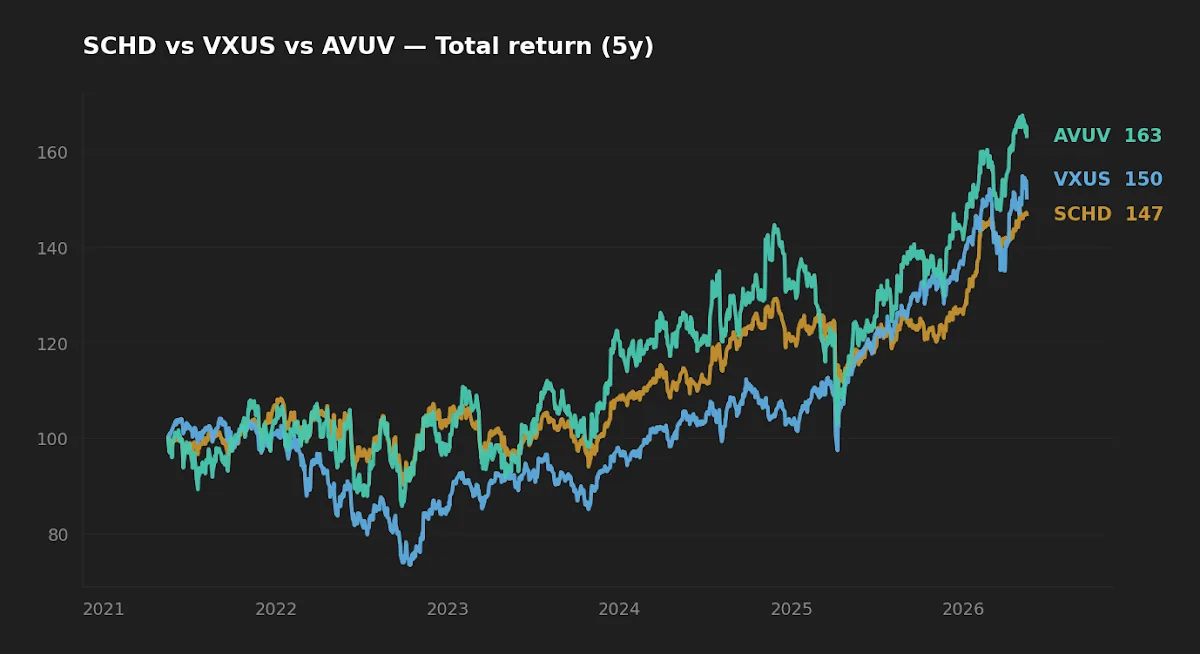
How each fund captures a different equity risk
The simplest mental model: SCHD pays for a quality screen, AVUV pays for compensated factor exposure, VXUS pays for diversification away from the US dollar.
SCHD's screen is mechanical. Companies must have ten consecutive years of dividend payments, then are ranked on cash flow / total debt, ROE, dividend yield, and five-year dividend growth. The top 100 by composite score, weighted by modified market cap, become the index. The output is a portfolio that systematically owns mature, cash-generative businesses — historically tilted toward financials, healthcare, consumer staples, and industrials, with limited mega-cap technology. That underweight to high-multiple growth is why SCHD's realized volatility (14.4%) and max drawdown (-16.8%) sit below the broad market across this window.
AVUV is the opposite trade. Small-cap value has been one of the most-documented sources of premium return in the literature — Fama and French (1992, 1993) on size and book-to-market, with the profitability factor added by Novy-Marx (2013) and incorporated into the Fama–French five-factor model (2015). AVUV's portfolio construction sits squarely in that tradition: small, cheap, and profitable. The 22.8% realized volatility and -28.8% max drawdown are the cost of taking that exposure. The 10.8% five-year CAGR is the realized payment for taking it.
VXUS does something neither US fund does: it removes the country factor. A US-only portfolio implicitly bets on the US to keep outperforming. VXUS is the simplest way to take the other side of that bet at scale, and at 0.05% it's roughly free. The cost is that international equity has traded at lower P/E multiples for reasons that may be structural — sector composition, governance, currency — rather than purely cyclical, so the long-run expected return relative to US equity is genuinely uncertain.
For deeper context on why a long-horizon core might hold all three rather than VOO alone, see Why VOO Is Not Enough: The Math Behind Adding AVUV and VXUS to Your 2026 Portfolio.
Realized drawdowns: what the five-year window actually shows
The drawdown chart visualises the peak-to-trough path of each fund through the 2021–2026 window. Two observations matter more than the headline depth.
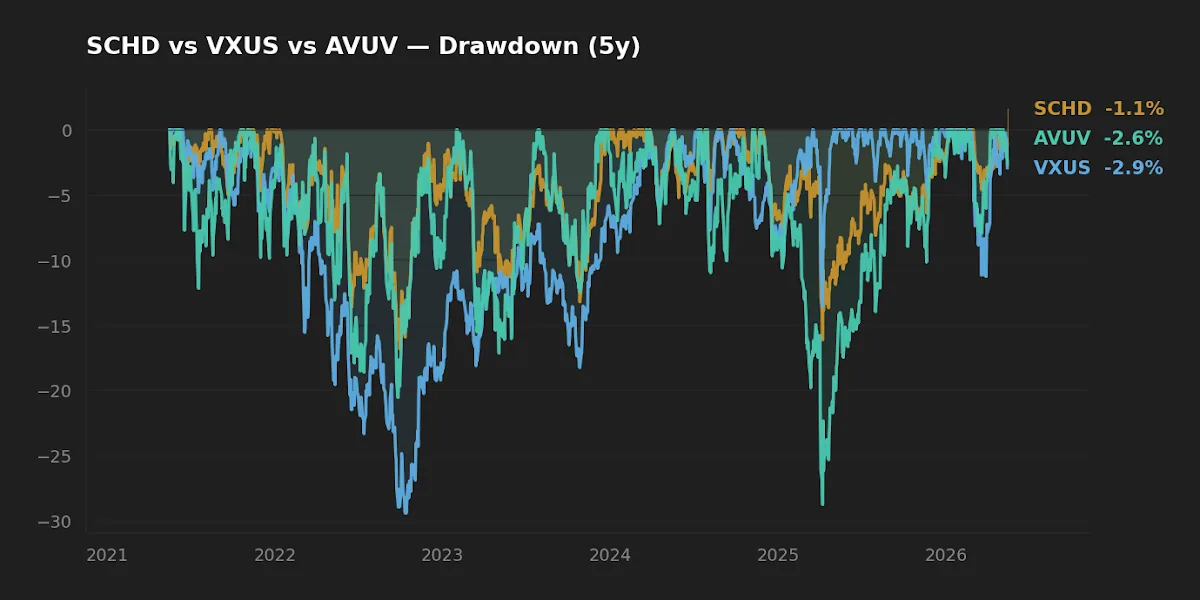
First, the drawdowns don't fully overlap in time. AVUV's worst stretch was the 2022 small-cap-value rerating into rising rates. VXUS's deepest drawdown coincided with the 2022 dollar surge and the energy-driven hit to European equity. SCHD's -16.8% trough came during the same rate-driven repricing but with less amplitude because its quality-screen sector mix carries less duration. A blended portfolio holding all three would have experienced a drawdown well below the worst of any single sleeve — which is the operational point of diversification.
Second, drawdown duration matters as much as depth. AVUV's recovery from its 2022 trough took materially longer than SCHD's, consistent with the small-cap-value literature: realized premia are lumpy across time. An investor who can't tolerate eighteen months underwater in a sleeve should not size that sleeve as a core position. This is the practical point Sharpe (1991) made about the gap between arithmetic and geometric returns — the path matters because behavior matters.
Diversification across SCHD, AVUV, and VXUS isn't insurance against geopolitical shocks. It is insurance against being wrong about which factor will compound over the next decade.
Return data across windows, and the look-ahead problem
SCHD's ten-year CAGR (12.7%) is impressive, but it ends in 2026 and starts in 2016 — a window that contains an unusually long stretch of US large-cap dominance and benign inflation. Ten years is the standard analytical horizon, but it is one realized path drawn from the joint distribution. The literature on return forecasting (Asness, Frazzini, and Pedersen 2019; Vanguard's 2024 capital markets research) consistently warns that backward CAGRs are weak predictors of forward CAGRs at the fund level.
AVUV doesn't have a ten-year track record — it launched in September 2019. The five-year number is genuine, but the inception coincides with one of the worst small-cap-value drawdowns of the modern era (Q1 2020) followed by one of the strongest recoveries. Both episodes are inside the window, which inflates realized volatility and realized return. The honest read: AVUV's process is well-grounded in the literature, but the realized track record is still short relative to a full factor cycle. AVUV and the Case for Small-Cap Value Patience covers that horizon question in more detail.
VXUS at 9.7% over ten years has trailed US equity meaningfully — the lost-decade narrative everyone knows. But the same dataset shows international equity narrowing the gap over the last three years of the window. Whether that's mean reversion or coincidence is not knowable from five or ten years of data. For the dividend-vs-total-return half of this discussion, see SCHD vs VOO: What the Data Actually Says About Dividend Yield and Total Return.
Implementation friction: fees, dividends, and capacity
The expense ratios bracket each fund's role. SCHD at 0.06% and VXUS at 0.05% are within rounding of free. AVUV at 0.25% is over four times more expensive — the price of active management against a small-cap-value benchmark. Over thirty years that gap compounds into meaningful basis points of drag, but it is unambiguously cheap relative to traditional active small-cap-value funds.
For US-taxable accounts, dividend treatment matters. SCHD's distributions are overwhelmingly qualified dividends (taxed at long-term capital gains rates). VXUS distributions are a mix of qualified and ordinary, and the foreign-source portion typically generates a foreign tax credit that partially offsets US tax. AVUV's headline yield is only 1.3%, but as an actively-managed fund it can generate higher turnover, which affects after-tax return — its tax-cost ratio is structurally above SCHD's and VXUS's in the same account.
AUM and capacity round out the picture. VXUS sits inside a $629B share-class structure — capacity is not a concern. SCHD's $91B AUM is comfortable for an index tracker on large caps. AVUV at $26B is more interesting: small-cap value strategies have real capacity constraints because the underlying stocks are less liquid. Avantis has not closed the fund, and current size is below levels where closure has historically been considered for similar strategies, but it is a structural watch item rather than a settled question.
Geopolitical shock pathways through these three sleeves
Tying back to the headline question: when Iran–U.S. tension drives crude higher and the 10-year Treasury yield sits at 4.47% (FRED, asof 2026-05-14), each fund responds through different transmission channels.
SCHD is exposed to interest-rate-driven valuation compression on quality dividend payers, partially offset by sector weight to energy producers (which benefit when crude rises) and consumer staples (relatively insulated from energy costs through pricing power). The net effect in past shocks has been negative but muted — consistent with the -16.8% max drawdown in this window. Iran–U.S. Conflict and Oil Markets: Why the Strait of Hormuz Matters for Global Investors covers the oil-channel mechanics.
AVUV's transmission is operational rather than valuation-driven. Small-cap value firms have higher financing sensitivity than mega-caps — a yield-curve repricing flows directly into their cost of capital. The energy sub-sector inside small-cap value offsets some of this, but the net is usually negative in a rising-yield shock.
VXUS captures the energy-importer side of the trade. European and Japanese equity carry more energy import dependence than US equity, so an oil supply shock landed harder on VXUS than on US-only indices in 2022. The flip side is currency: a US-led shock that strengthens the dollar hurts VXUS in USD terms even when local-currency equity holds up. Both channels were active in 2022 and contribute to the -29.4% drawdown shown in the chart.
Scoreboard
| Category | Winner | Why |
|---|---|---|
| Cost | VXUS | 0.05% expense ratio, the lowest of the three. |
| Realized risk (5Y) | SCHD | 14.4% vol and -16.8% max drawdown, well below AVUV and VXUS. |
| Realized return (5Y) | AVUV | 10.8% CAGR vs 8.5% (VXUS) and 8.2% (SCHD). |
| Suitability as standalone core | None | Each fund is a sleeve, not a complete equity portfolio. Holding all three is the point. |
FAQ
Q: Are SCHD, AVUV, and VXUS redundant if I already hold VOO or VTI?
No. VOO/VTI is a US large-cap blend. SCHD adds a quality-and-value tilt, AVUV adds size and deep value, and VXUS adds non-US country and currency exposure. The factor overlaps with VOO are partial — meaningful, but the diversification is real.
Q: Should I weight these three equally?
That's a personal-fit question, not a data question. AVUV's realized volatility (22.8%) is roughly 60% higher than SCHD's (14.4%), so an equal-weight allocation puts disproportionate risk-budget into the small-cap-value sleeve. Many long-horizon allocations size AVUV as a 5–15% satellite rather than equal-weighting it with the core.
Q: With the 10-year Treasury at 4.47%, does SCHD's 3.3% yield still make sense?
The yield comparison is misleading. SCHD's expected return is total return — growth plus dividend — and the underlying companies grow their distributions, which is part of the index inclusion criteria. Comparing a static 3.3% yield to a 4.47% Treasury ignores the equity growth component. That said, the case for SCHD now rests more on the cash-flow-quality screen than on the headline yield.
Q: Has AVUV closed to new investors?
No. As of 2026-05-17, AVUV remains open. Small-cap-value strategies have real capacity limits because the underlying stocks are less liquid than mid- or large-caps. Avantis has not signaled an imminent closure, but capacity is a structural watch item for any small-cap fund as it grows.
Q: Why does VXUS have a deeper drawdown than SCHD or AVUV even though it's the most diversified?
Diversification reduces idiosyncratic risk but doesn't eliminate systematic risk. VXUS's deepest drawdown was driven by two systematic factors at once — an energy supply shock landing on energy-importer economies and a strong-dollar move that hit USD-denominated returns. Diversification within international equity helped; it couldn't offset shocks that hit the entire non-US complex.
What this comparison can and can't tell you
Five years of data is one realized path through a joint distribution. The window contains a pandemic crash, the 2022 inflation shock, and the start of a Fed-tightening cycle — but it does not contain a sustained 1970s-style stagflation, a prolonged deflationary regime, or a US-sovereign-credit event. AVUV's track record is too short to evaluate across a full factor cycle (small-cap value has historically underperformed for ten-plus years before reverting). VXUS's lost decade ended only recently, which is a regime observation, not a permanent state. The CAGRs cited here describe what happened. They are not forecasts.
Scenarios where each fund fits
Reader in 30s, US-only equity exposure through a 401(k) index option, taxable savings for additional ETF investing. Adding VXUS to address home-country bias is usually higher-leverage than adding either SCHD or AVUV, because the diversification benefit (different country and currency exposure) is largest when the existing allocation lacks it entirely.
Reader who already holds VOO and VXUS, no factor tilt. SCHD and AVUV are the candidates. SCHD's role is closer to a quality overlay; AVUV's is a deliberate factor tilt that increases expected return but also increases tracking error and drawdown risk relative to the benchmark.
Reader near or in retirement, drawdown sensitivity high. The realized drawdown numbers favor a heavier weight to SCHD and a smaller satellite tilt to AVUV rather than equal-weighting. VXUS's role here is regional diversification rather than yield. For the framing on cash buffers and risk reduction near retirement, see When to Stop Investing: The Art of Risk Management and Strategic Cash.
Editor's read
If forced to compose a long-term equity core using only these three, the editor would weight SCHD highest, VXUS second, and AVUV as a deliberate but smaller satellite. The reasoning is structural: SCHD's quality screen has the most stable realized risk profile across this window, and its dividend-growth criterion does some of the work that a low-volatility overlay would otherwise do. VXUS at 0.05% is the cheapest meaningful diversification available — even if international equity continues to trail US, the regret of being wrong about a permanent US premium is too asymmetric to ignore. AVUV's 10.8% five-year CAGR is real, but the 22.8% volatility means position-sizing has to allow the investor to hold through a -30% drawdown without flinching. That sizing constraint is the binding one.
Editor holdings disclosure: The editor holds SCHD, AVUV, and VXUS as components of a long-term core allocation at the time of writing.
Methodology
Price and return data via yfinance, pulled 2026-05-17. Five-year window: 2021-05-17 through 2026-05-17. Ten-year CAGR computed where ≥10 years of daily price history is available (SCHD and VXUS qualify; AVUV launched 2019-09-24 and does not). Realized volatility is annualized standard deviation of daily total returns. Max drawdown is peak-to-trough on the cumulative total-return index over the five-year window. Expense ratios, AUM, dividend yield, and inception dates from issuer fact sheets: Schwab Asset Management (SCHD), Avantis Investors (AVUV), Vanguard (VXUS). Macro context: FRED — 10-year Treasury constant maturity (DGS10), Fed Funds effective rate, VIX, and CPI YoY (CPIAUCSL) as of 2026-05-14 / 2026-04-01.
This article is for educational purposes and does not constitute personalized financial advice. See full Disclaimer.