The short version
- SGOV's effective duration near zero made it behave as designed during the recent oil-driven inflation scare — essentially flat while the equity sleeves absorbed the hit.
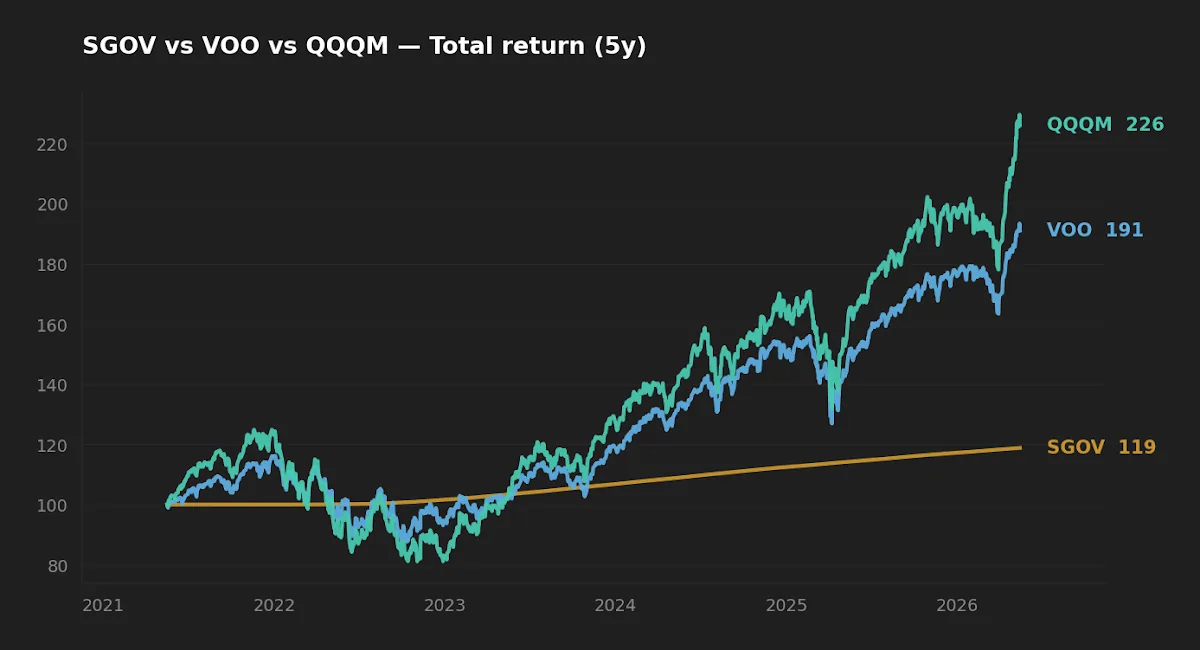
- QQQM's higher 5-year CAGR (17.6%) came with a -35.0% peak-to-trough drawdown versus VOO's -24.5%. The headline return masks the path.
- With the 10-year Treasury near 4.47% and SGOV's distribution yield around 3.94%, the cost of staying short on the curve is unusually small right now.
An Iran–U.S. escalation is the kind of event headlines compress into a single word — "shock" — and the useful question for a long-horizon investor is not whether to predict the next headline but whether the existing portfolio sleeves behave as their data history says they should. This piece looks at three sleeves an investor might actually hold side by side: SGOV (ultra-short Treasuries), VOO (broad U.S. equities), and QQQM (Nasdaq-100). The frame is structural, not predictive: what does the five-year data say each fund is for, and does the current macro regime change that read?
Context: the macro chain a geopolitical oil shock actually triggers
The reflexive answer to "war risk" is to expect a flight-to-safety bid in Treasuries. The actual transmission this cycle has been different. When the shock arrives through energy — Middle East supply, the Strait of Hormuz, shipping insurance premia — the immediate effect is an inflation repricing, not a duration rally. Yields can rise rather than fall, and long-duration equities (where most of the cash flow sits in the distant future) carry the heaviest discount-rate burden. The earlier piece on the Strait of Hormuz walks through that channel in more detail; for this article the point is that the four observable transmission lines — oil, the 10-year yield, equity multiples, and implied vol — tend to move together in oil-driven shocks rather than in the textbook "stocks down, bonds up" pattern.
The current backdrop, per FRED (asof April–May 2026): 10-year Treasury at 4.47%, fed funds at 3.64%, headline CPI YoY at 3.95%, VIX at 17.26. None of those is a panic reading, but the curve is unusually flat, real yields are firmly positive, and inflation is still meaningfully above the Fed's target. That combination makes the cost-of-cash sleeve more competitive against extension trades than it has been for most of the post-2010 era.
The data, side by side
All return and volatility figures are computed from daily total-return data via yfinance through 2026-05-18. Expense ratios, AUM, and distribution yields are cross-checked against issuer fact sheets.
| Ticker | Fund | ER | AUM | Yield | 5Y CAGR | 10Y CAGR | 5Y vol (ann.) | 5Y max DD |
|---|---|---|---|---|---|---|---|---|
| SGOV | iShares 0-3 Month Treasury Bond ETF | 0.09% | $85.2B | 3.94% | 3.5% | n/a | 0.24% | -0.03% |
| VOO | Vanguard S&P 500 ETF | 0.03% | $1,600.2B | 1.08% | 13.9% | 15.6% | 16.8% | -24.5% |
| QQQM | Invesco NASDAQ 100 ETF | 0.15% | $82.9B | 0.46% | 17.6% | n/a | 22.3% | -35.0% |
Sources: iShares SGOV fact sheet, Vanguard VOO product page, Invesco QQQM product page; price and total-return series from yfinance, fetched 2026-05-18.
SGOV: a sleeve that is supposed to be boring, and currently is
SGOV holds Treasury bills with weighted-average maturity well under three months. Its 5-year annualized volatility of 0.24% and maximum drawdown of -0.03% are not typos — the fund is engineered to move with the front of the Treasury curve and almost nothing else. In an oil-driven inflation scare that pushes long yields higher, SGOV's price barely moves because its duration is effectively zero. Bill yields reset higher, and the distribution rate follows.
The current 3.94% distribution yield is the part worth pausing on. With the 10-year Treasury at 4.47% (FRED, asof 2026-05-14), an investor extending from SGOV out to a 10-year bond is collecting roughly 53 basis points of additional yield in exchange for meaningful duration risk. Most of the last decade traded with that pickup in the 150–250 bp range. This is a flat curve, not a steep one. The implication for the cash sleeve is structural: holding SGOV is currently a low-opportunity-cost decision in a way it has not been for most of the QE era.
Worth flagging: SGOV's distribution income is taxable as ordinary income at the federal level but is generally exempt from state and local tax — a meaningful subtlety for high-state-tax investors comparing it against a taxable money market fund.
VOO: the broad earnings sleeve, and what the realized-risk record actually looks like
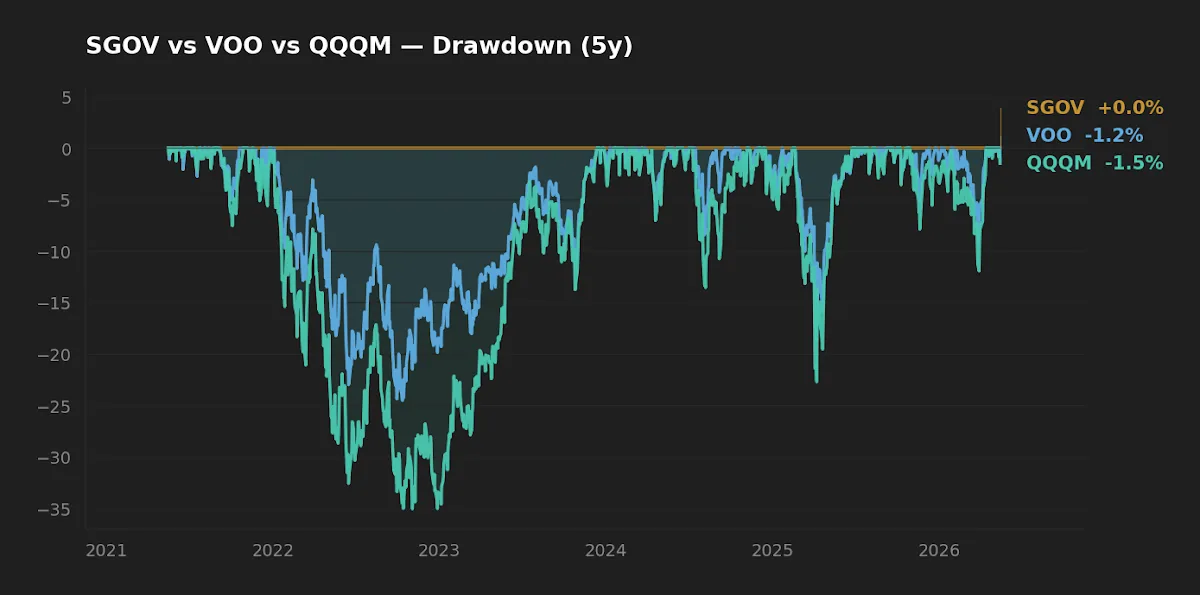
VOO's 5-year CAGR of 13.9% and 10-year CAGR of 15.6% sit comfortably above the long-run U.S. equity premium. The realized-risk side of the same window — annualized volatility of 16.8% and a maximum drawdown of -24.5% — is closer to the long-run norm than the return is. In a Sharpe-1991 sense the fund is doing exactly what it is built to do: cap-weighted exposure to U.S. corporate earnings at an expense ratio of 0.03% and tracking error within a few basis points of the S&P 500 for years.
For a geopolitical oil shock, the channel that matters for VOO is not the headline but the discount rate. When yields rise on inflation fear rather than falling on a safety bid, multiples compress; when oil retraces and the yield move unwinds, multiples snap back. The earlier piece on VOO, QQQM, and SCHD documents how that rate-channel sensitivity has shown up across the trailing five years. The structural takeaway: VOO is reasonably described as a long-duration earnings claim — less rate-sensitive than QQQM, but considerably more rate-sensitive than the headline "broad market" framing suggests.
A 5-year CAGR of 17.6% versus 13.9% is not a free 3.7 points — QQQM paid for the difference in a -35.0% drawdown that tested most investors' time horizon, not just their risk tolerance.
QQQM: higher realized return, much deeper realized drawdown
QQQM tracks the Nasdaq-100 — concentrated, growth-tilted, and currently around half technology by sector weight. The 5-year CAGR of 17.6% is the headline number; the path that produced it ran through 22.3% annualized volatility and a -35.0% peak-to-trough drawdown. Both readings are materially worse than VOO's, and the gap is not random — it reflects the factor structure. Nasdaq-100 names carry persistently higher loadings on growth and momentum and lower loadings on value, with cash flows weighted further into the future than the broad market. In rate-channel shocks like an oil-driven inflation repricing, that duration shows up as drawdown.
The non-obvious point hides in the risk-adjusted comparison. A naive ratio of CAGR to annualized volatility is roughly 0.83 for VOO and 0.79 for QQQM over the same five-year window. Once realized drawdown is taken seriously as the constraint that actually drives investor behavior — not standard deviation, but the depth of the hole — QQQM's edge in headline return is less obvious than it appears. The recovery-math piece works the arithmetic: a -35% drawdown requires a +53.8% recovery to round-trip, versus +32.5% for a -24.5% drawdown. That asymmetry is the part headline CAGRs hide.
What the realized-volatility ranking implies for sleeve sizing
The most useful framing is to treat the three funds as occupying different points on a single risk axis. SGOV at 0.24% annualized vol, VOO at 16.8%, QQQM at 22.3% — the ratio is roughly 1 : 70 : 93. Holding a 5% sleeve in SGOV is not meaningfully equivalent in risk terms to holding 5% in QQQM; the equity sleeves dominate portfolio variance almost regardless of weighting between them. Daryanani's 2008 work on opportunistic rebalancing and Vanguard's 2024 follow-up both find that bands set on portfolio weight (±15% or ±25% relative to target) discipline this behavior without over-trading. The sleeve weights matter; the rebalancing discipline matters more.
Scoreboard
| Category | Winner | Why |
|---|---|---|
| Cost | VOO (0.03%) | Lowest expense ratio; SGOV 0.09%, QQQM 0.15%. |
| Realized risk (5Y) | SGOV | 0.24% annualized vol; -0.03% max drawdown. |
| Realized return (5Y) | QQQM | 17.6% CAGR — but with the deepest drawdown. |
| Suitability as long-term core | VOO | Broadest diversification, lowest cost, most data history. |
FAQ
Is SGOV a substitute for a money market fund? Functionally close, with the trade-off that SGOV's NAV fluctuates by small amounts between distributions while a money market fund targets a constant $1 NAV. SGOV's distributions are generally state-tax-exempt; many taxable money market funds are not. The 30-day SEC yield is the right number to compare, not the trailing distribution yield.
Why is SGOV's distribution yield close to but not exactly the fed funds rate? SGOV's distribution reflects bills purchased over the past few months, so it lags the front of the curve by a short period. As bills roll, the distribution converges toward the prevailing T-bill rate.
If QQQM's 5-year CAGR is higher, why not hold only QQQM? Two reasons. First, the realized drawdown was -35.0% versus VOO's -24.5%; the recovery math is meaningfully harder. Second, a single five-year window — especially one dominated by mega-cap technology leadership — is a single regime, not a base rate. Concentration risk and regime-dependence are not visible in headline CAGRs.
Does an oil shock change the long-run case for any of these funds? Not directly. Geopolitical shocks change the path of returns through the rate channel, but the multi-decade case rests on earnings growth (VOO, QQQM) or front-curve yields (SGOV), neither of which is structurally rewritten by a single conflict episode.
How does VOO compare with QQQM as the long-term core? VOO offers broader diversification (~500 names vs. 100), lower expense ratio (0.03% vs. 0.15%), and a much longer live record. The dedicated VOO vs. QQQM vs. SCHD piece covers the realized-risk comparison in more depth.
What this comparison can and can't tell you
The five-year window covers a global pandemic, the 2022 rate-hiking cycle, the 2023–2024 AI-led rally, and the current geopolitical environment. It does not cover a stagflationary decade, a sustained bear market in U.S. equities, or a prolonged front-curve inversion of the kind seen in the early 1980s. SGOV (inception 2020) and QQQM (inception 2020) lack the multi-cycle history needed to estimate behavior outside the regimes they have actually traded through. The data is honest about what it has seen and silent about what it has not.
Scenarios where each sleeve fits
Reader in their 30s, decades of horizon, regular contributions: the cash sleeve serves liquidity and rebalancing reserve more than yield. SGOV at single-digit-percent weight is plausible; the bulk of the variance budget belongs to the equity sleeves. The choice between VOO and QQQM is a factor-tilt decision, not a return-maximization decision.
Reader within ten years of drawdown: the realized-drawdown gap between QQQM and VOO matters more than the CAGR gap. Recovery math is unforgiving when contributions are slowing and distributions are about to start.
Reader holding a large cash balance against a near-term obligation: SGOV's near-zero duration and competitive front-curve yield make it a defensible parking place. The opportunity cost of staying short is, by historical standards, small.
Editor's read
If forced to rank these three for a long-horizon core, the editor leans toward VOO: broadest base, lowest cost, longest live record, and a realized-risk profile that — while painful in 2022 and again under the current rate regime — is the one the data has the most evidence about. SGOV is a working sleeve, not a return engine, and is most useful as the part of the portfolio that does not flinch when headlines arrive. QQQM is interesting as a satellite factor tilt, but the -35.0% drawdown deserves more weight in the decision than the 17.6% CAGR.
Holdings disclosure: the editor holds SGOV and VOO in the long-term core sleeve; does not hold QQQM at the time of writing.
Methodology: price and total-return series from yfinance, pulled 2026-05-18. Expense ratio, AUM, distribution yield, and inception dates cross-checked against issuer fact sheets on the same date. Macro readings (10-year Treasury, fed funds rate, CPI YoY, VIX) from FRED, asof April–May 2026. CAGR and volatility computed on daily total returns; maximum drawdown computed on a running-peak basis over the trailing five years.
This article is for educational purposes and does not constitute personalized financial advice. Disclaimer.