The short version
- XLE and VDE deliver nearly identical 5-year results (CAGR 22.7% vs 23.2%) with nearly identical realized risk (max drawdown −26.0% vs −26.6%) — the "concentration vs breadth" framing oversells how different they are in practice.
- VDE's broader holdings count doesn't translate into meaningfully different oil-shock behavior because the same handful of integrated majors dominates both portfolios by weight.
- For a long-horizon investor, the deciding factor is rarely XLE vs VDE — it is whether a dedicated energy sleeve belongs in the portfolio at all, given the sector's already-large weight inside any S&P 500 holding.
The pitch for owning a single-sector energy ETF is always the same: oil shocks. When crude jumps and the broad market wobbles, energy producers earn cyclical profit windfalls and the sector rerates. The question is which vehicle captures that windfall more efficiently — XLE's concentrated bet on roughly two dozen S&P 500 energy names, or VDE's broader cap-weighted basket of around 110 US energy stocks.
The honest answer, after looking at five and ten years of live data, is that the two funds behave more similarly than the marketing suggests. The interesting decision lives one level up.
Why this comparison even exists
XLE (State Street's Energy Select Sector SPDR) and VDE (Vanguard Energy ETF) are the two scaled, low-cost ways for a US-domiciled investor to take a passive overweight to energy. XLE launched in December 1998 and tracks the Energy Select Sector Index — only S&P 500 energy constituents. VDE launched in October 2004 and tracks the MSCI US Investable Market Energy 25/50 Index — a much wider universe that reaches into mid- and small-cap exploration, services, and refining names.
On paper these are different products. In factor space they sit close together because cap-weighting is unforgiving: ExxonMobil and Chevron alone account for roughly a third of either fund. The "long tail" of small drillers and service firms in VDE is mathematically present but contributes a few basis points each to total return — not enough to change the ETF's behavior in a typical month, let alone a regime.
The data, as of 2026-05-07
| Metric | XLE | VDE | Source |
|---|---|---|---|
| Issuer | State Street (SPDR) | Vanguard | Issuer fact sheets (XLE, VDE) |
| Inception | 1998-12-16 | 2004-10-07 | Issuer fact sheets |
| Expense ratio | 0.08% | 0.09% | Issuer fact sheets |
| AUM | $41.4B | $12.8B | yfinance, 2026-05-07 |
| NAV | $59.43 | $169.21 | yfinance, 2026-05-07 |
| Trailing dividend yield | 2.5% | 2.3% | yfinance, 2026-05-07 |
| 5Y CAGR | 22.7% | 23.2% | yfinance, total-return basis |
| 10Y CAGR | 9.7% | 9.3% | yfinance, total-return basis |
| 5Y annualized volatility | 26.1% | 26.5% | yfinance, daily returns |
| 5Y max drawdown | −26.0% | −26.6% | yfinance, daily NAV |
| Underlying index | Energy Select Sector Index (S&P) | MSCI US IMI Energy 25/50 | Issuer prospectuses |
Construction: where they actually diverge
The headline number — XLE holds about 23 names, VDE holds about 110 — exaggerates the structural difference because cap-weighting compresses the long tail. In both funds, the top ten holdings collectively represent roughly three-quarters of NAV, and the integrated majors (XOM, CVX) anchor a third or so of total weight. VDE picks up additional exposure to mid-cap E&P names like Coterra, Diamondback, and Marathon Oil, plus a handful of small services firms, but each of those positions is sub-2% of NAV.
What this means for a long-horizon holder: if you want to express a meaningful tilt to small-cap energy or to the oilfield-services subsector, neither fund really does that for you. Both are, functionally, "majors plus a refiner sleeve plus a midstream sleeve." VDE has a slightly fatter tail. That tail is where any behavioral difference between the two funds will show up — and historically it has been small.
Realized return and risk: nearly a tie, but mind the regime
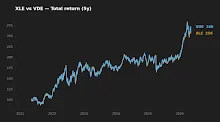
Over the trailing five years (a window that begins in mid-2021, captures the 2022 oil spike, the 2023 OPEC+ cut cycle, and the 2024–2025 normalization), VDE delivered a 23.2% CAGR versus XLE's 22.7% — a roughly 50 basis-point edge that is well within the noise of two near-identical portfolios. Volatility ran almost identical (26.1% vs 26.5% annualized) and max drawdown finished within 60 bp of each other.
The 10-year picture, which extends back to the 2014–2016 oil collapse, flips the ranking: XLE 9.7% versus VDE 9.3%. This is the more telling comparison, because the 5-year window is dominated by a single oil-price regime (post-pandemic supply tightness). Across two regimes, the funds essentially trade places at the margin and the gap is dominated by which years happen to land inside the window.
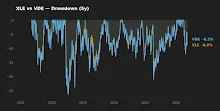
The drawdown chart makes the same point visually. Both funds bottom on the same days and recover on the same days. There is no diversification benefit hiding in the small-cap tail; in stress, the entire sector moves together because energy equity returns are dominated by a single common factor — the oil price regime.
The structural difference between XLE and VDE is real on paper and almost invisible in realized risk and return — both funds behave like the integrated-majors complex they are dominated by.
The macro frame, and the narrower question
As of early May 2026, the 10-year Treasury sits at 4.43% and CPI year-over-year at 3.32% (FRED, asof 2026-05-05 and 2026-03-01). VIX is 17.38, a regime that does not look stressed. In that backdrop, an energy ETF's 2.3–2.5% trailing yield is below the risk-free rate; the case for owning the sector rests on capital-return discipline (buybacks plus dividends) and on optionality if a supply shock revalues the curve, not on income alone.
That reframes the choice. The question is not "XLE or VDE" — it is "do I want a dedicated overweight to a sector that already represents 3–4% of any cap-weighted US equity index I own, and that has shown a single-factor behavior pattern dominated by crude prices?" If the answer is yes, the operational difference between the two funds is small enough that liquidity, broker spread, and tax-lot harvesting will dominate.
Capacity, liquidity, and the small things that matter at scale
XLE's $41.4B AUM versus VDE's $12.8B is the single largest absolute gap in this comparison. For a retail investor, both are deeply liquid — bid-ask spreads on either fund are negligible. For an institution running multi-day execution, XLE's average daily volume materially exceeds VDE's, which is why options markets on XLE are also more developed (relevant for hedging applications, not for buy-and-hold).
The 1 basis-point expense-ratio difference is, on its own, not a decision criterion. On a $50,000 position held for 20 years compounding at 8%, a 1 bp fee gap accumulates to roughly $230 — meaningful in the abstract, invisible relative to the noise in either fund's tracking error against its own index. We discuss the mechanics of cost compounding more generally in VOO vs QQQM: Which ETF Is Better for Long-Term Investing in 2026?; the conclusion there scales down to what's at stake here.
What this comparison can and can't tell you
The trailing 5-year window covers exactly one oil regime — the post-pandemic re-tightening. The 10-year window adds the 2014–2016 collapse, which is where the funds diverge slightly. Neither window contains a 2008-style demand shock with credit dislocation, and neither contains a sustained sub-$40 oil environment. Anyone projecting forward needs to acknowledge that energy-sector returns are heavily regime-dependent and that the comparable-fund analysis above is, at most, a statement about how XLE and VDE relate to each other — not about whether the sector itself will continue to deliver double-digit annualized returns.
The data also cannot tell you the most important thing: how the position will interact with the rest of your portfolio. A reader who already owns broad US equity has roughly 3–4% energy exposure baked in. Adding XLE or VDE at, say, a 5% weight roughly doubles that. We treated the geopolitical-and-shock case for energy in Why Energy Stocks Surge During Geopolitical Conflicts; it is worth reading alongside this comparison if the dedicated-sleeve question is open in your mind.
Scenarios where each fund actually fits
- A reader who already holds a broad US index fund and wants a small inflation/oil-shock sleeve: either fund works. XLE's deeper liquidity and 1 bp lower fee marginally favor it; the choice is essentially noise. Sizing matters far more than the ticker.
- A reader who wants explicit exposure to mid-cap E&P and services beyond the integrated majors: VDE captures more of that tail than XLE, but neither is a clean expression — a dedicated services ETF would be closer to that thesis.
- A reader using options or running tax-lot strategies at scale: XLE's deeper options market and tighter book are an operational advantage.
- A reader using a Vanguard-only brokerage with commission-free Vanguard ETFs: VDE is the natural fit for fee-and-friction reasons unrelated to portfolio construction.
- A reader without any current dividend or sector exposure who is reaching for "income": a 2.3–2.5% trailing yield in a 4.4% Treasury world is a weak income story. Either fund's case rests on capital appreciation through cycles, not yield.
At-a-glance scoreboard
| Category | Edge | Margin |
|---|---|---|
| Cost | XLE | 1 bp — immaterial |
| Liquidity / scale | XLE | Material at institutional size; immaterial for retail |
| Realized 5Y return | VDE | ~50 bp/yr — within noise |
| Realized 10Y return | XLE | ~40 bp/yr — within noise |
| Realized 5Y risk | XLE | Marginal — vol and max DD nearly identical |
| Breadth of holdings | VDE | Real on paper; small in behavior |
FAQ
Is XLE more concentrated than VDE in a way that matters?
It is more concentrated by holdings count (~23 vs ~110) and by top-10 weight, but the realized return and risk profiles over five and ten years are nearly indistinguishable. The reason is that VDE's additional names are individually small and cap-weighted, so they do not move the fund's behavior much.
Which fund benefits more from an oil shock?
Historically, neither has a structural edge. Integrated majors dominate both funds; both rerate together when the oil curve moves. VDE has slightly more E&P beta in the long tail, which can help in a sustained crude rally, but the effect is small enough that it has not separated the two funds materially across the last decade.
Are XLE and VDE good inflation hedges?
Energy equities have historically tracked oil-price-driven inflation episodes well, and both funds did so in 2022. They are not a hedge against services inflation or wage inflation, which have been the dominant CPI components more recently. The 2.3–2.5% trailing yield is below the current 4.4% 10Y Treasury (FRED, asof 2026-05-05), so the case rests on capital returns and shock optionality rather than yield.
Can I hold both XLE and VDE?
You can, but the overlap is so high that doing so just creates a slightly diluted version of either fund. There is no meaningful diversification to harvest by combining them.
Should I size an energy sleeve based on its weight in the broad index?
That is a defensible starting point. Energy is roughly 3–4% of the S&P 500 today; a "tilt" might mean doubling that. Anything beyond a 10% portfolio weight is a concentrated sector bet whose factor exposure (oil price) will dominate portfolio behavior in stress.
Editor's read
If forced to pick one of these two for a long-term core energy sleeve, the editor leans toward XLE — not because it is meaningfully better, but because the deeper liquidity and slightly lower fee remove tiny frictions, and the 10-year record is marginally stronger. The bigger and more honest question, though, is whether a dedicated energy sleeve is needed at all on top of broad-market exposure. For most long-horizon portfolios, the answer is "small or none." When the choice between two near-identical funds is this close, the construction decision one level up matters more than the ticker.
Key takeaways
- XLE and VDE are close substitutes in realized behavior; the structural-difference framing oversells the breadth of VDE because cap-weighting concentrates both funds in the same integrated majors.
- 5Y returns favor VDE by ~50 bp/yr; 10Y returns favor XLE by ~40 bp/yr. Both gaps are within noise.
- 1 bp fee gap and similar 26% max drawdowns mean the operational decision (liquidity, broker, options availability) carries more weight than the academic one (holdings count).
- Sector-overweight sizing matters more than fund choice; energy's single-factor behavior (oil-price regime) shows up clearly in the drawdown chart.
- Available data covers limited regimes — a 2008-style demand shock has not stress-tested either fund.
Editor's holdings disclosure. The editor does not hold either XLE or VDE at the time of writing.
Methodology. Price, NAV, AUM, dividend yield, CAGR, volatility, and max drawdown computed from yfinance daily data fetched 2026-05-07. CAGRs are total-return on a 5-year and 10-year window ending on the fetch date. Volatility is annualized standard deviation of daily log returns. Max drawdown is computed on daily NAV. Expense ratios and inception dates from issuer fact sheets (State Street, Vanguard). Macro context (10Y Treasury, Fed funds, VIX, CPI YoY) from FRED, asof dates noted inline.
This article is for educational purposes and does not constitute personalized financial advice. See full Disclaimer.