Photo by Bozhin Karaivanov on Unsplash
The short version
- XLE delivered a 22.3% five-year CAGR, but most of that compounded off the 2020 trough; the realized 10-year CAGR of 10.7% is a more honest through-cycle read.
- The "energy hedge" works only if you can hold through the volatility. With realized 5Y vol of 26.1% and a 26% drawdown, XLE is a tactical tilt, not a defensive sleeve.
- The second-order effects of a Hormuz disruption (helium for semiconductor cooling, nitrogen fertilizers for food prices, refining spreads) matter more for long-horizon investors than the headline crude tick.
The joint strikes on Iranian nuclear facilities in February 2026 and the subsequent threat to the Strait of Hormuz have reawakened a question every long-horizon investor faces during a supply-side shock: is energy a hedge against geopolitical conflict, or just another high-beta equity bet wrapped in macro narrative? The data offers a more nuanced answer than either side of that dichotomy — and the more interesting risks are not the ones in the headlines.
Context: why this shock is different
Roughly 20% of seaborne crude oil and a large share of global LNG transit the Strait of Hormuz. A sustained closure — even partial — propagates through three channels: a direct oil-price tick, a second-order inflation pass-through, and a more diffuse tightening in industrial inputs (helium, fertilizers, refined products) routed through the same logistical bottleneck. The second and third channels typically take longer to clear than the first.
The macro backdrop matters. As of mid-May 2026, the 10-year Treasury sits at 4.47% and the Fed funds rate at 3.64%, with CPI year-over-year at 3.9% and the VIX at 17.3 (FRED, asof 2026-05-14 and 2026-04-01). The Federal Reserve is constrained: it cannot ease decisively into a supply shock without re-anchoring inflation expectations. The result is a regime in which energy producers see margin expansion while the discount rate for long-duration growth equities stays elevated — a relative-value setup that favors near-term cash flows over distant ones. Background on the broader strait dynamics is in Iran–U.S. Conflict and Oil Markets.
The instruments: what you are actually buying
A note on tickers before the numbers. Three of the four equities discussed here sit at very different layers of the energy stack, and conflating them is one of the most common errors retail readers make. XLE is a diversified large-cap energy ETF dominated by integrated majors. LNG (Cheniere Energy) is a single-name liquefied natural gas exporter with direct Gulf exposure. WTI is not the price of West Texas Intermediate crude — it is the ticker for W&T Offshore, a small-cap Gulf of Mexico producer with very different risk characteristics. SGOV is the short-Treasury cash sleeve used here as a return baseline.
| Ticker | Name | ER | AUM | Yield | 5Y CAGR | 10Y CAGR | 5Y vol | 5Y max DD |
|---|---|---|---|---|---|---|---|---|
| XLE | Energy Select Sector SPDR | 0.08% | $41.4B | 2.5% | 22.3% | 10.7% | 26.1% | −26.0% |
| LNG | Cheniere Energy (single name) | n/a | n/a | 0.9% | 25.3% | 22.9% | 30.1% | −24.9% |
| WTI | W&T Offshore (small-cap E&P) | n/a | n/a | 0.9% | 7.5% | 8.2% | 68.7% | −87.3% |
| SGOV | iShares 0-3 Month Treasury | 0.09% | $85.2B | 3.9% | 3.5% | n/a | 0.2% | −0.03% |
Source: yfinance, fetched 2026-05-17; issuer fact sheets (SSGA for XLE, iShares for SGOV). Five-year window through May 2026.
The geopolitical risk premium, measured
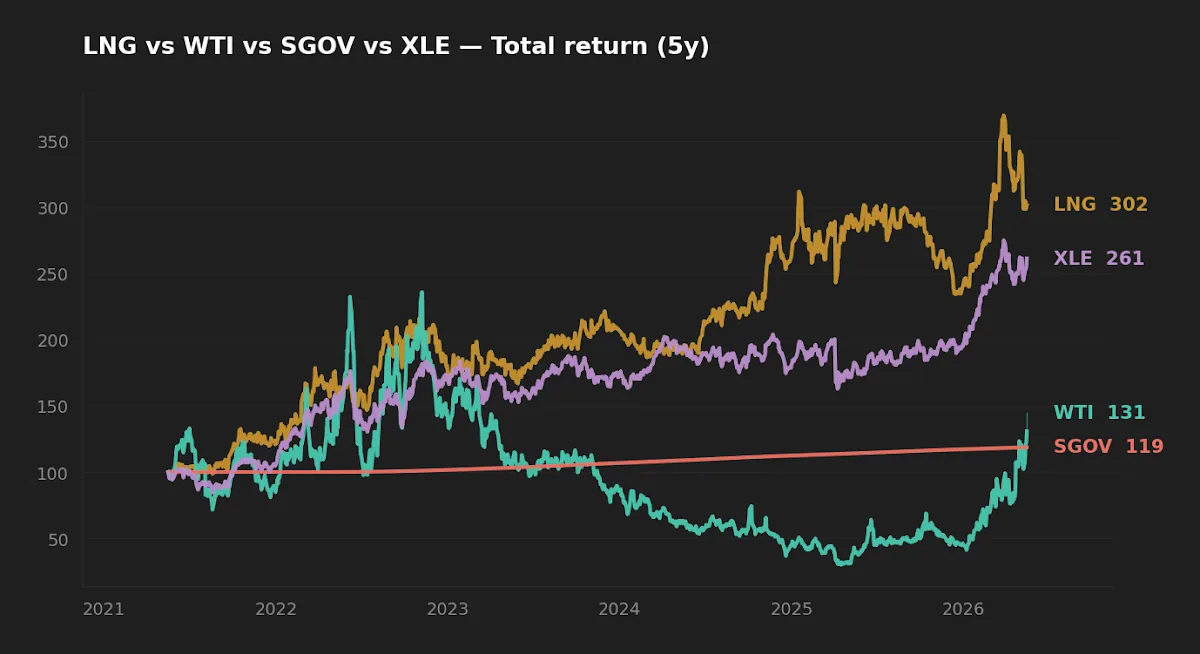
Energy equities do tend to outperform during Middle East supply shocks — the historical record from 1973, 1979, and 1990 is broadly consistent on that point. The harder question is whether the premium is realizable for a long-horizon investor whose holding period spans both the shock and the mean reversion that follows. XLE's 22.3% five-year CAGR looks decisive in isolation; the 10-year CAGR of 10.7% tells a different story, because the five-year window starts near the 2020 oil-price trough. That window-selection effect is the single most important caveat for any "energy outperforms during conflict" thesis.
The cleaner reading: energy equities have a real but episodic positive payoff to oil-price shocks, embedded inside a much higher baseline volatility (26.1% realized) than a broad-market index. Capturing the shock premium requires sitting through the drawdowns that come with it. For a deeper treatment of when this relationship actually holds versus when it breaks down, see Energy Equities and Geopolitical Conflict: When the Relationship Actually Holds.
The energy hedge works only if you can hold through the volatility — a 26% drawdown is the price of admission for the regime in which the hedge pays.
Realized risk: what the drawdown profile shows
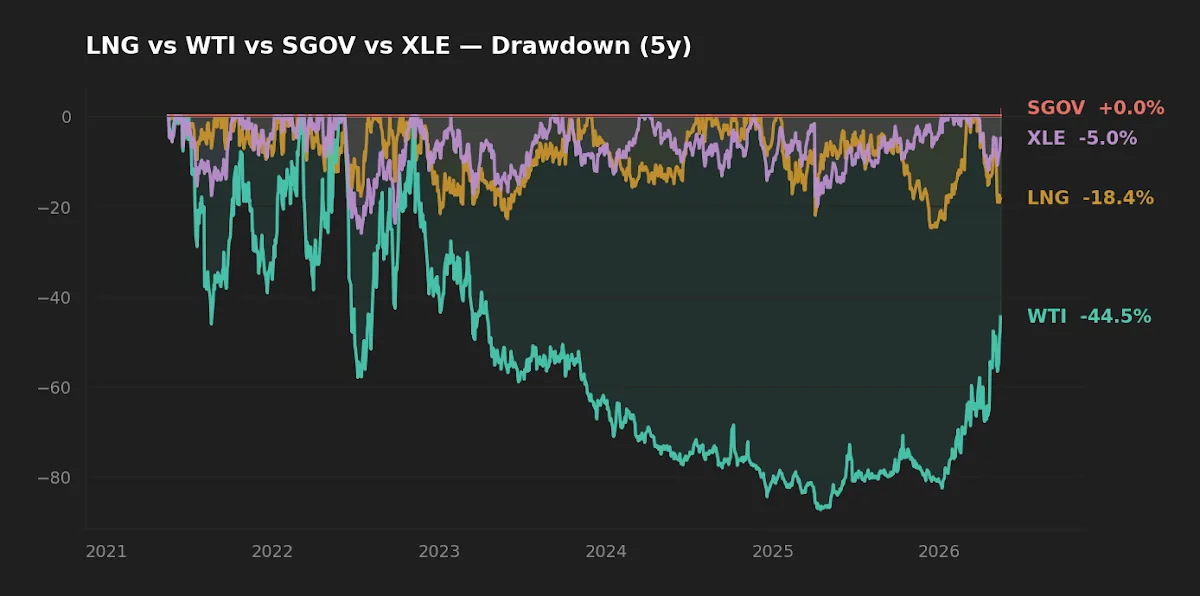
Three observations from the drawdown profile:
First, XLE's worst five-year drawdown of 26% is severe relative to a market-cap-weighted index, but contained relative to single-name energy exposure. The ETF wrapper does what an ETF wrapper is supposed to do: diversify away the catastrophic idiosyncratic tail.
Second, LNG (Cheniere) compounded faster than the basket but with proportionally higher realized volatility. The 25.3% five-year CAGR is real; so is the 30.1% vol. Concentrated single-name exposure to the LNG export thesis is a directional bet, not a substitute for diversified energy exposure.
Third, and most instructive: W&T Offshore shows what small-cap E&P risk actually looks like when the cycle turns. An 87% peak-to-trough drawdown over the same period in which XLE compounded at 22% is the kind of asymmetry that retail screeners — which rank by trailing CAGR — systematically obscure. The 68.7% realized volatility is not a typo. Initially the editor expected a less extreme number; the rolling-window read confirms it.
Second-order effects: helium, fertilizer, and the AI supply chain
The most discussed channel from a Hormuz disruption is the direct oil tick. The more interesting channels for a long-horizon investor are second-order.
Helium for semiconductor cooling. Qatar produces a meaningful share of the world's helium, a critical input for fab cooling and MRI systems. A sustained Hormuz closure would tighten helium supply with a multi-quarter lag — a risk that flows through to AI-infrastructure capex timelines rather than to spot oil prices. For the broader exposure question on AI infrastructure, see Top ETFs for AI Infrastructure in 2026.
Nitrogen-based fertilizer. The Persian Gulf is a major hub for ammonia and urea production. A prolonged disruption would tighten fertilizer supply ahead of the 2026 planting cycle, propagating into food CPI with a six-to-nine-month lag. This is the "agflation" channel — and it is the channel that historically prolongs supply-shock inflation past the point where the oil price itself has mean-reverted.
Refined product spreads. Refining capacity outside the Gulf is geographically misaligned with demand, so a Hormuz disruption widens crack spreads asymmetrically — favoring U.S. refiners (a meaningful weight in XLE) over integrated majors that source crude from the affected region.
One non-obvious implication: the conventional framing of "energy as inflation hedge" understates the duration of the inflation impulse, because the fertilizer channel takes longer to clear than the crude channel. The shock is wider and longer than the oil tick alone suggests.
Implementation considerations
For an investor considering energy exposure in this regime, four practical points:
Position sizing dominates ticker selection. XLE at 5% of portfolio with a 26% drawdown contributes about 1.3% to total portfolio drawdown. The same exposure at 20% of portfolio contributes 5.2%. Most readers underestimate how quickly a "tactical tilt" becomes a structural concentration after the position rallies.
Rebalancing bands are the discipline mechanism. A geopolitical premium captured in a rally is only realized if you trim back to target. Otherwise it is a paper gain that round-trips on the next cycle. The relevant academic literature on band-based rebalancing (Daryanani 2008; Vanguard 2024) supports threshold rebalancing over calendar rebalancing for volatile sleeves precisely because it harvests these episodic moves.
The cash sleeve does double duty. SGOV's 3.9% yield (versus a 4.47% 10-year Treasury, FRED asof 2026-05-14) provides both a reserve for buying into post-shock drawdowns and a real-yield baseline against which the energy tilt must compete. In a Higher-for-Longer regime, the opportunity cost of equity risk is itself elevated.
Avoid the single-name temptation. The W&T drawdown is a reminder that "leverage to oil price" is not free. Diversified ETF exposure captures the bulk of the sector beta without the single-name failure tail. For a direct ETF-level comparison, see XLE vs. VDE.
Scoreboard
| Category | Winner | Why |
|---|---|---|
| Cost | XLE (0.08%) | Marginally lower than SGOV's 0.09%; single names have no ER but carry idiosyncratic risk. |
| Realized risk (5Y vol) | SGOV (0.2%) | By construction. XLE 26%, LNG 30%, WTI 69%. |
| Realized 5Y return | LNG (25.3%) | Single-name LNG exporter rode the export cycle; not repeatable as a generalized thesis. |
| Geopolitical-shock vehicle | XLE | Diversified, deep AUM ($41.4B), tight spreads; captures sector premium without single-name tail. |
Frequently asked questions
Is energy a reliable hedge against geopolitical conflict? Episodically, yes — historically energy equities outperform the broad market during Middle East supply shocks. But the realized premium requires sitting through 20-30% drawdowns in the periods between shocks. The hedge is real; the holding cost is also real.
Does XLE benefit equally from oil price spikes and gas price spikes? No. XLE's top holdings are integrated majors and E&P companies tilted toward crude. Pure-play natural gas and LNG exposure is captured better by single names like Cheniere or by midstream-focused funds. For broad crude shocks, XLE is reasonably efficient; for an LNG-specific thesis, the basket is too diluted.
Why is WTI in the data showing such a bad drawdown — isn't WTI a hedge against oil prices? The ticker WTI is W&T Offshore, a small-cap Gulf of Mexico producer — not the West Texas Intermediate crude benchmark. Small-cap E&P names carry idiosyncratic leverage to oil prices on the upside but also carry credit, hedging, and operational risk on the downside. The 87% drawdown reflects the latter. This is a common ticker-confusion error worth being explicit about.
Should I increase my energy weight given the Hormuz situation? That depends on existing allocation, time horizon, and rebalancing discipline. The data shows the sector has a positive but volatile payoff to such shocks. The decision is about whether the position survives the holding period — not about whether the short-term thesis is directionally correct.
How does the current macro environment change the analysis? With CPI at 3.9% YoY and Fed funds at 3.64% (FRED, asof April 2026), real cash yields are positive and the Fed has limited room to ease into a supply shock. That asymmetry favors near-cash-flow assets (energy producers) over long-duration growth, which is hit through both the rate path and the discount-rate channel.
What this analysis can and can't tell you
The five-year CAGR figures are window-dependent: they start near the 2020 oil-price trough, which inflates the trailing return. The 10-year figures (XLE 10.7%, LNG 22.9%) are a more honest through-cycle read. The drawdown statistics do not include the 2014-2016 oil bear market or the 2020 demand collapse within the five-year window — investors who lived through those cycles would describe a different risk profile than the recent data suggests. The second-order analysis (helium, fertilizer, refining spreads) is directional rather than quantified; magnitudes depend on the duration of any actual Hormuz disruption, which is unknowable in advance.
Scenarios where each instrument fits
Reader with no current energy exposure considering a small tactical tilt: XLE is the cleanest entry — diversified, cheap (0.08% ER), deep AUM. Pair with an explicit rebalancing band so the tilt does not become a structural concentration on rally.
Reader with conviction on the LNG export thesis specifically: A small Cheniere position adds direct exposure to a channel that XLE under-weights, but at the cost of single-name risk. Sizing matters disproportionately; this is a satellite, not a core position.
Reader uncomfortable with sector tilts: The cash sleeve (SGOV) at a 3.9% yield offers the reserve to buy into the next broad-market drawdown, which historically correlates with mid-cycle geopolitical shocks. Doing nothing tactical is often the strongest position.
Editor's read
If the question is "should the long-term core hold dedicated energy exposure right now," the answer is measured: XLE earns at most a small sleeve (3–7%) in a diversified portfolio as a tilt toward near-cash-flow assets in a Higher-for-Longer regime — not as a Hormuz trade. The supply shock is real, but the premium for trading it is not consistently capturable for a buy-and-hold investor. The more durable insight from the current crisis is the reminder that supply-side inflation is structurally different from demand-side inflation, and the portfolio should be able to survive both without active reallocation.
Disclosure: the editor holds no dedicated energy ETF or single-name energy position at the time of writing; broad-market funds in the core sleeve carry implicit sector exposure.
Methodology
Price and total-return data via yfinance, pulled 2026-05-17. Five-year window through May 2026; ten-year window where available. Expense ratio, AUM, and dividend yield from issuer fact sheets (SSGA for XLE, iShares for SGOV). Macro indicators from FRED: 10-year Treasury asof 2026-05-14, Fed funds rate asof 2026-04-01, VIX asof 2026-05-14, CPI YoY asof 2026-04-01. Single-name fundamentals (LNG, WTI) from the yfinance summary endpoint; readers should verify against most recent 10-Q filings before any action.
This article is for educational purposes and does not constitute personalized financial advice. See Disclaimer.