
The short version
- VUG and TTAI are not the matchup the legacy title suggests. TTAI today is the Abacus FCF International Leaders ETF — a free-cash-flow-weighted international developed-markets fund, not a US AI thematic. The honest comparison is US large-cap growth versus international FCF quality.
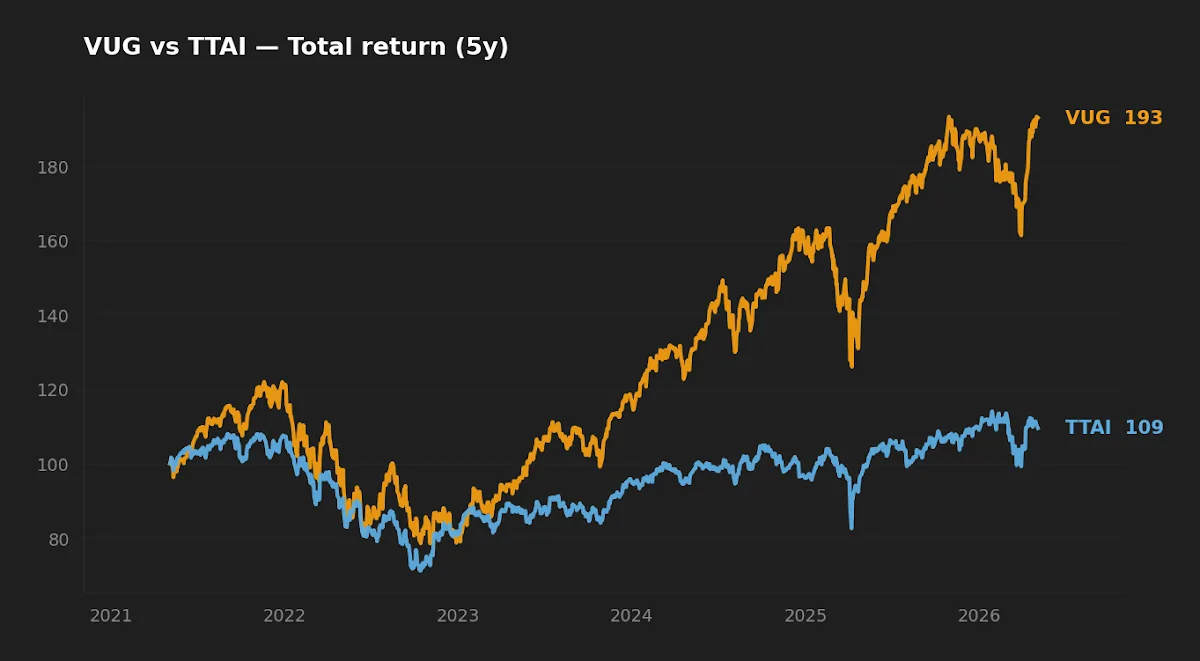
- Over the trailing five years, VUG compounded at 13.3% annualized versus TTAI at 1.7% (yfinance, 2026-05-05). That 11.6-percentage-point gap is mostly the cost of being underweight US mega-cap tech in this single regime.
- Bottom line: VUG is a low-cost domestic growth core. TTAI is a small, expensive, international FCF tilt with closure risk. They are not substitutes for each other.
The interesting question here is not which fund "won" the last five years — that is not close. It is whether the comparison is meaningful at all, given that VUG and TTAI sit in different equity universes and serve different roles. Anyone benchmarking an international FCF-weighted ETF against US large-cap growth and concluding "growth wins" is reading the regime, not the funds.
Context: what these funds actually are
VUG (Vanguard Growth ETF) tracks the CRSP US Large Cap Growth Index. It holds the largest US growth-classified companies — heavily skewed toward mega-cap technology and consumer discretionary names. At 0.03%, it is among the cheapest growth ETFs in existence, with $317.9 billion in assets and a 22-year live record (inception January 2004).
TTAI (Abacus FCF International Leaders ETF) is a different animal. It screens international developed-market equities by free-cash-flow yield and free-cash-flow quality, weights toward the highest-scoring names, and rebalances on a defined cadence. The current strategy is the post-2024 Abacus mandate; older descriptions of the ticker as a "TrimTabs/Donoghue Forbis AI U.S. Equity ETF" reflect a prior sponsor and methodology that no longer apply. Assets stand at roughly $31.6 million — small enough that closure or further strategy shifts are real risks, not theoretical ones.
Two things follow. First, the framing of "AI tactical theme rotation" does not describe TTAI's current process. Second, comparing them is comparing US growth to international value-quality. The result tells you about the past five years of US-vs-international relative performance more than it tells you about either fund's process.
Side-by-side data
| Metric | VUG | TTAI |
|---|---|---|
| Expense ratio | 0.03% | 0.54% |
| AUM | $317.9B | $31.6M |
| Inception | Jan 2004 | Jun 2017 |
| NAV (2026-05-05) | $83.86 | $31.91 |
| Distribution yield | 0.5% | 2.3% |
| 5Y CAGR | 13.3% | 1.7% |
| 10Y CAGR | 17.6% | n/a |
| 5Y annualized vol | 22.2% | 16.7% |
| 5Y max drawdown | -35.6% | -34.1% |
Source: yfinance pulled 2026-05-05; issuer fact sheets for expense ratio and AUM. CAGR computed from total-return adjusted close over the trailing 60 months.
Fee math is unforgiving — but it is not the story here
The 51-basis-point gap (0.03% vs 0.54%) is significant in long-horizon terms. On a $50,000 position over 20 years at a 6% gross compounding rate, the higher fee compounds away to roughly $15,500 in foregone wealth. That is the kind of basis-point arithmetic any patient investor should respect — Sharpe (1991) and Bogle's fee-drag math both make the case that costs are the most reliable predictor of long-run net returns.
But fee drag is not what created the 11.6-percentage-point CAGR gap. The gap is dominated by US mega-cap tech outperforming international developed markets by an unusually wide margin in 2020-2025. Even fee-free, TTAI would have delivered a single-digit annualized return in this window. The fee matters; it is not the verdict.
Realized risk: similar drawdowns, different paths
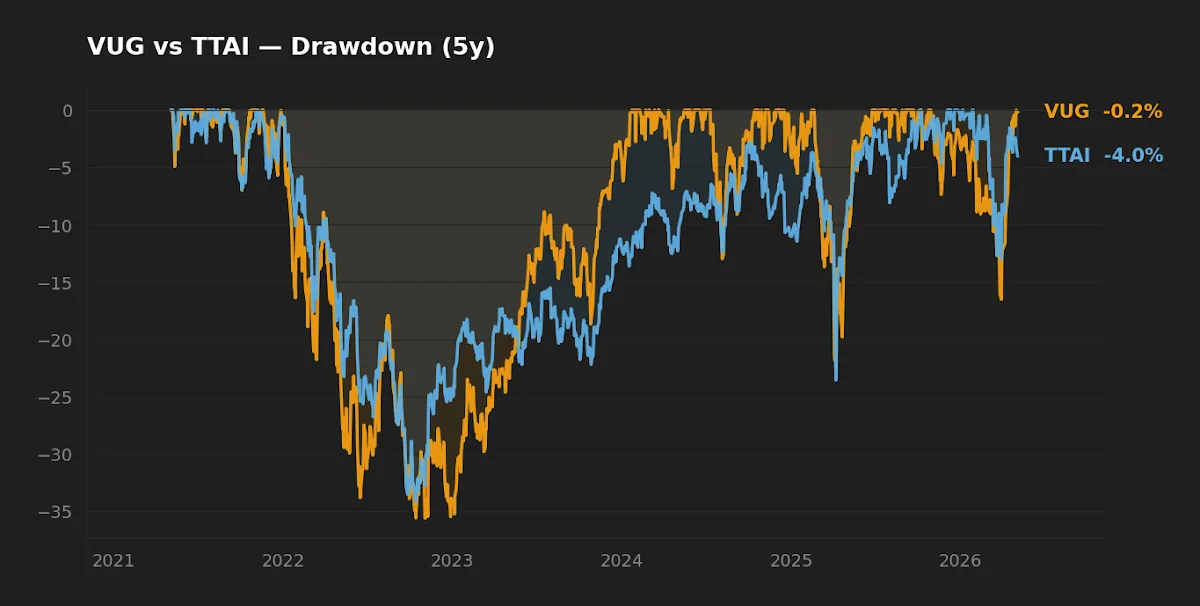
Here is the genuinely non-obvious finding. TTAI's 5-year annualized volatility is 16.7%, comfortably below VUG's 22.2%. Lower vol typically translates into a shallower drawdown. But the realized maximum drawdowns are within 1.5 percentage points of each other — TTAI bottomed at -34.1%, VUG at -35.6%.
The mechanics differ. VUG's deepest pull came from the 2022 rate-driven growth selloff: high day-to-day volatility, sharp peak-to-trough. TTAI's came from a slower combination of currency translation (international ETFs unhedged for USD) and a sustained de-rating of international equities relative to US peers. Same magnitude of pain, different cause. Lower portfolio vol did not buy a meaningfully lower drawdown because the loss event for TTAI was structural rather than volatility-driven.
Lower portfolio volatility does not buy lower drawdowns when the loss event is structural rather than volatility-driven.
Yield, distribution, and the macro frame
TTAI's distribution yield is roughly 2.3%, versus 0.5% for VUG. That looks like an income advantage until you compare against the alternative. The 10-year US Treasury yields 4.39% (FRED, asof 2026-05-01); the Fed funds rate sits at 3.64%. TTAI is paying 2.3% with full equity drawdown risk attached. Treating it as an income vehicle means accepting equity risk for a yield well below the risk-free rate — a hard trade to defend on income terms alone.
The yield differential mostly reflects the FCF-weighting methodology and an embedded international-value tilt, not a deliberate income mandate. International developed equities tend to distribute more than US growth for structural reasons: lower buyback culture, different tax treatment, more mature business mix.
Concentration and capacity
VUG holds roughly 200 names, but the top 10 typically account for more than half of the fund — concentration in US mega-cap technology is the dominant exposure. In factor terms, an investor buying VUG is buying US large-cap growth with a heavy quality tilt and meaningful momentum exposure. The fund's $317.9 billion in assets means liquidity, bid-ask, and tax-efficiency are non-issues.
TTAI's $31.6 million AUM is a different category. At that scale an ETF can be closed by the sponsor on relatively short notice, the bid-ask spread can widen meaningfully under stress, and large redemptions can force tax-inefficient distributions. None of these are deal-breakers for a small satellite position. They do mean TTAI is not a candidate for a long-horizon core sleeve.
What this comparison can and can't tell you
The 5Y window covers a single regime: post-pandemic recovery, US dollar strength, the largest mega-cap tech outperformance run in modern market history, and a global rate-hiking cycle. The 11.6-percentage-point gap is real, but it is not stable across regimes. The 2000-2010 decade saw US large-cap growth deliver negative real returns while international and value strategies outperformed. We have no reason to expect either of those decade-scale patterns to be the future, but we should be honest that "VUG won" is a statement about one regime, not about the underlying processes.
TTAI's record is also limited. The fund's current FCF-leaders mandate is recent enough that we lack a credit-stress or recession test of this exact methodology. Treat the live record as suggestive, not definitive.
Where each fund actually fits
- 30-something investor, US-only 401(k), no international exposure: VUG is a reasonable growth tilt within an already US-heavy mix. TTAI does not fit — it requires a brokerage account capable of holding it, and the small AUM creates closure risk that does not belong inside a retirement plan.
- Investor with a globally diversified core and a satellite budget: TTAI could function as a small (1-3%) FCF-discipline tilt within the international sleeve. The 0.54% fee is high for that role and there are cheaper international quality alternatives, but the FCF methodology is not interchangeable with broad market-cap weighting.
- Income-oriented investor: Neither fund is built for this. TTAI's yield is below short-term Treasuries; VUG's is rounding error. An income mandate belongs in dividend-focused or fixed-income vehicles.
At-a-glance scoreboard
| Category | Winner | Margin |
|---|---|---|
| Cost | VUG | Material — 51 bp |
| 5Y realized return | VUG | Decisive — 11.6 pp/yr |
| 5Y realized vol | TTAI | Modest — 5.5 pp lower |
| 5Y max drawdown | TTAI | Marginal — 1.5 pp shallower |
| Liquidity / capacity | VUG | Decisive — ~10,000x larger |
| Suitability for long-term core | VUG | Strong |
FAQ
Is TTAI an "AI" ETF?
No. Despite a legacy description tied to a previous sponsor, TTAI's current strategy is the Abacus FCF International Leaders methodology — a free-cash-flow-weighted international developed-markets approach. Always read the current prospectus rather than relying on older third-party descriptions.
Why is TTAI's drawdown not much shallower than VUG's, given lower volatility?
Volatility and drawdown measure different things. Volatility is the dispersion of period returns; drawdown is the cumulative path. TTAI's loss event was driven by a sustained de-rating of international equities and USD strength, which produced a deep drawdown without the high day-to-day vol that growth selloffs typically generate.
Is the 0.54% expense ratio reasonable for what TTAI does?
It is on the high side for a passive screening methodology. Other international quality and FCF-tilted ETFs are available in the 0.20-0.35% range. The 0.54% is defensible only if the specific FCF-leaders methodology meaningfully outperforms cheaper alternatives over a full cycle — and that has not been demonstrated yet.
Could VUG keep this lead for another decade?
The honest answer is unknown. US large-cap growth outperformed international developed by roughly 8 percentage points annualized over 2015-2025. The same factor combination underperformed in 2000-2010. Mean reversion is not guaranteed, but neither is regime persistence. Position size accordingly.
Should I sell TTAI to buy VUG based on this comparison?
This article does not make individual recommendations. The decision depends on your existing allocation, tax situation, and the reason for holding TTAI in the first place. If TTAI is functioning as the international sleeve of a globally diversified portfolio, replacing it with VUG concentrates US exposure further — which may or may not be appropriate.
Key takeaways
- VUG and TTAI are not natural comparables. The 11.6-pp 5Y CAGR gap mostly reflects US-vs-international regime difference, not process quality.
- VUG's case is structural: 0.03% fee, $317.9B AUM, 22-year record, deep liquidity. It is among the cleanest available US large-cap growth exposures.
- TTAI's case is narrower: a small-AUM FCF-weighted international tilt with closure risk and a fee that is high for the category. Defensible as a satellite, not a core.
- The drawdown similarity (-35.6% vs -34.1%) is the most non-obvious data point: lower vol did not buy lower drawdown because the losses came from different regime mechanics.
- Treat any 5Y comparison as a single-regime read. The next decade's relative performance is not implied by the last one.
Editor's read
If forced to pick one for a long-term growth core, the editor leans toward VUG — the 51-bp fee gap, the 22-year live record, and the $317.9B liquidity profile make it the structurally cleaner exposure. TTAI is interesting only as a small international satellite for an investor who specifically wants FCF-weighting in their international sleeve and is comfortable with the closure risk; even then, cheaper alternatives deserve a serious look first. The deeper lesson is methodological: benchmarking across regions during a one-regime window can produce misleadingly large gaps.
The editor does not hold either fund at the time of writing.
Methodology
Price and total return data: yfinance, pulled 2026-05-05. Trailing five-year window: May 2021 through May 2026. CAGR computed from adjusted-close total return. Volatility annualized from daily log returns. Maximum drawdown computed peak-to-trough on the cumulative total return path. Expense ratio and AUM from issuer fact sheets (Vanguard for VUG, Abacus ETFs for TTAI), cross-checked against the most recent prospectus filings. Macro context (10-year Treasury yield 4.39%, Fed funds rate 3.64%, VIX 16.99, headline CPI YoY 3.3%) from FRED, asof dates between March and May 2026 depending on series.
For broader portfolio construction context, see the framework for evidence-based ETF portfolios. For analyses of ETFs that actually use AI-driven methodologies, see the writeups on QQQM vs QRFT and VOO vs AMOM.
This article is for educational purposes and does not constitute personalized financial advice. See Disclaimer.