NOBL vs. DGRW: Dividend Aristocrats vs. AI-Filtered Quality Dividend Growth
Last updated: 2026-05-05

The short version
- Over the past five years, DGRW returned 11.8% annualized versus NOBL's 5.7% — a 6.1-point gap, with DGRW showing slightly lower volatility and drawdown.
- DGRW is not "AI-driven" despite how it is sometimes marketed. It tracks a rules-based quality-and-growth index. The label confuses what is actually a classic quality factor tilt.
- NOBL fits a defensive-income role; DGRW fits a quality-growth role. Holding both makes sense; treating them as substitutes does not.
The interesting result on this matchup is not that one ETF wins. It is the size and shape of the gap. Over the past five years, DGRW returned 11.8% annualized while NOBL returned 5.7% — a 6.1-percentage-point spread. DGRW also showed marginally lower volatility (14.0% vs 14.4%) and a marginally shallower max drawdown (−17.3% vs −17.9%). Lower fees too (0.28% vs 0.35%). The only metric NOBL wins on cleanly is current yield (2.14% vs 1.43%).
A 6-point CAGR gap is enormous. Compounded over a decade, $10,000 grows to roughly $30,500 at 11.8% versus $17,400 at 5.7%. That gap is worth understanding before deciding either is a substitute for the other.
What each fund actually does
NOBL (ProShares S&P 500 Dividend Aristocrats ETF) holds an equal-weighted basket of S&P 500 companies that have raised their dividend for at least 25 consecutive years. The screen is entirely backward-looking. The mechanical effect is a defensive-quality tilt: heavy weights in consumer staples, industrials, and healthcare; structurally light in technology because most large-cap tech companies are younger than the 25-year requirement and many returned capital through buybacks rather than dividends until recently.
DGRW (WisdomTree U.S. Quality Dividend Growth Fund) is frequently described — including in the original framing of this comparison — as "AI-filtered" or "AI-driven." It is not. DGRW tracks the WisdomTree U.S. Quality Dividend Growth Index, a published, rules-based methodology that ranks dividend-paying U.S. stocks by long-term earnings-growth expectations, three-year average return on equity, and three-year average return on assets, then weights the holdings by dollar dividends paid. There is no machine-learning model. The "AI" label is a marketing artifact that the financial press has occasionally reused; the actual exposure is a textbook quality-growth factor tilt.
Stripping the label, the comparison resolves into something cleaner: a defensive-quality screen (NOBL) versus a quality-growth screen (DGRW). The factor labels matter much more than the marketing.
The data
| Metric | NOBL | DGRW | Source |
|---|---|---|---|
| Expense ratio | 0.35% | 0.28% | Issuer fact sheets |
| AUM | $11.1B | $15.4B | yfinance, 2026-05-05 |
| Dividend yield (TTM) | 2.1% | 1.4% | yfinance, 2026-05-05 |
| Inception | 2013-10-09 | 2013-05-22 | Issuer fact sheets |
| 5Y CAGR | 5.7% | 11.8% | yfinance, 2026-05-05 |
| 10Y CAGR | 9.4% | 13.7% | yfinance, 2026-05-05 |
| 5Y annualized volatility | 14.4% | 14.0% | yfinance, 2026-05-05 |
| 5Y max drawdown | −17.9% | −17.3% | yfinance, 2026-05-05 |
| Construction | Equal-weight, 25-year dividend history | Dividend-weighted, ROE/ROA/growth screen | Index methodology docs |
Issuer references: ProShares NOBL fact sheet and WisdomTree DGRW fact sheet.
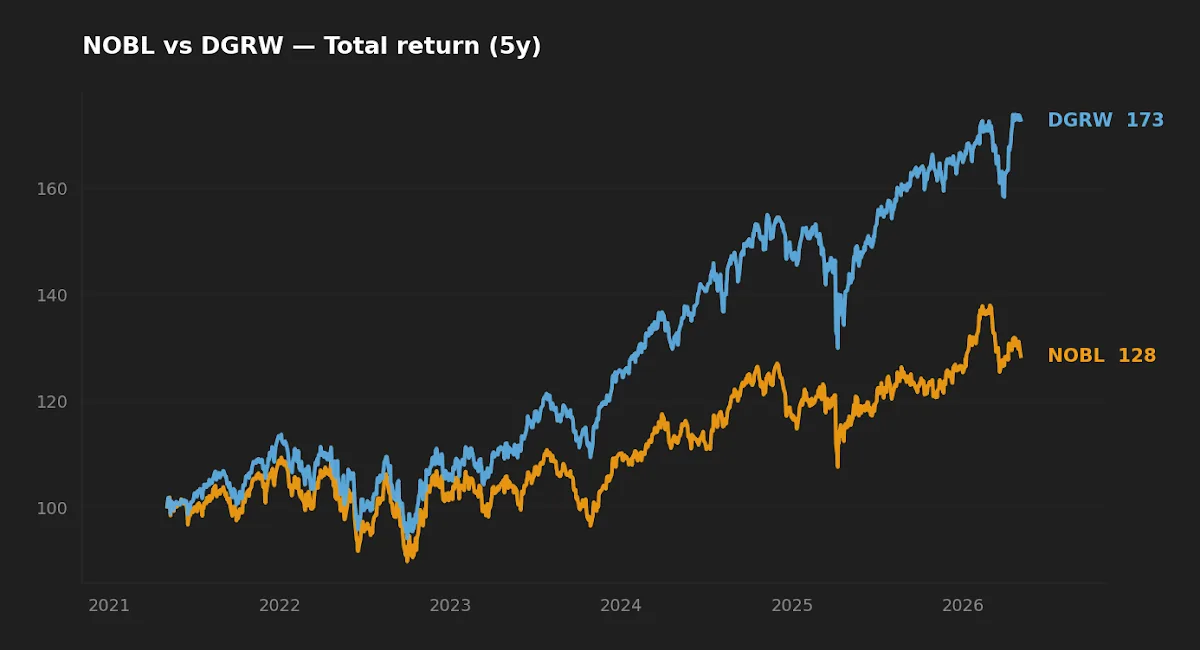
Where the 6-point gap actually came from
The 2020–2025 window was favorable to high-quality, asset-light, growth-tilted U.S. equities. Two effects compounded. First, mega-cap concentration: a small set of names — Apple, Microsoft, Broadcom, NVIDIA, and a few peers — drove an outsized share of the S&P 500's return, particularly from 2023 onward. Second, margin expansion at the top of the index, supported initially by low rates and later by software- and AI-led operating leverage.
NOBL, being equal-weighted and bound by the 25-year dividend rule, structurally underweighted those names. Apple was paying dividends through the period but is too young in dividend history to qualify; NVIDIA's payout is too small; Broadcom did not meet the 25-year rule. DGRW, by contrast, is dividend-weighted within a quality screen and held many of these names directly. The fund's tech and communications weights were materially higher than NOBL's.
Some of the gap is methodological — a built-in difference in what the two funds can own. Some is regime-specific — a market that paid for the methodology DGRW happens to apply. Disentangling them rigorously requires a Carhart or quality-factor regression, but the directional read is clear: NOBL did not break; the regime did not reward what NOBL is built to capture.
Realized risk: DGRW did not pay for return with risk
The more surprising line in the data is that DGRW did not show meaningfully higher realized risk despite its growth-tilted exposure. Five-year annualized volatility is 14.0% for DGRW versus 14.4% for NOBL, and 5Y max drawdown is −17.3% versus −17.9%. Both pairs are statistical ties — the differences are well inside what you'd expect from sampling noise on a five-year window.
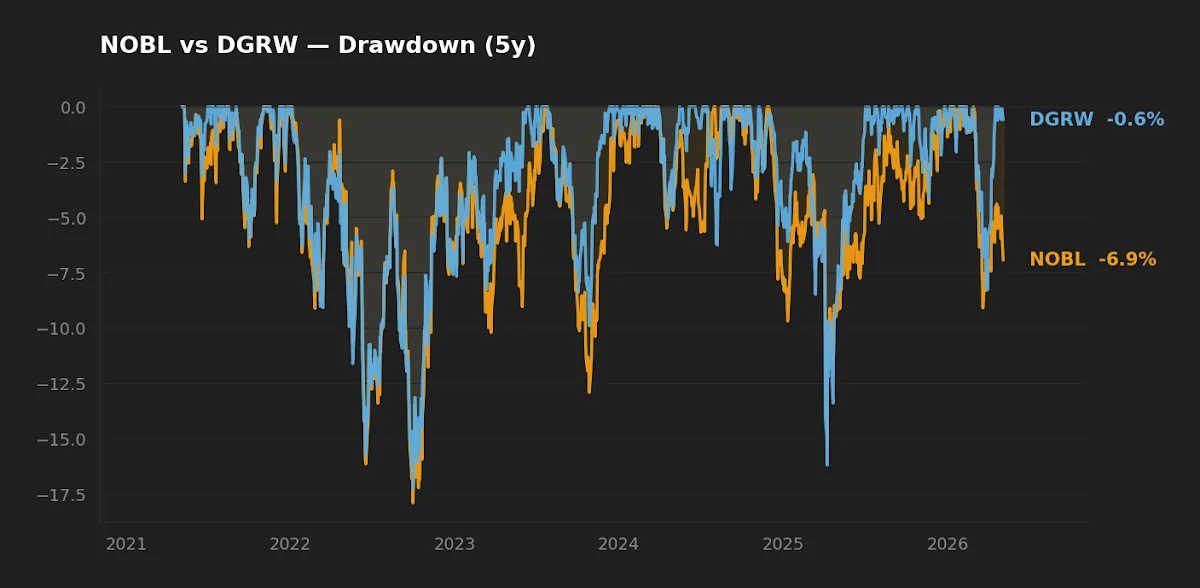
The drawdown chart shows both funds tracking each other closely through the 2022 selloff, with NOBL recovering on roughly the same timeline. NOBL's marketing case — that the Aristocrat screen produces materially smoother performance in stress — does not show up clearly in this window's data. The 2022 episode was a rates-driven equity correction, not a credit-driven solvency crisis. NOBL's design is, in principle, more useful in the second kind of stress than the first. We have not had the second kind in DGRW or NOBL's live history (NOBL inception: October 2013), so neither fund has been tested in a 2008-style environment. Treat that as an open question.
DGRW returned six percentage points more annualized than NOBL over five years and did so with marginally lower volatility — a result that is much more about regime than about the marketing label of either fund.
The yield gap — smaller than it looks at the total-return level
NOBL yields 2.1%; DGRW yields 1.4%. That 71-bp spread is real money for an investor optimizing for current cash distributions, especially in a taxable account where qualified dividend treatment applies to both.
The framing changes at the total-return level. DGRW's 5Y CAGR advantage is roughly 600 bp annualized; the 71-bp yield gap is dwarfed by the price-return contribution. For a reinvesting holder, NOBL's higher current yield was offset many times over by DGRW's faster compounding. For an investor spending dividends today, NOBL hands over more cash up front, but on a smaller and slower-growing base.
For context on the yield level itself: the 10-year Treasury closed at 4.39% on May 1, 2026 (FRED, asof 2026-05-01), with CPI year-over-year at 3.3% and the VIX at 17.0. Both NOBL and DGRW yield well below the risk-free rate. The case for owning either is total return, not relative income to bonds. This is a different argument than it was two years ago at lower long-end yields. Readers thinking primarily about income should compare these funds against intermediate Treasuries and TIPS as well as against each other; the related framing piece on dividend investing in 2026 covers that comparison in more depth.
What this comparison can and cannot tell you
The 5Y CAGR gap is large and statistically meaningful — 600 bp annualized over five years on a quality-tilted equity basket is not noise. What the window cannot tell you is whether the gap persists. The 2020–2025 period was a single regime, and a regime that rewarded the precise factor exposure DGRW tilts toward. If the next decade includes (a) a deep credit-driven recession that punishes high-multiple growth more than defensive staples, or (b) a sustained value rotation, NOBL's construction is structurally better positioned than DGRW's. We have not seen either condition in this window.
Neither fund has a 2008-style stress test in live history. NOBL launched in October 2013; DGRW in May 2013. Both Aristocrat indices and quality-growth indices have backtests through prior cycles, but live-versus-backtest performance for any factor strategy is consistently worse than the simulated history suggests, and any verdict that depends on a single 5-year window is provisional.
Scenarios where each one fits
- Investor in their 30s or 40s, 401(k)/IRA, no current income need: DGRW is the more defensible choice as a single dividend tilt. The 71-bp yield gap is irrelevant in a tax-deferred account, the fee is lower, and the methodology captures growth-of-dividends rather than length-of-payment-streak.
- Investor in or near retirement, drawing on portfolio cash flow: NOBL's higher current yield and defensive sector tilt are more directly useful. The 5Y underperformance is real but partly the result of a regime that may not repeat.
- Investor who already holds VOO, VTI, or QQQM as the core: NOBL adds genuine diversification (lower tech weight, equal weight, defensive sectors). DGRW overlaps more with what a broad-market core already owns. As a satellite to a market-cap-weighted core, NOBL's diversification benefit is larger than DGRW's even if the recent return looks worse.
- Investor wanting both: A 50/50 blend is reasonable. The funds are not interchangeable — they target different factor exposures — and held together they cover both the defensive-quality and quality-growth ends of the dividend-equity space. Compare with the closely related SCHD vs VIG analysis for an adjacent take.
At-a-glance scoreboard
| Category | Winner | Margin |
|---|---|---|
| Cost | DGRW | Modest — 7 bp |
| Realized return (5Y) | DGRW | Material — 610 bp/yr |
| Realized return (10Y) | DGRW | Material — 420 bp/yr |
| Realized risk (5Y) | Tie | Within noise |
| Current income | NOBL | 71 bp yield |
| Defensive-cycle suitability | NOBL | Structural — equal-weight, defensive sectors |
| Long-horizon total return tilt | DGRW | Quality-growth factor exposure |
FAQ
Is DGRW actually AI-driven?
No. DGRW tracks the WisdomTree U.S. Quality Dividend Growth Index, a published rules-based methodology using long-term earnings-growth estimates, ROE, and ROA to rank dividend-paying U.S. stocks. There is no machine-learning model. The "AI" label is marketing/journalistic shorthand that does not match the actual mechanics.
Why has NOBL underperformed DGRW so dramatically over five years?
Two reasons. First, NOBL's 25-year dividend-history rule structurally excludes most of the mega-cap technology names that drove the S&P 500's return from 2023–2025. Second, NOBL is equal-weighted, which underweights mega-caps further. DGRW's dividend-weighted, quality-screened construction owned many of those names directly. Some of the gap is methodology; some is the regime rewarding that methodology.
Is five years long enough to declare DGRW the winner?
No. Five years is a single regime, and one that favored quality-growth specifically. NOBL's design is built more for credit-driven downturns than for rates-driven equity corrections. The next decade may not look like the last.
How do these compare for tax efficiency in a taxable account?
Both distribute primarily qualified dividends, which receive favorable tax treatment in U.S. taxable accounts. NOBL's higher yield means more taxable distribution per dollar held; DGRW's lower yield and higher capital-appreciation share means more of the return defers to long-term capital gains. For high-bracket investors with long horizons in taxable accounts, DGRW's structure is marginally more tax-efficient.
What is the meaningful alternative if neither fund convinces?
For a long-horizon dividend-quality tilt, SCHD remains the most-discussed alternative — see the SCHD-focused analysis for a separate methodology comparison. SCHD sits between NOBL and DGRW in factor exposure: more defensive than DGRW, less narrow than NOBL.
Key takeaways
- DGRW outperformed NOBL by 610 bp annualized over the past 5 years (and 420 bp over 10 years), with marginally lower volatility and drawdown.
- The "AI" framing of DGRW is incorrect. The real exposure is a rules-based quality-growth factor tilt, which has been rewarded in this regime.
- NOBL is not broken — it is built to capture defensive-quality, and the recent regime did not pay for that exposure.
- Neither fund has been tested in a 2008-style credit crisis. Treat the verdict as regime-dependent.
- For investors who want both ends of the dividend-equity space, holding both is a coherent decision; treating them as substitutes is not.
Editor's read
For a long-horizon investor with no immediate income need, DGRW is the more defensible single-fund choice between these two — lower fee, better realized return, similar realized risk, and a factor exposure (quality plus dividend growth) that is more durable than a calendar-based dividend-history rule. The honest caveat: the 5-year window covers a single regime that paid handsomely for that exposure, and we lack a deep-bear-market test for either fund. NOBL's role in a portfolio is real, but it is a satellite role — a defensive-quality complement to a broad-market core — not a competitor to DGRW for the same allocation slot.
Holdings disclosure: The editor does not hold NOBL or DGRW at the time of writing.
Methodology
How this comparison was built. Price- and total-return data, AUM, and trailing-twelve-month dividend yields were pulled from yfinance on 2026-05-05; 5Y and 10Y CAGRs are computed from daily adjusted close data over the trailing window ending on the fetch date. Expense ratios, inception dates, and methodology details came from the issuer fact sheets linked above. Macro context (10-year Treasury, fed funds, VIX, CPI) is from FRED, asof 2026-05-01. Sector exposure and weighting commentary reflects the index methodologies as published by S&P Dow Jones Indices (NOBL) and WisdomTree (DGRW); we did not run a quality-factor regression for this article — that level of analysis is on the roadmap.
This article is for educational purposes and does not constitute personalized financial advice. See full Disclaimer.