COWZ vs. FCTR: Free Cash Flow Focus vs. AI Multi-Factor Optimization
Last updated: 2026-05-05

The short version
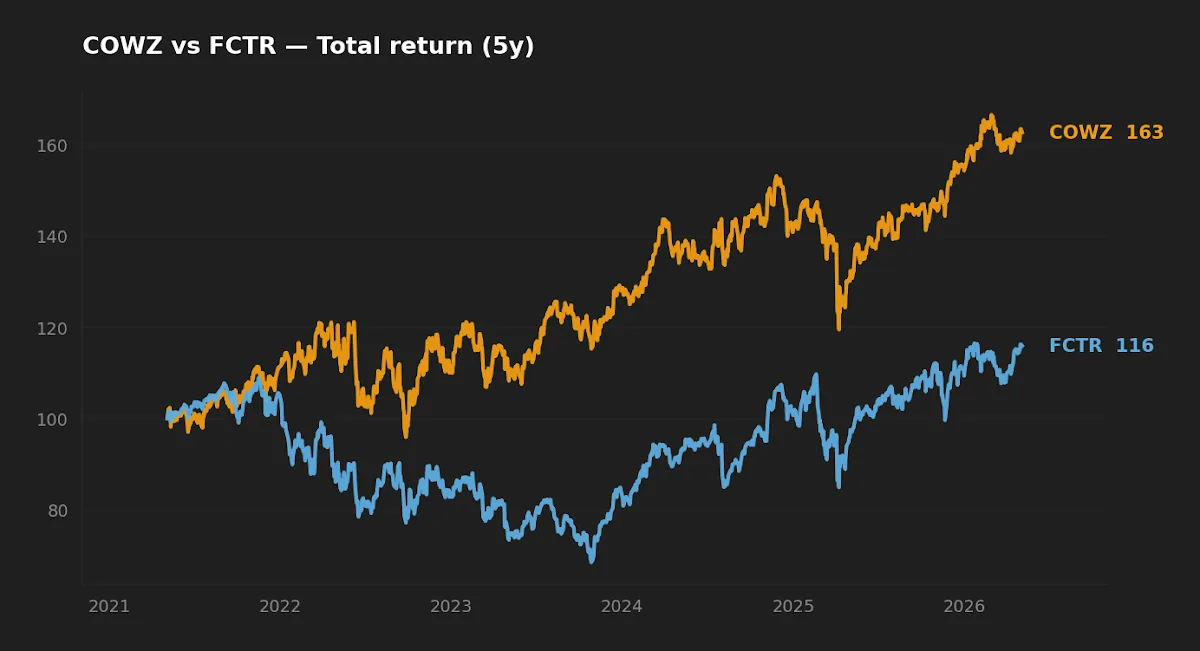
- Over the trailing five years, COWZ compounded at 10.6% per year while FCTR managed 2.9%, with a deeper drawdown — the simpler rule beat the adaptive model by roughly 770 basis points annually.
- FCTR carries a higher fee (0.65% vs. 0.49%) and, after nearly eight years live, has gathered only about $50 million in assets — a level that materially raises closure and bid-ask risk.
- For a long-horizon investor, COWZ has earned its place as a value-leaning satellite. FCTR, on this evidence, has not yet justified its complexity premium.
On paper, FCTR should have been the more interesting story. A model that rotates between high-beta and low-volatility factors based on market regime ought to add value somewhere in a five-year window that included a 2022 drawdown, a 2023 narrow-leadership rally, and the 2024–25 broadening. The data tells a more uncomfortable story: the static cash-flow screen behind COWZ delivered nearly four times the annualized return with less volatility and a shallower trough. This article works through why, and what — if anything — that gap actually predicts.
Two ways to express a quant view
Both COWZ and FCTR sit in the broad universe of rules-based US equity ETFs, but their philosophies diverge on a single question: should the rule itself adapt, or should the rule stay constant and let position-level selection do the work?
Pacer US Cash Cows 100 (COWZ) tracks the Pacer US Cash Cows 100 Index, which screens the Russell 1000 for the 100 names with the highest trailing free-cash-flow yield, weighting holdings by free cash flow itself with a 2% cap. The methodology is static — same rule every quarter, every year, every regime. It is, in the language of Fama-French, a deliberate value tilt expressed through a cash-flow lens rather than a price-to-book lens.
First Trust Lunt U.S. Factor Rotation (FCTR) tracks the Lunt Capital U.S. Large Cap Equity Rotation Index, which uses relative-strength signals to rotate among four factor sleeves: high beta, low volatility, value, and momentum. The pitch is that the model identifies which factor is working in the current regime and concentrates exposure there. It is, conceptually, what an adaptive multi-factor ETF should look like.
The key methodological tension: factor investing rests on long-run risk premia, while factor timing rests on the assumption that those premia are predictable on shorter horizons. The academic literature on factor timing is, charitably, mixed.
The headline numbers
| Metric | COWZ | FCTR | Source |
|---|---|---|---|
| Expense ratio | 0.49% | 0.65% | Issuer fact sheets |
| AUM | $18.2B | $50M | yfinance, 2026-05-05 |
| Inception | 2016-12-16 | 2018-07-25 | Issuer fact sheets |
| Distribution yield (TTM) | 2.1% | 0.4% | yfinance, 2026-05-05 |
| 5Y CAGR | 10.6% | 2.9% | yfinance, 2021–2026 |
| 5Y volatility (annualized) | 17.7% | 19.4% | yfinance, 2021–2026 |
| 5Y max drawdown | −22.0% | −37.1% | yfinance, 2021–2026 |
| NAV (2026-05-05) | $63.53 | $37.84 | yfinance |
Issuer fact sheets: paceretfs.com/products/cowz for COWZ and ftportfolios.com (FCTR) for FCTR.
What the return gap is actually paying for
A 770 bp annual gap over five years is not noise. Compounded, $10,000 invested in COWZ at the start of the window grew to roughly $16,500 versus about $11,500 in FCTR — and that is before the 16 bp annual fee differential. The gap has to come from somewhere. Three candidate explanations and what the data supports:
Sector composition. COWZ's free-cash-flow screen has consistently overweighted energy, consumer discretionary, and select industrials — sectors that produced large cash distributions during the 2022–2024 commodity and reshoring cycle. FCTR's relative-strength model, by construction, gravitated toward whatever was leading on a trailing basis. In a regime where leadership shifted abruptly (2022 from growth to value, 2023 back to mega-cap growth, 2024 broadening), trailing relative strength is a structurally lagging signal.
Factor timing drag. The Lunt rotation methodology shifts among four factor sleeves on signals derived from price action. When regime changes are sharp rather than gradual — as they were in 2022 and again in 2023 — momentum-based rotation tends to enter the new regime late and exit late. The result is buying the previous winner and selling the previous loser exactly when both are about to mean-revert.
Fees and trading costs. The 16 bp expense ratio gap accounts for a small fraction of the underperformance. The larger hidden cost is portfolio turnover: factor-rotation strategies typically run turnover well above static screens, which generates trading friction not captured in the headline expense ratio.
Realized risk: the picture from the drawdown side
The standard pitch for an adaptive factor product is that it should reduce drawdowns, even at some cost to return. The data shows the opposite happened here.
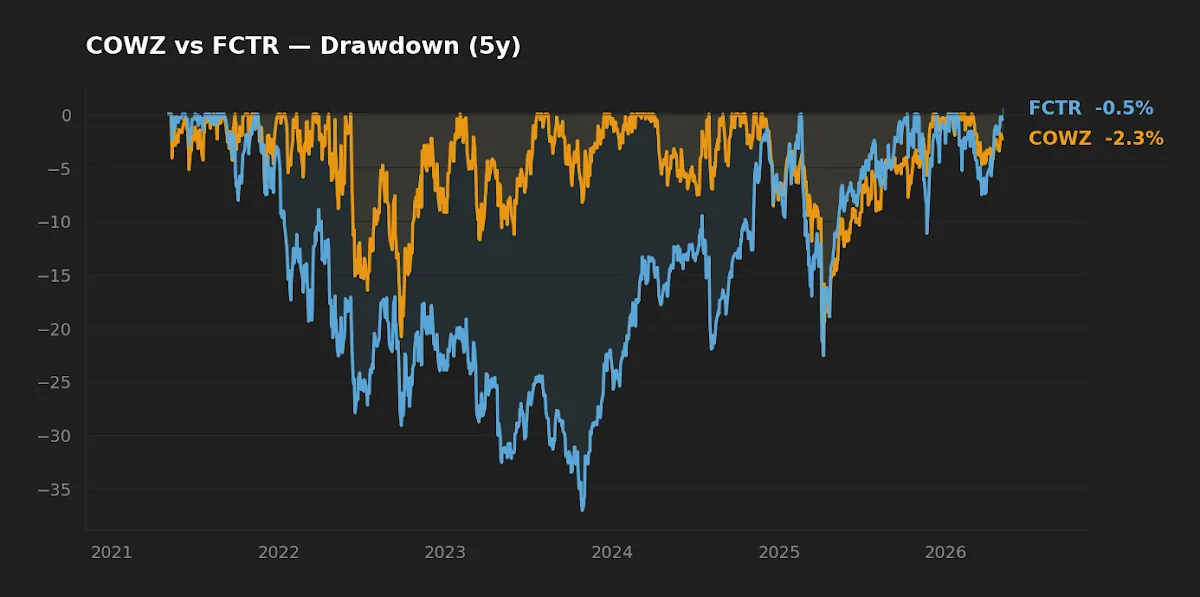
COWZ's worst trough over the window was −22.0%; FCTR's was −37.1%. Annualized volatility was modestly higher for FCTR (19.4% vs. 17.7%), but the drawdown gap is wider than volatility alone would imply, suggesting the rotation methodology was net-long the wrong factor heading into the 2022 sell-off and held that position long enough for the loss to compound.
After nearly eight years of live operation and a 0.65% management fee, FCTR has accumulated about $50 million — a level that sits below the implicit closure threshold most ETF issuers operate against.
Capacity, AUM, and a closure-risk consideration
This is where the story shifts from "performance gap" to "implementation risk." COWZ at $18.2 billion sits comfortably in the scaled-ETF tier — tight bid-ask spreads, deep secondary-market liquidity, no realistic closure risk. FCTR at $50 million does not.
An ETF that has been live since mid-2018 and has not crossed $100 million in assets is in a different operational category than its prospectus suggests. Issuers do not publish hard closure thresholds, but $50 million after almost eight years is the kind of asset profile that triggers internal review. A closure forces taxable distributions on holders in taxable accounts and disrupts any rebalancing plan keyed to the fund. For a long-horizon investor, this is not a small consideration — it changes the expected holding period from "indefinite" to "until the issuer decides otherwise."
This is the kind of friction that doesn't show up in a backtest and is precisely why small-AUM AI-marketed ETFs deserve closer scrutiny than a glance at the methodology pitch suggests.
Macro context for the comparison window
The five years measured here run across a remarkable span: 10Y Treasury yields rose from sub-1% to today's 4.39%, the Fed Funds rate moved from zero to a peak above 5% before easing to 3.64%, and CPI inflation peaked above 9% before settling near 3.3% (FRED, asof 2026-05-01 to 2026-04-01). Cash-rich businesses with limited refinancing risk benefited disproportionately in that environment — exactly COWZ's tilt by construction. A different regime, particularly one with falling rates and renewed mega-cap growth leadership, could compress this gap meaningfully. The five-year window is one regime, not a verdict.
At-a-glance scoreboard
| Category | Winner | Margin |
|---|---|---|
| Cost | COWZ | 16 bp annual |
| Realized return (5Y) | COWZ | Material — ~770 bp/yr |
| Realized risk (5Y drawdown) | COWZ | 15 percentage points shallower |
| Scale & implementation | COWZ | Decisive — 363× AUM |
| Methodological flexibility (theory) | FCTR | Has not yet shown up in results |
FAQ
Does COWZ's outperformance prove cash-flow screens beat factor rotation?
No. It proves that this specific cash-flow screen beat this specific rotation methodology over this specific five-year window — a window biased toward cash-rich, capital-light value names. A different regime could narrow or reverse the gap. What the data does establish is that FCTR has not yet demonstrated the regime-switching value its construction promises.
Is FCTR's small AUM a red flag?
It is a meaningful one. $50 million after almost eight years live is below the level at which most issuers consider funds commercially viable. It is not a guarantee of closure, but it materially raises that risk relative to a scaled fund.
How does COWZ compare to broad value or dividend ETFs?
COWZ is more concentrated and more sector-tilted than broad value ETFs (it ran with elevated energy weight for much of the comparison window). It is also distinct from classic dividend-quality ETFs like SCHD: COWZ rewards businesses that generate cash, regardless of whether they distribute it.
Could FCTR's methodology come back into favor?
Plausible but unproven. Trend-following factor rotation tends to suffer in markets with sharp regime breaks and to do better in markets with persistent leadership. The five-year window included multiple sharp breaks. Whether the next regime favors persistence is unknowable.
Where would COWZ fit in a long-horizon portfolio?
As a satellite tilt within a value-leaning sleeve, sized small relative to broad core exposure. The deliberate sector concentration that drove returns is also what would drive its underperformance in a cap-weighted growth regime — a tradeoff worth owning consciously, not by accident.
What this comparison can and can't tell you
It can tell you that, over 2021–2026, the static cash-flow rule produced materially better outcomes than the adaptive factor rotation, with less drawdown, at lower cost. It can tell you that FCTR's small AUM is a genuine implementation risk separate from its return profile.
It cannot tell you that this gap will persist. Five years is a single regime, and that regime favored cash-rich value disproportionately. It cannot tell you that COWZ's sector concentration will continue to be rewarded, or that FCTR's methodology will continue to lag. It cannot tell you the after-tax outcome for a specific reader — turnover and qualified-dividend treatment differ, and a taxable account would experience these funds differently than a tax-deferred one.
Scenarios where each fund fits
- Investor with broad core exposure and a small value sleeve, tax-deferred account, 20+ year horizon → COWZ as a 5–10% satellite is a reasonable expression of a deliberate cash-flow tilt, sized so the sector concentration doesn't dominate outcomes.
- Investor seeking a single "diversifier" alongside total-market exposure, taxable account → COWZ's higher distribution yield deserves attention for tax drag; the trade is acceptable if the value tilt is wanted, not if it's incidental.
- Investor specifically attracted to FCTR's adaptive methodology → on the current evidence, the case is weak. The fund has not delivered its promised drawdown protection, fees are higher, and AUM raises closure risk. Waiting for either an AUM milestone or a regime in which the rotation demonstrably adds value would be the more disciplined posture.
- Investor who already owns a broad factor ETF → adding FCTR is unlikely to add meaningful diversification on top of a single-factor tilt; the rotation overlay is the differentiator, and that overlay has not earned its complexity premium yet.
Editor's read
If forced to pick between the two, the editor leans clearly toward COWZ. The 770 bp annual return gap, the 15-percentage-point narrower drawdown, and the 363× AUM advantage all point the same direction. FCTR's methodology is conceptually interesting — and conceptually interesting is not, by itself, a reason to allocate capital. After almost eight years of live track record and a higher fee, the burden of proof sits on the rotation strategy to demonstrate that its complexity adds value, and on this five-year window it has not. The editor would revisit FCTR if it crossed $250M in AUM and produced a meaningful drawdown advantage in a stress regime; until then, the simpler rule wins.
The editor does not hold either fund at the time of writing.
Methodology
Price-based metrics (5Y CAGR, volatility, max drawdown) computed from yfinance daily adjusted-close data, window 2021-05-05 through 2026-05-05, dividends reinvested. Expense ratio, AUM, distribution yield, and inception date sourced from issuer fact sheets and confirmed via yfinance. Macro context from FRED (10Y Treasury, Fed Funds, VIX, CPI), asof dates as cited. Holdings methodology described from current prospectus language for each fund's tracked index.
This article is for educational purposes and does not constitute personalized financial advice. See full Disclaimer.