
Photo by Logan Voss on Unsplash
The short version
- Maximum drawdown tells you how deep the hole was; recovery time tells you how long you spent in it. They are not interchangeable.
- Recovery math is convex: a -25% drawdown needs +33% to break even, but -35% needs +54% and -50% needs +100%. Small differences in depth produce large differences in time-underwater.
- For accumulators, duration is a behavior problem. For withdrawers, it is a portfolio-survival problem (sequence risk). Either way, max drawdown alone understates it.
A common shortcut in retail risk reporting is to summarize a fund's downside with a single number: maximum drawdown. It is convenient and quotable. It is also incomplete. The number tells you the worst peak-to-trough loss observed over a window, but it says nothing about how long the portfolio spent underwater — which, for most actual investors, is the more consequential question.
This piece uses SPY and QQQ as the working example because both are heavily held, well-documented, and have measurably different drawdown signatures even though both are large-cap US equity exposures. The thesis applies to any long-horizon allocation: when you size a risk budget, depth and duration deserve separate attention.
What the two metrics actually measure
Maximum drawdown (MDD) is the largest percentage decline from a prior all-time high observed over the analysis window. Standard implementations compute it on a rolling basis and report the single worst observation. Recovery time — sometimes called drawdown duration or time-to-recover — measures how many trading days the cumulative return spent below that prior high before returning to it. Both metrics derive from the same equity curve. Both are valid. They answer different questions.
The reason it matters: two funds with identical max drawdowns can have completely different recovery profiles. A -30% drawdown that retraces in nine months is a tactical setback. A -30% drawdown that takes four years to repair is a structural problem — particularly if the investor is withdrawing from the portfolio, contributing on a fixed schedule, or simply trying to stay disciplined without flinching.
The fund data
| Metric | SPY | QQQ |
|---|---|---|
| Issuer | State Street (SSGA) | Invesco |
| Expense ratio | 0.09% | 0.18% |
| AUM | $735.1B | $440.3B |
| Distribution yield (trailing) | 1.0% | 0.4% |
| Inception | 1993-01-22 | 1999-03-10 |
| 5Y CAGR | 13.8% | 17.6% |
| 10Y CAGR | 15.5% | 21.8% |
| 5Y annualized volatility | 17.1% | 22.4% |
| 5Y maximum drawdown | -24.5% | -35.1% |
| Fact sheet | SSGA | Invesco |
Source: yfinance pulled 2026-05-16 for price-derived statistics; issuer fact sheets for AUM, expense ratio, and methodology.
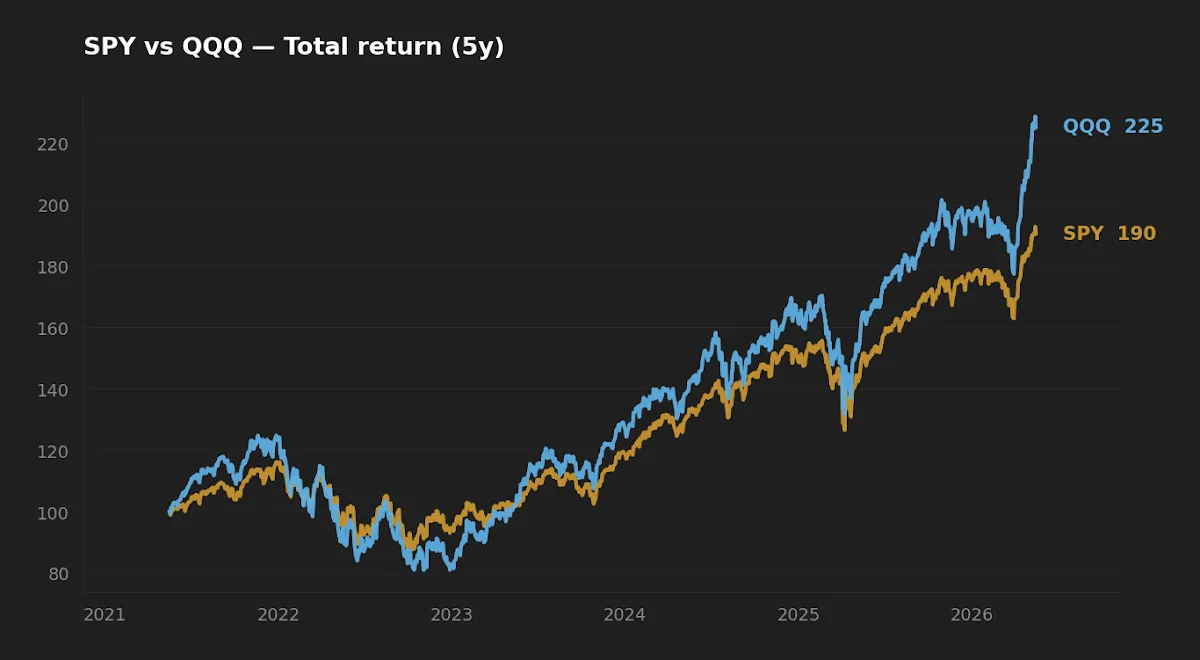
Why depth and duration tell different stories
The math of recovery is unforgiving and asymmetric. The required cumulative return to climb back from a drawdown D is 1 / (1 − D) − 1. Some reference values:
| Drawdown | Gain required to recover | Years to recover at 8% CAGR |
|---|---|---|
| -10% | +11.1% | ~1.4 |
| -20% | +25.0% | ~2.9 |
| -25% | +33.3% | ~3.7 |
| -35% | +53.8% | ~5.6 |
| -50% | +100.0% | ~9.0 |
| -60% | +150.0% | ~11.9 |
For SPY's -24.5% drawdown observed in the last five years, breakeven requires a +32.4% cumulative gain. For QQQ's -35.1%, it requires +54.1%. At a long-run nominal CAGR of ~8% (a deliberately rough placeholder — the actual realized rebound rate is what determines the schedule, and rebound regimes are rarely the long-run average), those gains compound over very different time scales. The convexity in the table is the entire point: every additional five percentage points of drawdown adds disproportionately more to the recovery requirement.
This is why the gap between SPY and QQQ at -24.5% and -35.1% is mathematically larger than the headline 10.6-percentage-point difference suggests. Going from "need +32%" to "need +54%" is a 67% increase in the required cumulative return, not a 43% one.
The 2022 cycle: same family, different recovery
SPY and QQQ entered the 2022 drawdown together, driven by the same macro impulse: rapid Fed tightening and multiple compression on long-duration cash flows. QQQ took more damage on the way down, owing to higher effective duration in its constituent cash flows and heavier weighting toward growth-priced names. But QQQ also recovered faster than its depth would naively imply, because the rebound was led by the same mega-cap names that had been disproportionately punished. The asset class that drove the loss also led the gain.
So the two metrics told different stories. Max drawdown said QQQ was the riskier holding by roughly 10 percentage points. Recovery time said the gap was narrower than depth suggested, because the post-drawdown leadership concentrated in QQQ's heaviest weights. The chart below shows the underwater path — how long each ETF spent below its prior high — over the past five years.
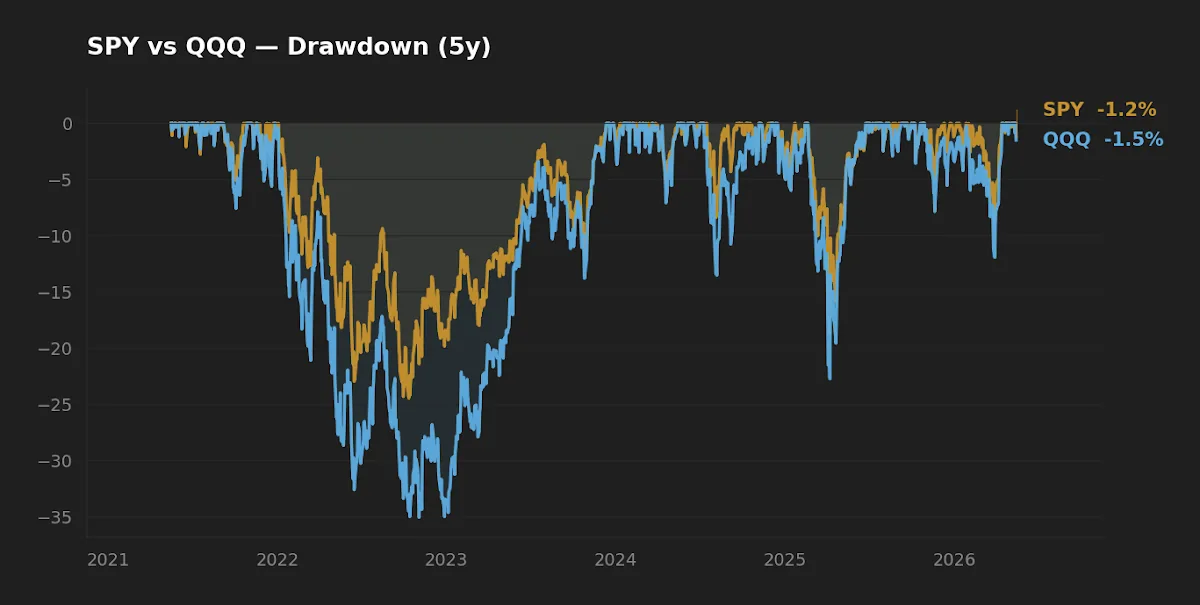
The shape matters. A drawdown chart that returns to the zero line quickly is psychologically and mathematically different from one that traces a long flat-bottom basin. The 2000–2007 Nasdaq experience, outside the 5-year window we have data for here, is the cautionary version: QQQ took roughly 15 years to recover its March 2000 high in nominal terms. That kind of duration is completely invisible in a max drawdown number alone, and it is the precise reason the editor tracks both.
Max drawdown is a snapshot of the wound. Recovery time is the length of the hospital stay. The portfolio that survives the worst combinations of both is the one that gets to keep compounding.
Why this matters more than most retail framing admits
For an investor in pure accumulation phase with a long horizon, drawdown duration is partly a behavior problem (can you stay invested through the basin without selling?) and partly an opportunity-cost problem. Contributions made during the drawdown buy at lower prices, which is good; but contributions made into a still-falling market take their own time to recover, which the average-down narrative often glosses over. A staged numerical breakdown of investing into a crash walks through what that DCA math actually looks like across the five phases of a downturn.
For an investor in withdrawal phase — drawing systematic income from the portfolio — drawdown duration becomes a portfolio-survival problem. The formal name is sequence-of-returns risk. A retiree who experiences a -35% drawdown in the first five years of withdrawals will deplete the portfolio much faster than one who experiences the same -35% drawdown twenty years in, because dollars withdrawn during the early drawdown lock in losses that compound forward against the surviving balance. Two retirees with identical average returns over a 30-year horizon can have wildly different ending balances depending purely on when the drawdowns arrived. The final five years of an accumulation plan are particularly exposed to this asymmetry, because the largest dollar amounts are at risk just before the withdrawal phase begins.
What the macro backdrop is doing to drawdown probabilities now
The current backdrop (10-year Treasury at 4.47%, VIX at 17.26, headline CPI at 3.9% year-over-year — FRED, asof April-May 2026) is neither obviously calm nor obviously stressed. Realized volatility on the major indices has compressed, but the discount rate is materially higher than the 2010s baseline. Higher discount rates mathematically imply lower price-multiple ceilings, all else equal. That observation does not predict the timing of the next drawdown — no one credible does — but it does shape how deep one could get if multiples re-rate further from current levels.
The actionable point is not to forecast the next drawdown. It is to know, before one arrives, what your honest recovery-time tolerance is and whether your allocation reflects it. An investor who would behaviorally capitulate at month 18 of a basin should not be in an allocation whose realistic recovery window is three years or more. Capital preservation as a precondition for compounding covers the same idea from the other direction.
At-a-glance scoreboard
| Category | Better signal | Why |
|---|---|---|
| Cost | SPY (0.09%) | Half the expense ratio of QQQ (0.18%). |
| 5Y realized return | QQQ (17.6% CAGR) | Mega-cap growth leadership rewarded concentration. |
| 5Y depth of drawdown | SPY (-24.5%) | 10.6pp shallower than QQQ. |
| Recovery convexity | SPY | Required +32% to break even vs +54% for QQQ. |
| Duration tolerance required | SPY | Shorter time-underwater on the 2022 cycle, smaller behavioral stress test. |
FAQ
Q: If I'm a long-term investor, doesn't drawdown depth eventually wash out?
Mathematically, yes — given enough time and continued positive expected returns. Behaviorally and for withdrawers, no. The time spent recovering is not free; it is the period during which a forced seller is realizing the loss and a fixed-schedule withdrawer is depleting principal at a lower base. Long horizon is necessary but not sufficient.
Q: Why use SPY versus QQQ rather than a higher-vol comparison?
Because the framing is meant to be useful for mainstream allocations. Both are widely held, both have institutional-grade data, and the 10-percentage-point depth gap is large enough to illustrate convexity without veering into leveraged or thematic territory where the lesson would be obvious.
Q: Does the same logic apply to leveraged ETFs?
Even more so. Daily-reset leverage compounds the drawdown asymmetry, because the path back from a deep drawdown is degraded by volatility drag in addition to the basic break-even math. The compounding mechanics of leveraged ETFs covers why duration is the binding constraint there, not depth.
Q: How should an investor actually use drawdown recovery time in portfolio design?
Three concrete uses: (1) stress-test the allocation against historical recovery windows for each sleeve, not just historical depths; (2) for withdrawers, model the sequence-risk outcome under both a deep-fast and a shallow-slow scenario, not just average-return assumptions; (3) for accumulators, decide in advance the maximum duration the allocation could go underwater without changing the contribution plan.
Q: Is maximum drawdown still useful?
Yes. It is a fast comparative summary and it captures the worst-case point estimate, which is meaningful for liquidity planning and risk-budget conversations. The argument here is not to discard it; it is to refuse to rely on it alone.
Key takeaways
- Max drawdown and recovery time measure different aspects of the same equity curve. Tracking only one understates risk to the investor.
- Recovery math is convex. Every additional five points of drawdown raises the required breakeven gain disproportionately, which translates into disproportionately longer time-underwater.
- For withdrawers, recovery duration interacts with sequence-of-returns risk and can dominate average-return assumptions in determining portfolio survival.
- For accumulators, duration is primarily a behavior constraint: the longer the basin, the higher the probability of capitulation and the larger the cost when it happens.
- The honest use of these metrics is pre-commitment: knowing your duration tolerance before the drawdown arrives, not negotiating with yourself during one.
Editor's read
The editor tracks both metrics in the in-house weekly portfolio review and weights duration more heavily than depth when sizing equity exposure in the long-horizon core. The reasoning is simple: a temporary -35% loss is survivable if it lasts 18 months and unsurvivable if it lasts a decade, and the second case is not visible in any single max-drawdown number. The framing here is not a verdict on SPY versus QQQ — both are reasonable broad-equity exposures — but a reminder that the right risk metric depends on what the investor actually has to live through.
The editor's published target allocation includes broad-market US equity exposure but does not specifically hold either SPY or QQQ as standalone positions at the time of writing.
Methodology: price-derived statistics (CAGR, volatility, max drawdown) computed from total-return-adjusted daily closes via yfinance, pulled 2026-05-16, over the trailing 5- and 10-year windows ending on that date. AUM, expense ratio, and inception data from issuer fact sheets (SSGA for SPY, Invesco for QQQ). Macro indicators from FRED series DGS10, DFF, VIXCLS, and CPIAUCSL, asof dates listed inline. Recovery-gain math is the closed-form 1/(1−D)−1.
This article is for educational purposes and does not constitute personalized financial advice. See full Disclaimer.