
The short version
- Over the last five years, TQQQ delivered a 27.0% CAGR while QQQM delivered 17.6% — a ratio of 1.53x, not the 3x the leverage label implies. Realized variance drag and financing cost account for most of the gap.
- Maximum drawdowns scale super-linearly: QQQM −35.0% vs TQQQ −81.7%. Recovery from −81.7% requires +446% just to break even, which is the path-dependency tax most retail discussions skip.
- The headline misunderstanding is not "leverage is bad" — it is "leveraged ETFs deliver the index return × N." They do not, and the gap widens with volatility and financing rates.
The most common pitch for daily-rebalanced leveraged ETFs is that they "give you Nx the index." The most common counter-pitch is that they are "only for day trading." Both framings collapse on contact with the actual five-year record. The interesting question is what the realized numbers tell us about the gap between leverage in theory and leverage in a portfolio.
What a daily-rebalanced leveraged ETF actually does
TQQQ, UPRO, and QLD do not promise a multiple of the long-horizon index return. They promise a multiple of the daily return, reset every session. The prospectus language is explicit: "before fees and expenses, three times the daily performance." That single word — daily — is where most retail intuition breaks. A daily-reset 3x fund in a market that goes +1% then −1% loses money on the round trip, even though the index is essentially flat: (1 + 0.03)(1 − 0.03) = 0.9991. Repeat that asymmetry across 1,260 trading days and the compounded gap is large.
Mechanically, the funds use total return swaps and short-dated futures to obtain the leveraged exposure. The financing leg costs roughly the broker overnight rate plus a spread on the borrowed notional. With the federal funds rate at 3.64% (FRED, asof 2026-04-01), the embedded financing drag on a 3x product is on the order of 5–8% per year on top of the 0.82% expense ratio. None of this appears on the fact sheet's "leverage ratio" line.
Five-year realized numbers
Data below is from yfinance (price/total return, daily, trailing five years through 2026-05-16) and issuer fact sheets for expense ratio and AUM.
| Ticker | Exposure | ER | AUM | 5Y CAGR | 5Y vol | 5Y max DD |
|---|---|---|---|---|---|---|
| TQQQ | 3x Nasdaq-100 daily | 0.82% | $31.3B | 27.0% | 66.6% | −81.7% |
| QLD | 2x Nasdaq-100 daily | 0.95% | $12.0B | 24.9% | 44.8% | −63.7% |
| UPRO | 3x S&P 500 daily | 0.89% | $4.7B | 23.1% | 50.4% | −63.9% |
| QQQM | 1x Nasdaq-100 | 0.15% | $82.9B | 17.6% | 22.3% | −35.0% |
| VOO | 1x S&P 500 | 0.03% | $1,600.2B | 13.9% | 16.8% | −24.5% |
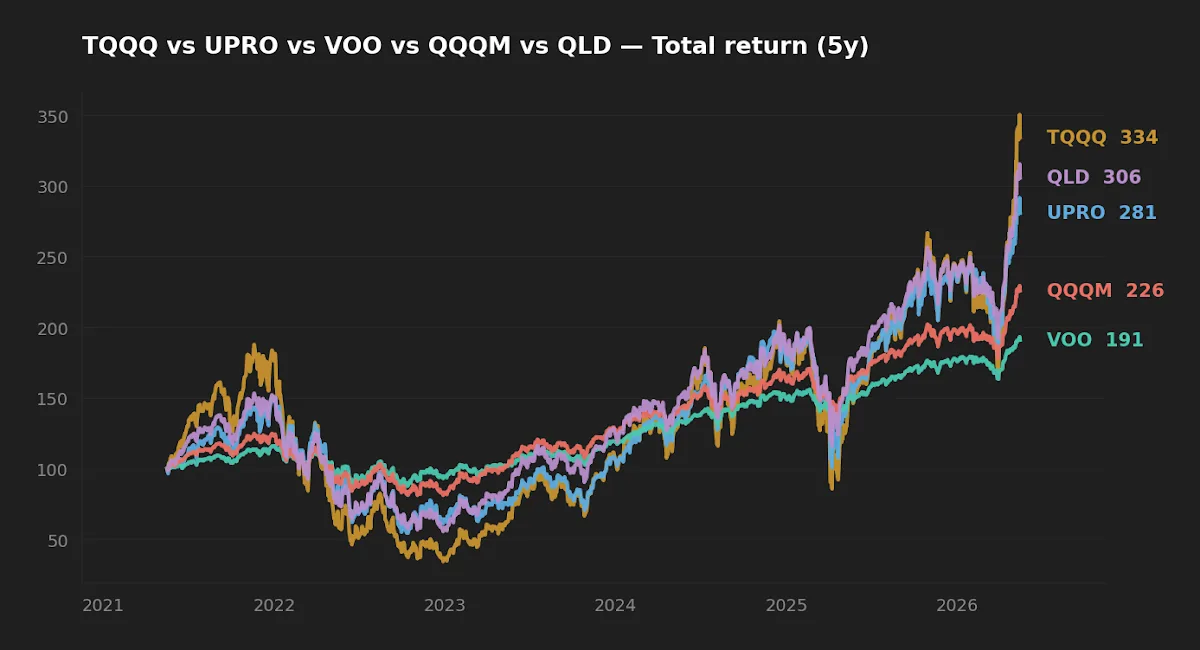
Two patterns jump off the page. First, the realized multiple is well below the leverage label: TQQQ's CAGR is 1.53x QQQM, not 3x; QLD is 1.41x QQQM, not 2x; UPRO is 1.66x VOO, not 3x. Second, volatility scales almost exactly linearly — TQQQ's 66.6% is 2.98x QQQM's 22.3% — but the drawdowns scale faster than that.
Why the realized multiple is lower than the label: variance drag
The classic decomposition for a leveraged daily product is approximately: leveraged log return ≈ N × (log return of underlying) − ½ × N × (N − 1) × σ² − financing − fees. The middle term is the variance drag. For a 3x product on an underlying with 22% volatility, the drag is roughly ½ × 3 × 2 × 0.22² ≈ 14.5% per year. Add ~8% financing and 0.82% expense ratio, and the expected annual drag versus 3× the index return is in the low 20s.
The five-year arithmetic matches. Theoretical 3 × QQQM CAGR = 52.8%. Realized TQQQ CAGR = 27.0%. Gap ≈ 25.8% per year, which is well within the variance-drag-plus-financing estimate above. The same arithmetic on QLD (theoretical 2 × 17.6% = 35.2%, realized 24.9%, gap ≈ 10.3%) is smaller in absolute terms because the N(N−1) term grows quadratically — 2x has a coefficient of 2, 3x has a coefficient of 6.
Initially I thought the realized 5-year window flattered the leveraged funds because the period contained a strong AI-driven trend. Then I ran the variance-drag math against rolling-window volatility, and the answer was that even in this favorable regime, 3x compounded to 1.53x the underlying — not 3x. The product is structurally a high-volatility, high-financing-cost bet on persistent uptrends with low realized variance. When either of those tailwinds reverses, the math gets ugly fast.
Path dependency and the recovery problem
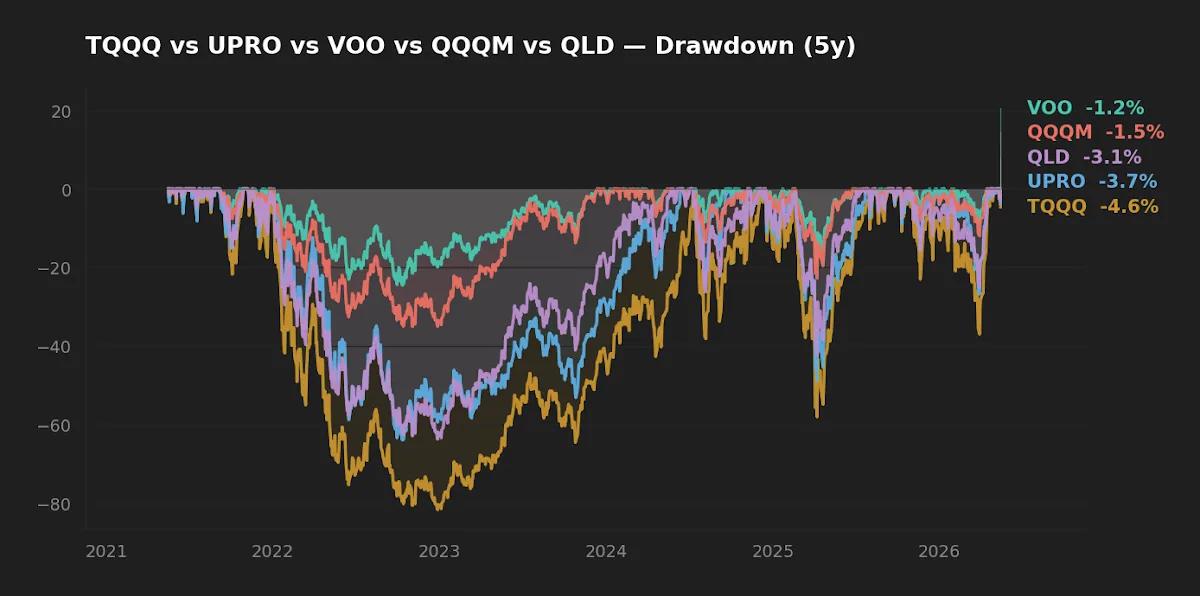
QQQM's worst five-year drawdown was −35.0%, requiring a +53.8% gain to recover. TQQQ's was −81.7%, requiring a +446% gain to recover. UPRO's was −63.9%, requiring +177%. These are not abstract numbers — they are the actual lived experience of anyone who held through the 2022 drawdown. The behavioral implication is that the investor who can stomach a −35% paper loss in a 1x fund may genuinely not be the same investor when the loss is −82% and the recovery path stretches over multiple years.
A 3x leveraged ETF does not give you 3x the index return. Over the last five years it gave you 1.53x — and the path you had to walk to collect it included a drawdown that takes roughly four-and-a-half-fold gains to recover from.
The recovery math also interacts unkindly with financing rates. The current 10-year Treasury yield is 4.47% (FRED, asof 2026-05-14), and the federal funds rate is 3.64% — both materially higher than the 2020–2021 environment in which most TQQQ long-hold case studies were written. Higher overnight rates mean a larger financing drag inside the swap leg, which lengthens the recovery from any given drawdown.
Where the long-hold case actually has merit (and where it doesn't)
It is fair to say that the literature on lifecycle investing (e.g., Ayres and Nalebuff's work on time-diversified leverage) makes a real theoretical case for modest leverage during the early-career accumulation phase. The implementation detail that matters: that case is for modest, persistent leverage — roughly 1.5x to 2x — applied to a globally diversified core, not 3x concentrated in a single high-volatility index.
QLD at 2x Nasdaq-100 occupies a different point on the spectrum than TQQQ at 3x. Its 5-year variance drag is meaningfully smaller, its drawdown was −63.7% rather than −81.7%, and its realized 1.41x multiple of QQQM is closer to the label than TQQQ's 1.53x of 3x. None of this makes QLD a core holding. It does, however, make the difference between "tactical satellite" and "leveraged lottery ticket" worth distinguishing. For a deeper dive into the 2x bracket specifically, see QLD vs SSO: Comparing 2x Leveraged ETFs for Long-Term Core Portfolios.
The behavioral gap is real, but it is downstream of the structural gap
Investor-return studies (Morningstar's "Mind the Gap" being the most cited) consistently find that the average dollar in a fund earns less than the average share, because flows chase performance. The gap is wider in high-volatility funds. None of that is in dispute. The point worth making is that for daily-leveraged ETFs, the structural gap between the leverage label and the realized multiple is itself larger than the typical behavioral gap. Even an investor with perfect discipline who held TQQQ for the full five years collected 1.53x of QQQM, not 3x. The behavioral gap compounds on top of that, but it is not the headline story.
This is also why the framing in The Math of Leveraged ETF Decay matters: "decay" is not a myth, but it is also not a constant tax. It is a function of realized variance and financing rates, both of which the holder cannot control.
Scoreboard
| Category | Winner | Why |
|---|---|---|
| Cost | VOO (0.03%) | 27x cheaper than TQQQ; the gap compounds. |
| Realized risk (5Y max DD) | VOO (−24.5%) | Lowest drawdown; recovery path manageable. |
| Realized return (5Y CAGR) | TQQQ (27.0%) | Highest CAGR in this window — but path-dependent. |
| Risk-adjusted suitability for a long-term core | VOO / QQQM | The leveraged funds' realized multiple does not justify the drawdown for core capital. |
FAQ
Q: Doesn't the 27% TQQQ CAGR prove leverage works long-term?
It proves leverage worked in this specific five-year window, which contained a strong trend and a relatively narrow variance regime by historical standards. The −81.7% drawdown in the same window is the counter-evidence. The honest reading is "in trending markets with contained volatility, leveraged ETFs deliver a multiple of the underlying that is lower than the label but still positive; in choppy or declining markets, the math goes the other way."
Q: Why isn't 3x leverage giving 3x returns?
Daily reset plus volatility. The leveraged fund rebalances every day to maintain its multiple, which means it sells into declines and buys into rallies. This guarantees underperformance versus a static 3x position in choppy markets — a phenomenon usually called volatility decay or variance drag.
Q: Does the higher Fed funds rate actually matter for TQQQ holders?
Yes. The swap counterparty charges roughly the overnight rate plus a spread on the borrowed leg. At a 3.64% Fed funds rate (FRED, 2026-04-01), the embedded financing cost on a 3x product is several hundred basis points higher than it was when the fund launched in 2010. This is a quiet headwind that compounds.
Q: What about UPRO instead of TQQQ — is S&P 500 leverage safer?
The S&P 500's lower realized volatility (VOO 5Y vol 16.8% vs QQQM 22.3%) does reduce the variance drag, which is why UPRO's −63.9% drawdown was less severe than TQQQ's. But UPRO's 5Y CAGR (23.1%) is also lower, and it still carries the 0.89% expense ratio plus financing. "Safer" is a relative word here.
Q: Could a small sleeve (5–10%) of TQQQ in an otherwise diversified portfolio be reasonable?
That is the steelman case for inclusion, and it has academic support in the lifecycle-leverage literature. The honest acknowledgment is that even a 5% sleeve in TQQQ can swing a portfolio's risk profile meaningfully because of the volatility. Whether it belongs in the long-horizon core or stays as a behavioral-budget satellite is a function of the investor's actual tolerance during an 80%+ drawdown — which most people overestimate before they have lived through one.
Q: How does the current 17.26 VIX level affect the analysis?
The VIX at 17.26 (FRED, asof 2026-05-14) is a below-average regime, which is friendly to leveraged products: low realized variance means less drag. The danger is exactly that — the math looks best in the regime in which long-term holders are most likely to be tempted in.
What this comparison can and can't tell you
Five years is one regime, not a sample. The window analyzed here (2021–2026) contains a major drawdown in 2022 and a strong recovery, but it does not contain a sustained sideways or declining decade — the conditions under which leveraged ETFs perform worst. The 10-year CAGR figures (TQQQ 44.9%, UPRO 30.1%, QLD 35.8%) look even more impressive, but they are anchored in a period that began near the 2016 lows and included the longest equity bull run in postwar history. Neither window includes the kind of multi-year, high-volatility drawdown that would stress-test the variance-drag math at its worst. Reading these returns as a steady-state expectation is a category error.
Scenarios where each fund fits
- Reader in 30s, taxable account, primary goal is long-horizon compounding → VOO or QQQM as the core. Leveraged exposure, if any, in a small behavioral-budget sleeve, sized so that an 80% drawdown does not change the financial plan.
- Reader in 40s, 401(k)-only, no current high-beta exposure → VOO or QQQM. The leveraged funds are typically not available in employer plans for good reason.
- Reader with a deliberate, sized tactical allocation and a written rebalancing rule → QLD is the more defensible 2x bracket. TQQQ remains a stress test of behavioral discipline more than of math.
- Reader using leverage as a get-rich-faster shortcut → the realized 1.53x multiple over five years should reframe the expectation. See Why Capital Preservation Is the Secret to Winning with Leveraged Assets.
Editor's read
If asked to pick from this group for a long-horizon core, the editor leans heavily toward VOO and QQQM. The realized 1.53x multiple TQQQ delivered over five years — in arguably its most favorable regime — is not a structural argument for 3x leverage; it is a reminder that the leverage label and the realized return are different objects. Leveraged products have a defensible role as small, sized, rules-based satellites for investors who have actually walked through an 80% drawdown and not flinched. Most have not, and predicting one's own behavior in a regime never experienced is the single most expensive forecasting error in this asset class.
Holdings disclosure: the editor holds neither TQQQ, UPRO, nor QLD at the time of writing. The editor holds positions in broad-market 1x equity ETFs in the long-horizon core.
Methodology
Price and total-return data from yfinance, daily series, trailing five years through 2026-05-16. Expense ratio and AUM from issuer fact sheets (ProShares for TQQQ/UPRO/QLD, Vanguard for VOO, Invesco for QQQM), pulled the same day. Macro context (Fed funds rate, 10Y Treasury, VIX, CPI) from FRED, with as-of dates noted inline. CAGR computed as the geometric mean of daily total returns annualized by 252; volatility as the annualized standard deviation of daily log returns; maximum drawdown as the largest peak-to-trough decline on a daily close basis within the window.
This article is for educational purposes and does not constitute personalized financial advice. See full Disclaimer.