
The short version
- Daily-reset leveraged ETFs are not buy-and-hold instruments. Holding-period return depends on the realized path of the underlying, not just its start and end points, and on a financing cost that scales with the short rate.
- The 5-year window through May 2026 happens to make every product in this family look good. The 5-year peak-to-trough drawdowns — TQQQ at -81.7%, UPRO at -63.9%, QLD at -63.7%, SSO at -46.7% — describe what the holder actually lived through.
- A small (≤10%), rule-managed sleeve in a tax-advantaged account is the only configuration where the math is defensible. Sizing, rebalancing bands, a trend exit, and low-correlation ballast work as a system; remove any one and the other three lose most of their effect.
The interesting question is not whether a long-horizon investor can hold a leveraged ETF — many have, with very mixed experiences — but whether the structural costs of the daily-reset mechanism can be controlled tightly enough that the position behaves like a calculated bet rather than an unforced error. The answer is conditional, and the conditions are strict.
This piece sets out the framework needed to hold a small leveraged sleeve responsibly inside a long-horizon portfolio: the math behind the daily reset, what the realized 5- and 10-year numbers actually look like, the four risk levers with evidence behind them, and the investor profiles where this configuration is defensible.
What "leveraged ETF" actually means at the product level
A daily-reset leveraged ETF — TQQQ (3x Nasdaq-100), UPRO (3x S&P 500), QLD (2x Nasdaq-100), SSO (2x S&P 500) — does not promise the stated multiple of the underlying's return over arbitrary holding periods. It promises that multiple over a single trading day, achieved with total-return swaps and futures whose exposure is reset each evening. Issuer prospectuses warn at length that holding periods longer than one day can produce returns "substantially different" from the daily multiple.
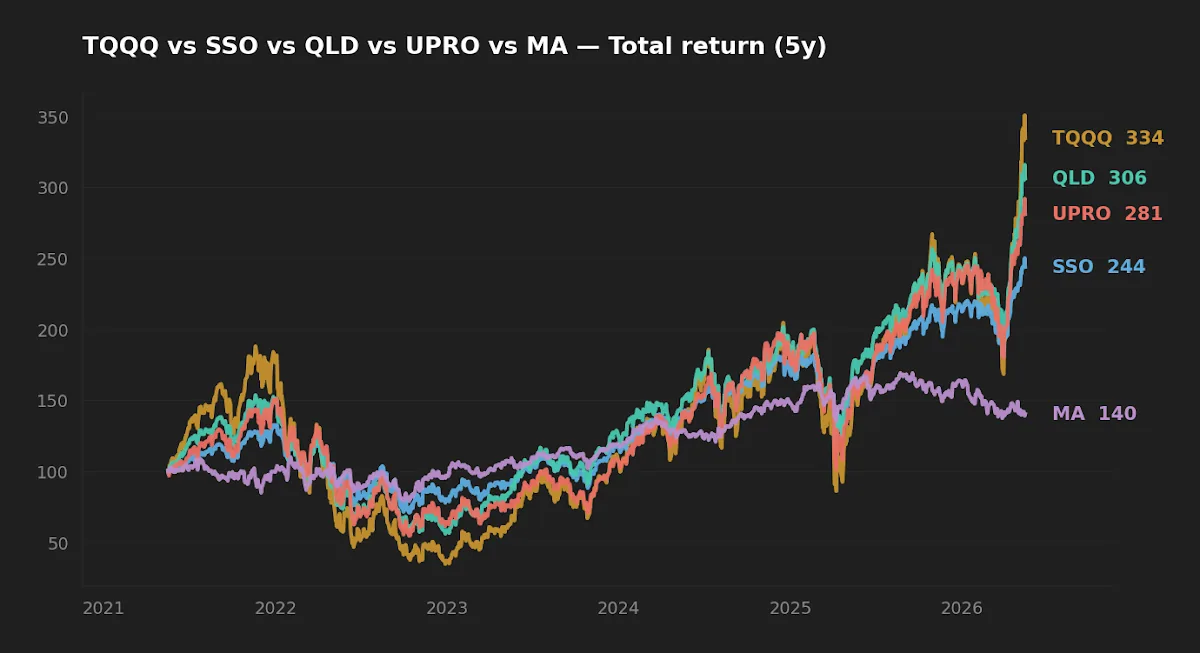
Here are the four products most often discussed in this context, with figures pulled from yfinance and issuer fact sheets on 2026-05-16:
| Ticker | Underlying / Exposure | ER | AUM | 5Y CAGR | 10Y CAGR | 5Y vol | 5Y max DD |
|---|---|---|---|---|---|---|---|
| SSO | S&P 500, 2x daily | 0.87% | $7.3B | 19.6% | 24.2% | 33.7% | -46.7% |
| QLD | Nasdaq-100, 2x daily | 0.95% | $12.0B | 24.9% | 35.8% | 44.8% | -63.7% |
| UPRO | S&P 500, 3x daily | 0.89% | $4.7B | 23.1% | 30.1% | 50.4% | -63.9% |
| TQQQ | Nasdaq-100, 3x daily | 0.82% | $31.3B | 27.0% | 44.9% | 66.6% | -81.7% |
Source: yfinance (price, return, drawdown) and ProShares product pages (expense ratio, AUM, structure), pulled 2026-05-16. Returns are gross of investor-level taxes. Verify against current prospectuses before any allocation decision.
The arithmetic that makes long holding hard
Two structural taxes dominate the long-horizon conversation, and any "hold leverage forever" thesis has to clear both.
The first is variance drag. If the underlying gains 1% then loses 1% on consecutive days, it ends roughly flat. A 2x daily-reset version gains 2% then loses 2%, ending at 0.9996 — a 4 bp loss from a round trip in the underlying. The drag scales with realized variance and with the leverage factor, and the realized 5-year volatility numbers above are not trivial: 66.6% for TQQQ, 50.4% for UPRO, 44.8% for QLD, 33.7% for SSO. Over multi-year holding periods through volatile regimes, this drag is large enough to consume any leverage premium.
The second is financing. Daily-reset leverage requires a roll cost on the swap leg approximately tied to the short-term financing rate. With the fed funds rate at 3.64% (FRED, asof 2026-04-01) and the 10-year Treasury at 4.47% (FRED, asof 2026-05-14), a 3x product implicitly borrows roughly 2x of NAV at the short rate — call it ~7% per year of embedded financing cost versus near-zero in the 2020–2021 era. The product's structure didn't change; the macro regime did. An investor running a since-inception backtest of TQQQ is implicitly assuming a financing-cost regime that no longer applies.
Initially the editor expected these two effects to roughly cancel inside a 5-year window where realized index volatility had been moderate. They don't. The TQQQ 5-year CAGR of 27.0% looks like a fair multiple of the underlying Nasdaq-100's annualized return over the same period, but the 5-year max drawdown of -81.7% is what the holder actually had to sit through to capture it. The arithmetic mean of returns is not what compounds in a real account; the geometric mean does, and the geometric mean is what the drawdown column makes visible.
Realized risk: what the 5-year window actually shows
The 5-year drawdown column is the most useful single number in the table. It is not a model output; it is what the worst rolling 5-year experience inside this window did to capital. Sized relative to the leverage factor, the relationship is roughly linear: SSO at 2x took a -46.7% peak-to-trough, UPRO at 3x took -63.9%, QLD at 2x on the more concentrated Nasdaq-100 took -63.7%, and TQQQ at 3x on Nasdaq-100 took -81.7%. Each step in either dimension — leverage factor or underlying concentration — adds meaningful drawdown.
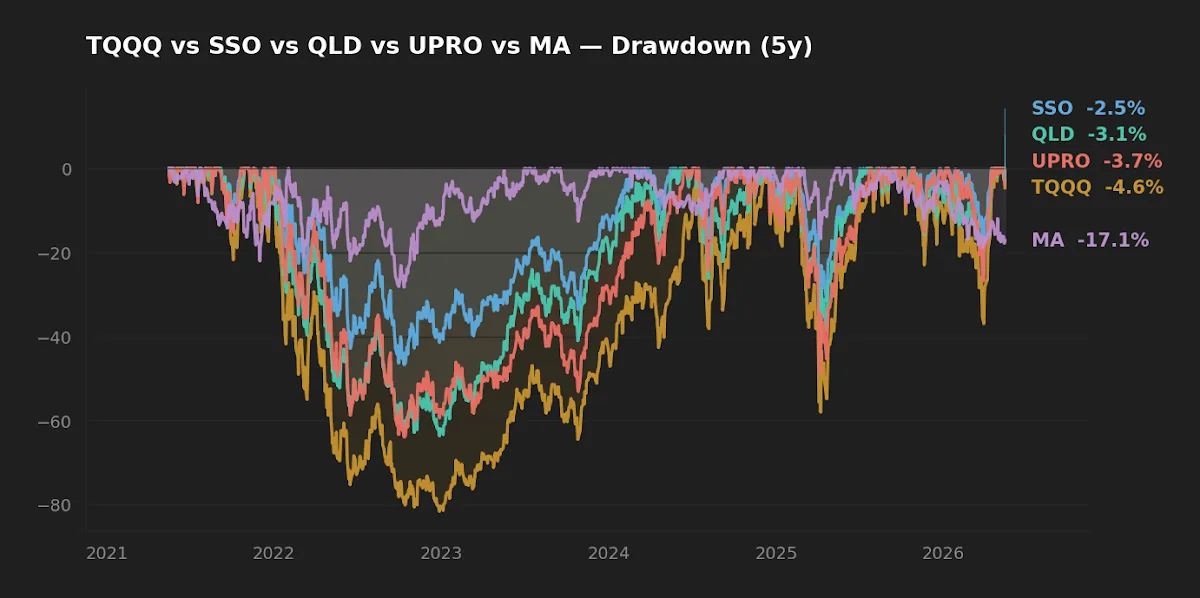
Recovery time matters as much as drawdown depth. An 80% drawdown requires a 400% rebound to restore peak NAV; a 50% drawdown needs 100%. Any investor who sold during the trough — for any reason, including a forced spending need, a job loss, or a behavioral break — locked in losses the underlying index would not have produced. This is the practical reason position sizing dominates every other lever: the size of the sleeve determines whether the framework can fail gracefully, and a small sleeve survives outcomes that a large sleeve cannot.
The four risk-mitigation levers — and why they only work as a system
1. Position sizing as a hard cap. A leveraged sleeve at 5–10% of the long-horizon portfolio converts a worst-case sleeve drawdown of 80% into a portfolio-level drawdown of 4–8% — uncomfortable, but survivable. At 30–40% allocation, the same sleeve drawdown is a portfolio-level disaster. This single decision frames everything else.
2. Mechanical rebalancing. When the leveraged sleeve appreciates above target, rebalancing trims it; when it falls below, rebalancing adds. The academic literature on this is settled enough to use as a default: Daryanani (2008) on opportunistic rebalancing and Vanguard's 2024 update on tolerance bands both support relative-drift bands in the ±15% to ±25% range. High-volatility sleeves cross those bands more often than slow-moving ones, which is exactly when the discipline pays off. The editor's in-house portfolio review framework uses ±25% relative-drift bands on satellite positions for this reason.
3. Trend filter as a hard exit. The 200-day moving average is the most-cited rule because it is simple and historically reduces exposure to deep trending bear markets. The cost is whipsaws in choppy ranges. It is not a complete strategy in isolation, but for a sleeve that is already small, a trend-based exit converts a "TQQQ through 2022" path into a much shorter drawdown — which makes the position behaviorally holdable.
4. Low-correlation ballast. A small allocation to short-duration Treasuries, gold, or cash provides dry powder for the rebalance buys and dampens overall portfolio variance. The same logic appears in the discussion in how to hedge a leveraged portfolio during global market volatility: the ballast is what allows the sleeve to be held through stress without forced selling.
The non-obvious point: skip any one of the four and the other three lose most of their effect. Sizing without rebalancing drifts toward an unintended concentration. Rebalancing without a trend exit forces the investor to buy into the bottom of a multi-year decline. A trend exit without ballast means cash drag in flat markets. Ballast without sizing discipline becomes background noise. The framework is the strategy; the leverage is just amplification.
The leverage doesn't make the strategy. The discipline does. Leverage simply amplifies, in both directions, whatever discipline already exists in the portfolio around it.
Where 2x sits relative to 3x
The 5-year numbers above contain a quieter conclusion: 2x products earn a different conversation than 3x. SSO's 19.6% 5Y CAGR for 33.7% realized volatility is a different risk-reward than UPRO's 23.1% for 50.4% volatility — the marginal step from 2x to 3x bought roughly 3.5 percentage points of CAGR for nearly 17 additional points of annualized vol and 17 more points of max drawdown. The companion comparison QLD vs SSO works through this trade-off in more detail. The general direction: if leverage is held at all in a long-horizon portfolio, 2x is usually where the math lines up, not 3x.
Scoreboard — by category
| Category | Winner | Why |
|---|---|---|
| Lowest fee | TQQQ (0.82%) | Scale-driven ER advantage from $31.3B AUM |
| Lowest realized risk | SSO (-46.7% DD) | 2x on the broader S&P 500 index |
| Highest 5Y realized return | TQQQ (27.0%) | Single-regime tailwind — would not have ranked first in 2000s |
| Best fit for small sleeve | SSO or QLD | 2x products survive rebalancing without dominating |
FAQ
Is TQQQ a buy-and-hold investment?
Treating TQQQ as a buy-and-hold core position contradicts how the product is constructed. The daily reset means holding-period return depends heavily on the realized path. As a small, rule-managed satellite in a tax-advantaged account, alongside a separate broad-market core, it has a defensible role. As "the only ETF you need," no.
Does the 200-day moving average rule still work?
The 200-day MA has historically reduced exposure to deep trending bear markets at the cost of whipsaw in range-bound markets. The empirical edge varies by index and sample period. Treat it as one risk lever among several rather than a complete strategy.
How small should the leveraged sleeve be?
The defensible upper bound depends on what portfolio-level drawdown the investor can tolerate without forced selling. With TQQQ's realized 5-year drawdown at -81.7%, a 10% sleeve produces an ~8% portfolio-level hit from the sleeve alone. Most long-horizon practitioners size below that — 5–10% is common.
Why does the financing cost matter more in 2026?
A 3x daily-reset ETF effectively borrows ~2x of NAV at short rates. With the fed funds rate at 3.64% (FRED, asof 2026-04-01), the embedded financing drag is roughly 2 × short rate per year — versus near-zero in 2020–2021. The same product on the same index has a materially different forward expected return today than three years ago.
Should leveraged ETFs sit in tax-advantaged accounts?
A tax-deferred or tax-free account (401(k), IRA, Roth) is the only context where the sleeve's frequent rebalancing and trend-rule exits don't trigger capital-gains friction. In a taxable account, the after-tax math gets meaningfully worse. If leverage is held at all, it usually belongs in tax-advantaged space.
What this analysis can and can't tell you
The 5- and 10-year numbers above describe one regime: 2016–2026 in the US, with a single deep but short bear market in 2022 and a subsequent recovery. The 200-day-MA exit rule's empirical edge is sample-dependent and was tested mostly on US large-cap indices in 1990–2020. Realized financing drag is sensitive to short rates; rules of thumb derived from 2010–2021 systematically under-estimate the drag at today's 3.64% fed funds rate. The single most important thing the data cannot tell us is how long the current regime persists. If those uncertainties are uncomfortable, that is the right reaction. They are precisely why a leveraged sleeve, if held at all, is held small.
Scenarios where each profile fits
Reader in their 30s, 401(k)-heavy, broad-index core already in place, 15+ year horizon → a 5–8% satellite in a 2x product (SSO or QLD) inside the 401(k), with explicit ±25% rebalancing bands and a 200-day-MA exit rule, is defensible. Skip if the rule won't actually be followed in stress.
Reader within 10 years of needing the money, or with near-term spending pressure → no leveraged sleeve. The drawdown profile cannot be absorbed without forced selling at exactly the wrong time.
Reader holding the position in a taxable account → reconsider. Trend-rule exits and band rebalancing generate short-term capital gains that consume the strategy's expected edge.
For the broader framing on how this fits — or doesn't — into a long-horizon portfolio, the standalone piece leveraged ETF vs normal ETF: can long-term investors use leverage wisely is the closest thing to a written-out checklist.
Editor's read
If forced to express a single view: a small (≤10%) leveraged-equity satellite can earn its place in a long-horizon portfolio that already has a broad-index core, an explicit rebalancing rule, and a hard exit trigger — and that lives in a tax-advantaged account. Outside those guardrails the math does not support the position, particularly at today's financing rates. The discipline is what makes the strategy work; the leverage merely amplifies whatever discipline already exists. For most readers that is a strong argument to confirm the discipline first and the leverage second — which often means later, or never.
The editor does not hold any of the leveraged ETFs discussed in this article at the time of writing.
Key takeaways
- Daily-reset leveraged ETFs are structural products, not buy-and-hold securities. Holding-period return depends on the realized path.
- Variance drag scales with realized volatility (66.6% for TQQQ, 33.7% for SSO over the trailing 5 years). Financing drag scales with the fed funds rate, currently 3.64% — materially higher than the 2020–2021 regime.
- The four risk levers — sizing, rebalancing, trend exit, and uncorrelated ballast — work as a system; remove any one and the rest lose most of their effect.
- Position sizing is the single dominant lever. A 5–10% sleeve cap turns an 80% sleeve drawdown into a survivable 4–8% portfolio drawdown.
- If leverage is held at all, 2x products in tax-advantaged accounts are usually where the math lines up — not 3x in taxable space.
Methodology. Price, return, volatility, and drawdown figures are computed from yfinance close-to-close series pulled on 2026-05-16, over trailing 5- and 10-year windows where available. Expense ratio and AUM reference the ProShares product pages on the same date. Macro reference rates (10-year Treasury, fed funds rate, VIX, CPI YoY) are pulled from FRED with as-of dates noted in-text. Rebalancing-band logic references Daryanani (2008) on opportunistic rebalancing and Vanguard (2024) on rebalancing tolerance bands. Investors should verify current expense ratios, AUM, and prospectus terms against issuer fact sheets before any allocation decision.
This article is for educational purposes and does not constitute personalized financial advice. See Disclaimer.