
The short version
- Leveraged ETFs are engineered to deliver a multiple of the index's daily return, then reset every evening. Their multi-year payoff is path-dependent, not linear.
- At April 2026's Fed funds rate of 3.64% (FRED), the embedded financing leg on a 2x equity ETF runs roughly 4%–5% per year — a hurdle that has to clear before leverage adds anything.
- The 5-year live record shows TQQQ at a 27.0% CAGR but a -81.7% max drawdown. The constraint that matters for a long-horizon investor is drawdown survival, not headline CAGR.
The interesting question isn't whether a leveraged ETF can outperform a 1x index over five years — sometimes it does, by a wide margin, in a sustained low-volatility trend. The question is whether a long-horizon holder can use leverage at all without the path turning the math against them. Answering that requires looking at what these products actually are at the engineering level, what they cost to operate in today's rate environment, and what the realized record across SSO, QLD, UPRO, and TQQQ says about drawdown behavior.
Context: linear math versus daily-reset math
A standard index ETF tracks cumulative return. Buy a broad-market 1x fund at 100, the index doubles over fifteen years, the share is worth roughly 200 minus a small expense drag. The math is linear and time-agnostic. A leveraged ETF — typically 2x or 3x — is structurally different. It holds total return swaps and index futures sized to deliver a multiple of the underlying's daily return, then rebalances each evening to restore the target exposure. Issuer prospectuses state on the cover page that the product is designed for a single-session view.
Two consequences follow. First, the daily reset creates path dependency: the multi-day outcome depends not just on where the index ends up but on the variance of the path it took. Second, the leverage is financed at short-term rates plus a counterparty spread. With Fed funds at 3.64% (FRED, asof 2026-04-01), the implied financing rate inside a 2x equity ETF sits in the neighborhood of 4.0%–4.3% annualized on the leveraged sleeve. That's not a fee line item; it's reflected in NAV divergence from a hypothetical frictionless multiple.
The realized record: SSO, QLD, UPRO, TQQQ
Five-year and ten-year live data tell a cleaner story than any backtest, because they include 2022's rate-shock drawdown and the recovery that followed. The table pulls expense ratio, AUM, yield, and trailing performance directly from price-and-distribution history.
| Ticker | Name | ER | AUM | Yield | 5Y CAGR | 10Y CAGR | 5Y vol | 5Y max DD |
|---|---|---|---|---|---|---|---|---|
| SSO | ProShares Ultra S&P500 (2x) | 0.87% | $7.3B | 0.7% | 19.6% | 24.2% | 33.7% | -46.7% |
| QLD | ProShares Ultra QQQ (2x) | 0.95% | $12.0B | 0.2% | 24.9% | 35.8% | 44.8% | -63.7% |
| UPRO | ProShares UltraPro S&P500 (3x) | 0.89% | $4.7B | 0.8% | 23.1% | 30.1% | 50.4% | -63.9% |
| TQQQ | ProShares UltraPro QQQ (3x) | 0.82% | $31.3B | 0.5% | 27.0% | 44.9% | 66.6% | -81.7% |
Price, NAV, and distribution data via yfinance; expense ratio, AUM, and inception cross-referenced from issuer fact sheets (ProShares). Fetched 2026-05-16. Trailing returns annualized through that date.
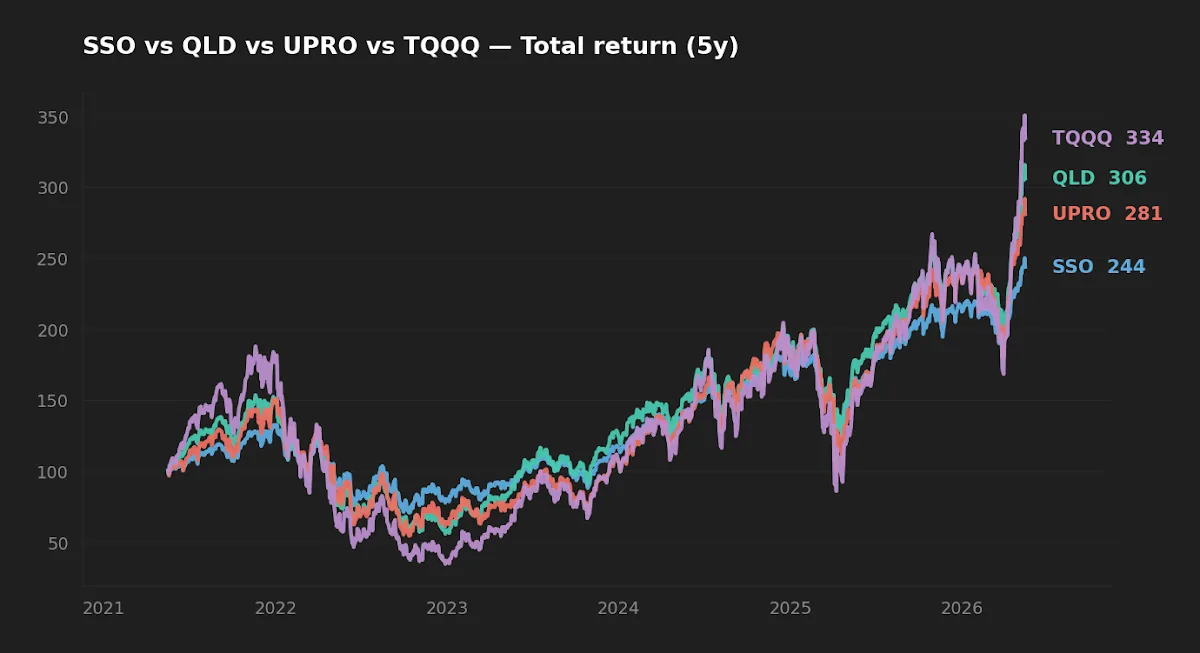
Three observations are worth pulling out before any narrative. UPRO (3x S&P) trailed QLD (2x Nasdaq) on a 10-year CAGR despite 50% more headline leverage — a clean illustration that more leverage and more return are not the same trade. TQQQ's 10-year CAGR of 44.9% is striking, but lives inside a window dominated by the post-COVID rebound; the same product carries an -81.7% max drawdown inside the 5-year window. And both 2x products (SSO, QLD) achieved roughly two-thirds to three-quarters of their respective 3x cousins' return at materially lower realized volatility.
What "designed for one day" actually means
The phrase appears in nearly every leveraged ETF prospectus. It is not a disclaimer — it is a description of the product's mathematical intent. The fund commits, on each trading day, to deliver a multiple of that day's index return. It does not commit, and is not engineered, to deliver that multiple over any longer window.
A stylized example clarifies the asymmetry. The index opens at 100, drops to 90 on day one (-10%), then rallies back to 100 on day two (+11.1%). An index investor: flat. A 2x daily-reset fund returns -20% on day one (NAV: 80), then +22.2% on day two (NAV: 97.8). Same endpoint for the index, but a 2.2% loss in the leveraged fund. Increase the variance of the path or extend the window, and the gap widens. The expected drag is roughly proportional to the variance of daily returns — what the academic literature calls volatility decay or compounding drag. For a path-dependency walkthrough, see The Complete Guide to Leveraged ETF Investing.
This is the structural ceiling on long-horizon leveraged-ETF returns. In a sustained low-vol uptrend — much of 2017, parts of 2019, the post-COVID rebound — the daily reset compounds in the holder's favor and a 2x fund can outpace twice the index's cumulative return. In a choppy or range-bound market, the same mechanic works against them. Buying and holding a leveraged ETF is implicitly a bet on persistent low-vol uptrends.
The hurdle rate is real and currently elevated
The "borrowed" half of a 2x ETF is not free. The fund earns the index's gross return on a notional larger than its NAV; the counterparty receives a financing payment referenced to a short-term rate (Fed funds or SOFR) plus a spread. Issuer prospectus disclosures place that implied financing rate roughly at Fed funds plus 25–60 basis points on the leveraged sleeve.
At today's 3.64% Fed funds rate (FRED, asof 2026-04-01), the embedded financing drag on a 2x equity ETF runs roughly 4.0%–4.3% per year, applied to the leveraged half. Add the fund's own expense ratio (0.87% for SSO, 0.95% for QLD) and the underlying index has to deliver something on the order of 5% annualized just to break even with cash before the leverage starts contributing anything. The widely circulated "leveraged ETFs work surprisingly well long-term" backtests almost all live inside the 2010–2021 window when Fed funds sat near zero for years. With the 10-year Treasury now at 4.47% and CPI year-over-year at 3.9% (FRED, asof 2026-05-14 and 2026-04-01 respectively), the cost side has shifted.
A 2x equity ETF in 2026 needs the underlying index to clear roughly 4%–5% per year just to stand still — before the fund's own expense ratio. That hurdle isn't a market view; it's an accounting fact tied to the financing rate.
Realized drawdown is the binding constraint
Volatility drag and trend amplification are two sides of the same compounding mechanic, but neither is the variable that ends a long-horizon plan. Drawdown is. The 5-year live record is unambiguous on this point: TQQQ printed an -81.7% peak-to-trough decline, UPRO -63.9%, QLD -63.7%, SSO -46.7%. The drawdown depth roughly scales with realized volatility, which itself scales non-linearly with leverage.
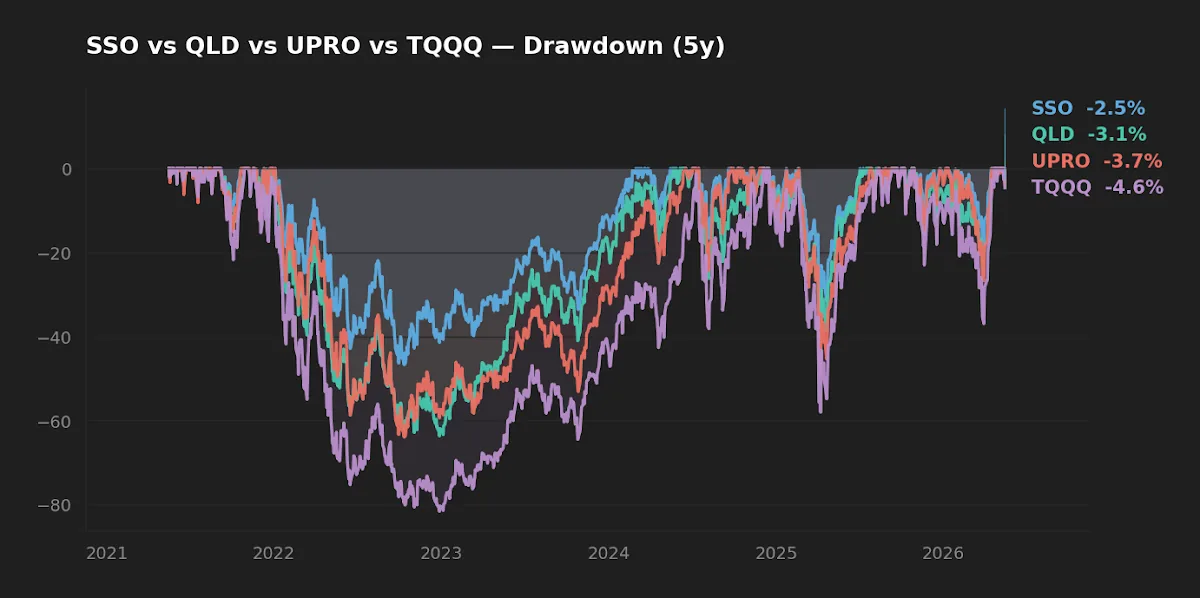
The counterintuitive insight hidden in the table is that volatility drag isn't proportional to leverage; it's roughly proportional to leverage squared times the variance of the path. Going from 2x to 3x doesn't add 50% more drag — it roughly doubles it. That is why UPRO (3x S&P, 50.4% 5Y vol) underperformed QLD (2x Nasdaq, 44.8% vol) on a 10-year CAGR basis despite more headline leverage. The drag from the 3x reset eats into the trend amplification more than the extra leverage adds. For a more granular look at the 2x pair specifically, see QLD vs SSO: Comparing 2x Leveraged ETFs for Long-Term Core Portfolios.
Initially the editor expected the 3x products to dominate over a sufficiently long bull cycle. The 10-year numbers don't support that: UPRO's 30.1% CAGR is below QLD's 35.8% across the same window, and at materially higher realized risk. That isn't a forecast — it's what live capital actually did.
At-a-glance scoreboard
| Category | Better fit | Why |
|---|---|---|
| Cost (lowest hurdle rate) | 1x index ETF | No embedded financing leg; expense ratios typically 0.03%–0.10% |
| Realized risk (lowest drawdown) | 1x index ETF | Linear math; no compounding drag; no leverage-squared scaling |
| Realized return, 10Y, low-vol regime | QLD (2x Nasdaq) | 35.8% CAGR with lower vol than 3x peers; trend amplification compounded favorably |
| Suitability as long-term core | 1x index ETF | Designed for multi-year holding; tax efficient; survivable drawdowns |
| Sized satellite (under ~10% of NAV) | 2x ETF (SSO or QLD) | Drawdown survivable at small size; financing drag bounded; avoids 3x's leverage-squared decay |
FAQ
Do leveraged ETFs always lose money over the long run?
No. In sustained low-volatility uptrends, the daily reset compounds in the holder's favor and a 2x fund can outperform twice the index's cumulative return — QLD's 10-year CAGR of 35.8% on a roughly 18%-CAGR Nasdaq 100 backdrop is evidence of that. In choppy markets, the same mechanism works against them. The outcome is path-dependent.
How is the financing cost actually charged?
The fund holds total return swaps that pay it the index's gross return on a notional larger than its NAV; the counterparty receives a financing payment referenced to a short-term rate (Fed funds or SOFR) plus a spread, typically 25–60 basis points. That payment lowers NAV continuously. Investors don't see a separate line item — it's reflected in divergence from a frictionless 2x or 3x.
Why are most leveraged-ETF backtests so favorable?
Because the typical backtest window — 2010 through 2021 — sits almost entirely inside a zero-rate, low-vol regime. That window is not representative of the financing cost facing the same product with Fed funds at 3.64%. Treat any backtest result whose window is dominated by post-GFC zero-rate years as conditional on that regime returning.
Is there a holding period at which leveraged ETFs are clearly inappropriate?
The issuer-designed holding period is one trading session. Holding longer requires accepting path dependency. Multi-year holding is not prohibited — millions of dollars sit in TQQQ for years — but it uses the product outside its engineered specification. Acceptable if sized for survival; not acceptable as a core replacement.
How does this compare to using margin to lever a 1x ETF?
Margin gives direct control over the leverage ratio and financing rate, and tax treatment is cleaner, but it carries forced-liquidation risk if equity falls below the maintenance threshold. Leveraged ETFs have no margin call but carry volatility drag and counterparty exposure to the swap. Different failure modes, broadly similar economics in steady regimes.
What this comparison can and can't tell you
The 5-year and 10-year CAGRs above are real but cover one major drawdown (2022) and one extended recovery. They do not include a multi-year sideways regime, an extended high-volatility bear, or a sustained rate environment above 5%. A leveraged ETF's behavior is heavily regime-conditional, and 10 years is a small sample for products whose entire point is non-linear path response. Treat the table as a description of what these funds did in this window, not a prediction of what they will do in the next.
Scenarios where each fits
Reader in their 30s, tax-deferred account, 30-year horizon, no current leverage exposure: a single-digit-percent allocation to QLD or SSO can amplify trend exposure without breaking the plan if drawdown lands badly. The honest stress test: would a 60% loss on the leveraged sleeve change anything about the broader portfolio? If yes, the position is too big.
Reader within 10 years of drawdown on the portfolio: the asymmetry doesn't favor leverage. A late-cycle drawdown on a 3x product can recover, but the time required is non-trivial — the post-2000 Nasdaq drawdown took roughly 15 years to recover at 1x. Skip the leveraged sleeve entirely.
Reader looking for a "core replacement" with leverage: the data doesn't support this use case. Across every realized window in the live record, 1x core plus small satellite has produced more survivable outcomes than full-portfolio leverage. The 81.7% drawdown on TQQQ alone makes the case. See also Can Leveraged ETFs Be Part of a Long-Term Portfolio? Risk Mitigation Strategies.
Editor's read
If forced to give a single answer to whether a long-horizon investor can use leverage at all, the editor's view is yes — but only as a sized, rules-based satellite, never as a core replacement. The honest test is: would a 60% drawdown on this position change anything else in the plan? If yes, the position is too large. The current rate environment makes that bar higher, not lower; the financing cost embedded in 2x and 3x equity products is materially greater in 2026 than during the zero-rate window most leveraged-ETF advocacy implicitly relies on. The instrument itself is neutral. The discipline around it isn't.
The editor does not currently hold any 2x or 3x leveraged equity ETFs as part of the long-term core.
Key takeaways
- A leveraged ETF is engineered to multiply the index's daily move, not its multi-year return. Multi-year outcomes are path-dependent.
- At Fed funds of 3.64%, the implied financing drag on a 2x equity ETF runs roughly 4%–5% per year, before the fund's own 0.87%–0.95% expense ratio.
- Volatility drag scales roughly with leverage squared. UPRO (3x) trailed QLD (2x) on 10-year CAGR despite 50% more headline leverage.
- The binding constraint is drawdown survival. TQQQ's 5-year max drawdown of -81.7% is what ends real plans, not theoretical CAGR.
- Most retail leveraged-ETF advocacy backtests live inside the 2010–2021 zero-rate regime. The 2026 cost structure is materially different.
How we built this analysis
Price, NAV, and distribution history pulled via yfinance for SSO, QLD, UPRO, and TQQQ; fetched 2026-05-16. Expense ratios, AUM, and inception dates cross-referenced from ProShares fund fact sheets. Macro inputs (Fed funds, 10-year Treasury, CPI year-over-year, VIX) sourced from FRED, latest available through 2026-05-14. Annualized vol and max drawdown computed over a rolling 5-year window through 2026-05-16. The article is descriptive of realized behavior in this window; it is not a prediction.
This article is for educational purposes and does not constitute personalized financial advice. See full Disclaimer.