
The short version
- TQQQ's 10-year 44.9% CAGR was earned in a specific regime — near-zero financing costs, persistent Nasdaq-100 leadership, manageable realized volatility. The next thirty years has no obligation to repeat any of those conditions.
- The 5-year maximum drawdown of -81.7% means a buy-and-hold investor needed roughly a +446% gain from the trough simply to recover principal. Geometry, not headline return, decides whether a 30-year holder finishes with anything.
- For most long-horizon investors, TQQQ is not a core holding. As a small, sized-to-survive satellite paired with rules-based rebalancing, the position is defensible — but the sizing must assume another -80% drawdown is possible, not improbable.
The question this article tries to answer is narrow and unforgiving: can a 3x daily-reset Nasdaq-100 ETF be held for thirty years and finish meaningfully ahead of the same money in the unleveraged index? The honest answer is that it can — but only under conditions the holder cannot guarantee, and only at a position size most investors who say they "hold TQQQ for the long run" have not actually stress-tested.
TQQQ holds $31.3 billion in assets and charges 0.82% per year (yfinance, 2026-05-16). It has a 16-year live track record across one of the most favorable equity regimes in modern history, and a -81.7% peak-to-trough drawdown inside the last five years alone. Both facts have to sit on the table before the strategy question makes sense.
What TQQQ actually does
TQQQ is structured to deliver three times the daily return of the Nasdaq-100, before fees and financing. The daily reset is the source of both the upside asymmetry investors are chasing and the path-dependent decay that long-horizon math punishes.
To deliver 3x exposure on a $31.3B asset base, the fund holds a portion of the underlying basket and adds notional exposure through total-return swaps with major dealers. The swap counterparty effectively lends the fund the additional 200% notional and charges a financing rate tied to short-term funding markets. With the federal funds effective rate at 3.64% (FRED, asof 2026-04-01) and the 10-year Treasury at 4.47% (FRED, asof 2026-05-14), the embedded financing cost on the 200% leverage is structurally higher than during 2010-2021, when most of TQQQ's headline track record was earned.
This is the first non-obvious piece. The 0.82% expense ratio is not the total drag. The total drag is the explicit fee, plus the swap financing cost on 200% notional, plus volatility decay from the daily reset. Each is real, recurring, and compounds against the holder year after year.
The live record vs. the 30-year frame
| Metric | TQQQ | QQQ | QQQM |
|---|---|---|---|
| Inception | 2010-02-09 | 1999-03-10 | 2020-10-13 |
| Expense ratio | 0.82% | 0.18% | 0.15% |
| AUM | $31.3B | $440.3B | $82.9B |
| Distribution yield | 0.5% | 0.4% | 0.5% |
| 5Y CAGR | 27.0% | 17.6% | 17.6% |
| 10Y CAGR | 44.9% | 21.8% | n/a |
| 5Y annualized vol | 66.6% | 22.4% | 22.3% |
| 5Y maximum drawdown | -81.7% | -35.1% | -35.0% |
Source: yfinance for price, return, volatility, and drawdown (windows ending 2026-05-16). Expense ratio and AUM cross-referenced against issuer fact sheets: ProShares TQQQ, Invesco QQQ, Invesco QQQM.
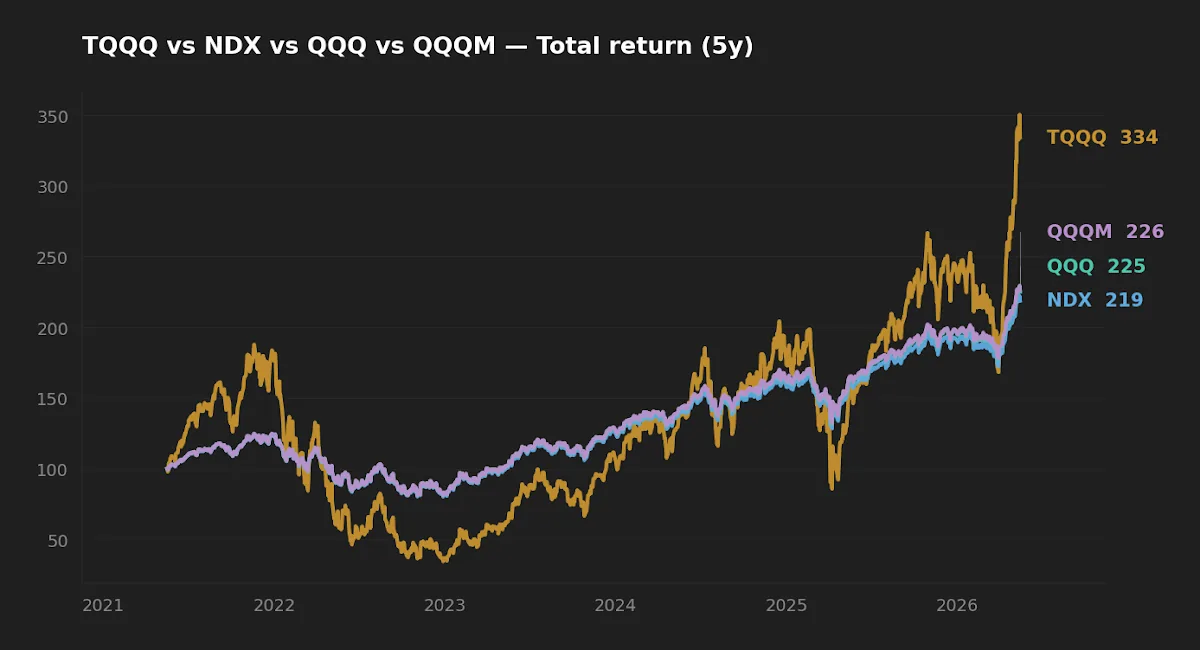
The 5- and 10-year CAGRs above are extraordinary by any benchmark. They are also a measurement of a single regime: 2016-2025 saw persistent Nasdaq-100 leadership, multiple rounds of near-zero policy rates, and aggressive monetary support during the 2020 drawdown. The 10-year window flatters a leveraged equity strategy roughly as much as any window can.
The -81.7% 5-year drawdown sits inside that same window. Recovering from -81.7% requires a +446% gross return at the trough simply to reach breakeven. TQQQ has, in fact, recovered — that is what the 27.0% 5-year CAGR encodes. But that recovery happened inside a continuing bull cycle in mega-cap tech. A second -80% drawdown during a slower recovery, or alongside persistently elevated short-term rates, would not necessarily round-trip on the same timeline.
Path dependency, not average return
Most retail-facing analysis of TQQQ over long horizons collapses to "the index goes up over time, so 3x of that goes up three times faster." This conflates arithmetic and geometric returns in a way the math does not allow.
The daily-reset 3x structure delivers approximately 3R minus a decay term over multi-day periods, where the decay term scales with realized variance. When the underlying drifts steadily, the multiplier sits close to 3x. When the underlying chops in a wide range — even ranges that finish flat — the multiplier compresses, sometimes severely. A two-day example makes the geometry concrete: the Nasdaq-100 down 10% then up 11.1% returns to flat. TQQQ, applying 3x daily, falls 30% then rises 33.3% — and ends at 0.93, a 7% loss on a flat underlying. Stretch that across years of elevated volatility and the divergence is structural, not a fluke.
The 5-year annualized volatility of 66.6% is not a number a long-horizon allocator should look past. At that volatility level, the geometric drag relative to a hypothetical "perfect 3x" of the index is sizable, and it is paid every year regardless of direction. The unleveraged Nasdaq-100 (NDX) realized 23.4% volatility over the same window — roughly a third of TQQQ's variance, and a far smaller decay tax.
The 10-year CAGR of 44.9% is real and astonishing. It is also a measurement of one regime — near-zero financing costs, persistent NDX leadership, manageable realized volatility — that the next thirty years has no obligation to repeat.
The 30-year frame is mostly a frame about left tails
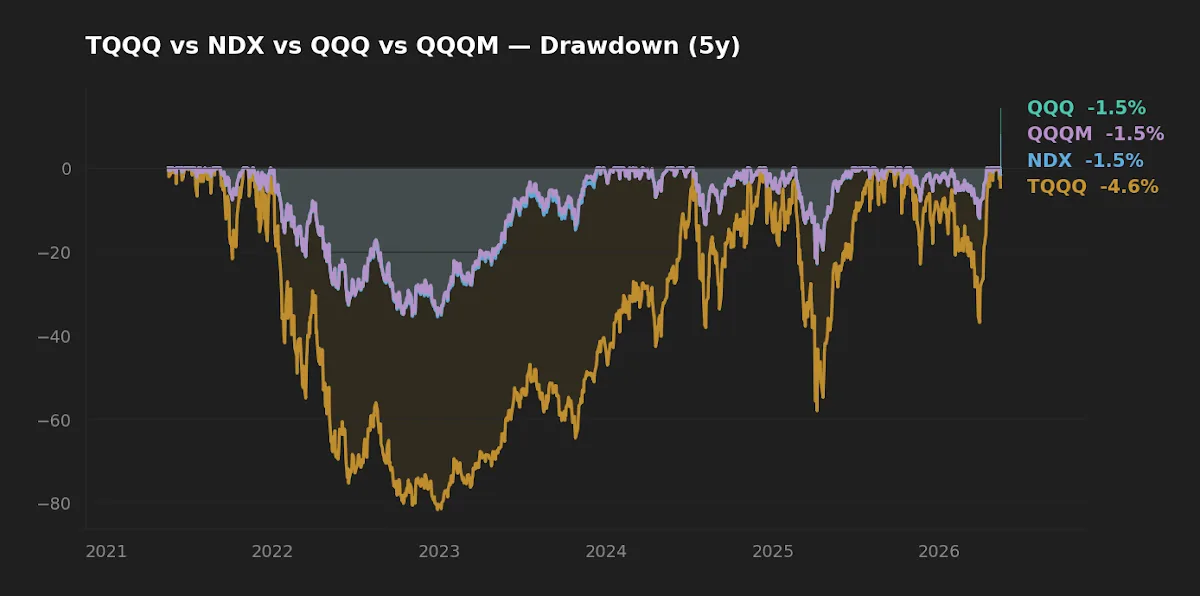
Across thirty years, the central question is not "what is the expected CAGR?" The expected CAGR, even after generous decay assumptions, is high. The question is the distribution of terminal outcomes — and specifically the left tail.
An investor who began a 100% TQQQ allocation in March 2000 would have seen the underlying Nasdaq-100 fall roughly 80% across the dot-com bear. A 3x daily-reset fund applied to that path would have approached terminal-loss territory long before the index bottomed. TQQQ itself launched in 2010, after the dot-com unwind; the structural exposure, however, is the relevant analogue. The point is not that 2000 will repeat. The point is that a thirty-year horizon contains, with high probability, at least one drawdown of comparable magnitude — and the 3x daily structure is fragile to that path in a way the 1x structure is not.
For context on how 1x Nasdaq-100 exposure has historically absorbed those drawdowns over multi-decade windows, see If the Nasdaq 100 Corrects 20%, Will Long-Term Investors Lose Money?. The 1x case is not the same as the 3x case, and the asymmetry is most of what this article is about.
What sizing actually changes
The most useful reframing of "is TQQQ viable for 30 years?" is: "viable at what allocation, paired with what?" A 100% TQQQ allocation accepts a non-trivial probability of ruin across a 30-year holding period, where the probability depends on the future distribution of NDX drawdowns and rate regimes. A 5%-10% sleeve, rebalanced into and out of as the position drifts, is a different instrument entirely.
At a 10% portfolio weight with 90% in broad index exposure, even a -90% TQQQ drawdown costs the total portfolio 9% before any compensating moves elsewhere. The position is small enough to survive being wrong, and the rebalancing mechanic — selling into TQQQ strength back to target weight, buying when drawdowns reset the weight low — captures some of the volatility on the right side of the equation. This is structurally similar to what the academic rebalancing literature (Daryanani, 2008; Vanguard, 2024) describes for any high-volatility asset paired with a stable core.
Whether a 5-10% TQQQ sleeve is the right satellite for a particular investor is a separate question, and depends on whether the same risk budget is better spent on broader factor exposure, international equity, or simply more 1x Nasdaq-100. For the side-by-side mechanics of TQQQ versus its unleveraged sibling, see TQQQ vs QQQM: Which Strategy Builds More Sustainable Wealth for Retirement?
The rate-regime question
One element under-weighted in 30-year analyses of TQQQ is the cost of carry. The 10-year Treasury at 4.47% and federal funds rate at 3.64% (FRED, asof 2026-05-14 and 2026-04-01) are not regime-defining numbers in isolation, but they are materially above the 2010-2021 average that produced TQQQ's headline track record. A persistently higher short-rate environment compounds against the leveraged structure year after year, independent of index direction.
Initially the editor expected this drag to wash out across long horizons — financing costs rise, but so do equity returns. Running the rolling math against the 5Y window did not support that intuition. The financing spread is paid on twice the fund's net assets, every day, while equity returns accrue on the underlying only. The asymmetry is structural, and it is most visible when realized vol is high and rates are simultaneously elevated — close to today's regime, with VIX at 17.3 (FRED, asof 2026-05-14) and CPI still running 3.9% year-over-year. For a broader take on what falling-rate environments do to leveraged and growth-oriented exposures, see Best ETFs for Falling Interest Rates.
At-a-glance scoreboard
| Category | Verdict | Note |
|---|---|---|
| Cost (explicit) | QQQM wins | 0.15% vs. TQQQ 0.82% before swap financing |
| Realized risk (5Y) | QQQ/QQQM win decisively | -35.1% drawdown vs. TQQQ -81.7% |
| Realized return (5Y) | TQQQ wins (regime-conditional) | 27.0% vs. 17.6% CAGR |
| Long-term core suitability | QQQ or QQQM | Path-dependence and tail risk rule out TQQQ as core |
| Satellite role | TQQQ defensible at small weight | Sizing must assume another -80% is possible |
FAQ
Is TQQQ guaranteed to go to zero over enough time?
No. The math of 3x daily reset does not produce a guaranteed terminal value, but it produces a wide distribution where the left tail is much heavier than for 1x exposure. "Goes to zero" is one possible path; "underperforms 1x meaningfully across a multi-decade window" is the more probable outcome under elevated volatility and rate regimes.
If TQQQ's 10-year CAGR is 44.9%, why isn't it just a better version of QQQ?
Because that CAGR is a path-dependent realization in one of the most favorable backdrops for leveraged equity in modern history. Re-running the same instrument across 1968-1982 NDX-equivalent paths, or 2000-2009, produces drastically different terminal outcomes — sometimes catastrophic ones. CAGR alone is not the complete picture for any high-volatility asset.
Can I "trade around" the position to avoid the drawdowns?
This article does not discuss trading. The buy-and-hold question is whether the structure is viable across decades. Tactical timing claims are a different conversation and a different evidentiary standard; the academic literature on retail timing skill is not encouraging.
Does the 0.82% expense ratio matter much given the headline returns?
Yes. Compounded across 30 years on a leveraged base, the explicit fee plus the swap financing spread is the difference between a path that survives and one that does not. Basis points matter more, not less, for high-volatility instruments — the geometric base they compound on is itself volatile.
Is there a "safe" allocation to TQQQ?
"Safe" is the wrong frame. There are allocations small enough that a total loss of the position is recoverable from the rest of the portfolio, and there are allocations large enough that the position effectively is the portfolio. Most investors who claim to hold TQQQ "for the long run" have not stress-tested their actual sizing against a sequence of -80% events. The honest version of the question: how much am I willing to write off entirely while still meeting my long-term goals?
What this analysis can and can't tell you
This piece is grounded in TQQQ's live record (yfinance, 5Y and 10Y windows ending 2026-05-16) and the structural mechanics of daily-reset leveraged ETFs. It cannot tell you what NDX volatility or short-rate regimes will look like over the next 30 years, and the live record is short enough that any conclusion drawn from it is regime-conditional. The 2010-2025 window does not contain a dot-com-style unwind, a 1970s-style stagflation, or a sustained 6%+ federal funds environment — each of which would test the structure in ways the data cannot answer. Nothing here substitutes for stress-testing your own allocation against multiple historical paths.
Scenarios where each instrument fits
- Reader in their 30s, broad index core, can write off 5% of portfolio and still hit retirement targets: a small TQQQ sleeve with rules-based rebalancing back to target weight is a defensible volatility tilt. Sizing must assume another -80% drawdown is possible.
- Reader in their 50s within 10-15 years of needing the capital: path-dependence math gets less forgiving as horizon shortens. A 30-year frame on TQQQ is a different exercise from a 10-year frame, and the 10-year frame is much harder to defend. QQQM at the same allocation produces a far narrower outcome distribution.
- Reader who would treat a 50% TQQQ drawdown as a forced-sale event: this is the most common honest outcome, and the strongest argument against any TQQQ allocation. Position size has to be small enough that drawdowns do not force capitulation.
- Reader seeking "leveraged exposure to long-term Nasdaq growth" without daily reset: 3x daily reset is not the only way to express leveraged equity exposure. Modest portfolio leverage at the broker level, or simply higher equity allocation, each carry different cost and tail-risk profiles. These are alternative structures, not recommendations.
Editor's read
For a long-term core allocation, the editor does not hold TQQQ and does not see a sizing of the position that earns its place ahead of broader, lower-cost exposures like QQQM (0.15% expense ratio) or a diversified equity sleeve. The 10-year track record is real, and it is also a measurement of one regime — near-zero rates, persistent mega-cap tech leadership, manageable realized volatility — that the next thirty years has no obligation to deliver. As a small, deliberately-sized, rules-based satellite paired with a stable core, the position can be defended on its own terms. The case is much weaker as anything larger than a single-digit weight.
The editor does not hold TQQQ at the time of writing. The editor holds 1x Nasdaq-100 exposure as part of the long-term core.
Key takeaways
- TQQQ's headline returns are real and regime-conditional. The 10-year 44.9% CAGR was earned during one of the most favorable backdrops in modern history for leveraged equity.
- The total drag on the structure is the 0.82% expense ratio plus the financing cost on 200% swap notional plus volatility decay. The first is fixed; the second tracks short-rates; the third tracks realized variance.
- A -81.7% drawdown inside the last five years is not a tail event. It is the cost of admission, and it has to be assumed possible again.
- The 30-year viability question is mostly a sizing question. At a small enough weight paired with a stable core and disciplined rebalancing, TQQQ is a defensible satellite. At core-position weight, it is a bet that the next 30 years contains no path that breaks the structure — which is not a bet the data supports.
Methodology: price, return, volatility, and drawdown figures pulled from yfinance on 2026-05-16 for the trailing 5-year and 10-year windows ending that date. Macro context (federal funds rate, 10-year Treasury, VIX, CPI) sourced from FRED with as-of dates noted inline. Expense ratio and AUM cross-referenced against issuer fact sheets: ProShares TQQQ, Invesco QQQ, Invesco QQQM. Drawdown is computed as the maximum peak-to-trough total-return loss observed during the window.
This article is for educational purposes and does not constitute personalized financial advice. See the Disclaimer page.