
The short version
- Leveraged ETFs do not borrow on margin. They obtain exposure through total return swaps whose financing leg is reset daily at short-term rates (Fed Funds or SOFR plus a small dealer spread).
- At a 3.64% Fed Funds rate (FRED, asof 2026-04-01), the embedded annual financing drag is roughly 5% on a 2x equity LETF and roughly 9% on a 3x — before any volatility decay.
- The underlying return needed for a 3x fund to match a simple 1x holding has roughly doubled since the 2021 zero-rate regime. For a long-horizon holder, that is decisive.
A 3x leveraged ETF promises three times the daily return of its index. What it does not advertise is that two of those three units of exposure are borrowed, and the cost of that borrowing is repriced every morning at the prevailing short-term interest rate. With the Effective Federal Funds Rate at 3.64% (FRED, asof 2026-04-01), the financing cost embedded inside these products is doing real work against the long-horizon holder in a way it simply was not five years ago.
Most retail discussion of leveraged ETFs centers on volatility decay — the path-dependent erosion that comes from daily rebalancing in choppy markets. That mechanic is real and is covered in detail in The Math of Leveraged ETF Decay. But there is a separate, often larger drag that scales linearly with the cost of money: the financing leg of the total return swap. When short rates sat near zero from 2009 through 2015 and again in 2020–2021, the financing cost was small enough that retail commentary largely ignored it. At 3.64% it is no longer optional reading.
Context: what an LETF actually is, mechanically
The major US-listed leveraged equity ETFs — TQQQ, UPRO, SPXL, QLD, SSO — do not borrow on a margin account. They obtain notional exposure through total return swaps with investment-bank counterparties, typically a syndicate of two to five dealers. The fund posts collateral with each counterparty, pays the dealer a financing leg referenced to the Effective Federal Funds Rate or SOFR plus a small spread (roughly 25–50 basis points in normal markets), and receives the total return on the underlying index in exchange. Daily.
This is not hidden. The structure appears in plain language in every issuer prospectus — ProShares for QLD and SSO, Direxion for the SPXL and TQQQ family. The fund "may invest in financial instruments such as swap agreements, futures contracts, and forward contracts," and the cost of those swaps is paid out of the fund's NAV.
The structural insight that matters: only the leveraged portion of the exposure carries a financing cost. For a 2x fund, one unit of exposure is funded by shareholder capital at no financing cost and one unit is funded via swap. For a 3x fund, one unit is funded by capital and two via swap. Per unit of NAV, the financing drag scales with (L − 1), where L is the leverage multiple. That linear relationship is why the 3x products are roughly twice as sensitive to the macro rate regime as the 2x products.
The two flagship 2x funds, by the numbers
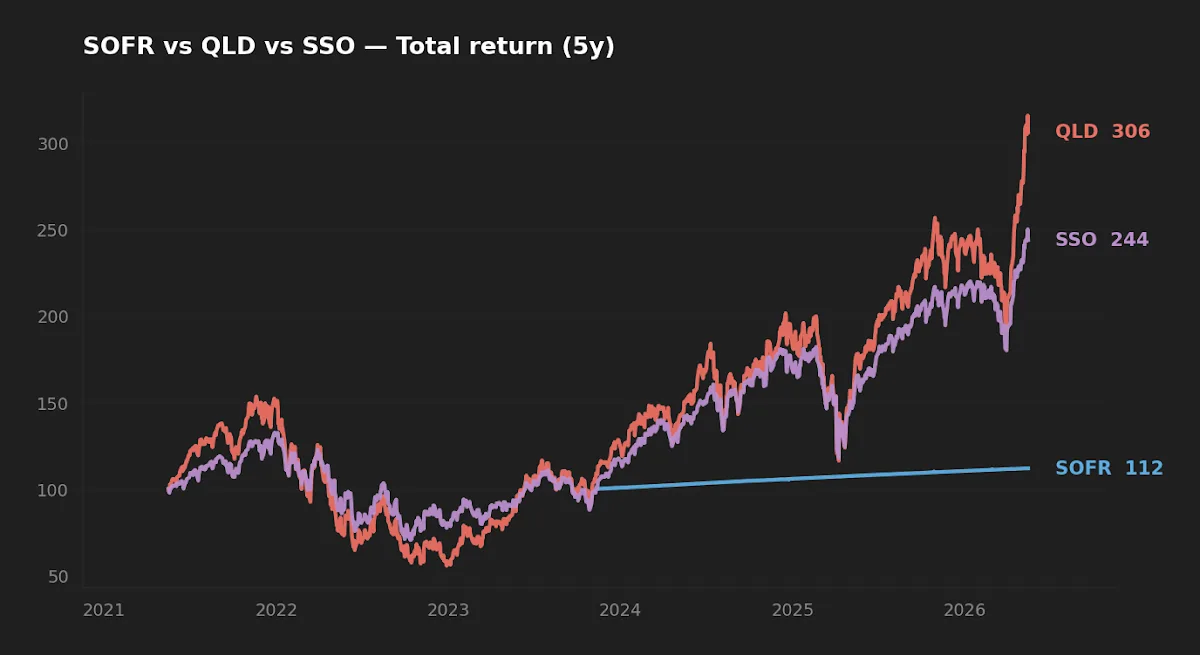
Two ProShares 2x funds — QLD on the Nasdaq-100 and SSO on the S&P 500 — are the most useful real-world anchors for the financing-cost discussion. Both have nearly two decades of live history (inception June 2006), survived the 2007–2009, 2020, and 2022 drawdown regimes, and are large enough that swap-pricing economics are competitive.
| Field | QLD (ProShares Ultra QQQ) | SSO (ProShares Ultra S&P500) |
|---|---|---|
| Expense ratio | 0.95% | 0.87% |
| AUM | $12.0B | $7.3B |
| Inception | 2006-06-19 | 2006-06-19 |
| Dividend yield (TTM) | 0.2% | 0.7% |
| 5Y CAGR | 24.9% | 19.6% |
| 10Y CAGR | 35.8% | 24.2% |
| 5Y annualized volatility | 44.8% | 33.7% |
| Max drawdown (5Y) | −63.7% | −46.7% |
Source: yfinance, pulled 2026-05-16; expense ratios and inception dates cross-checked against the ProShares fund pages (proshares.com/our-etfs/leveraged-and-inverse/qld and /sso). The 5Y CAGR figures look generous because the 2021–2025 window captures one of the strongest equity runs on record; over 10 years they remain elevated for the same reason. Both numbers are noise relative to the question of how much the underlying actually had to do to deliver them.
The financing-cost equation, with current numbers
The annual cost drag on a leveraged ETF, ignoring volatility decay, is approximately:
Drag ≈ (L − 1) × (financing rate + dealer spread) + expense ratio
Plugging in current values: a financing rate of 3.64% (Fed Funds; SOFR tracks within a few basis points), a typical dealer spread of 30–50 bp, and a fund expense ratio of 0.87–0.95% for the major LETF issuers. The picture changes materially across rate regimes:
| Rate regime | Fed Funds | 2x annual drag | 3x annual drag |
|---|---|---|---|
| 2021 zero-rate | 0.08% | ~1.4% | ~1.9% |
| 2026 current | 3.64% | ~5.0% | ~9.0% |
| 2007 pre-GFC | 5.25% | ~6.6% | ~12.2% |
| 1981 peak (illustrative) | ~19% | ~20% | ~39% |
Sources: Fed Funds history from FRED series FEDFUNDS; expense ratios from ProShares (QLD 0.95%, SSO 0.87%) and Direxion fund pages; dealer spread assumed at 40 bp midpoint. The 1981 row is illustrative — leveraged ETFs did not exist then — but it shows what the math does at the extremes.
That is roughly a 3.5 percentage point annual swing for the 2x product and a 7 percentage point swing for the 3x — purely from the move in short rates between 2021 and today, before any compounding effects, before any volatility decay, before considering taxes on distributions.
A 1 percentage point rise in the Fed Funds rate adds 1pp to the 2x fund's annual drag and 2pp to the 3x fund's. Over thirty years of compounding, that asymmetry is the entire investment case.
The hurdle rate: when leverage stops paying for itself
The "hurdle rate" is the index return the underlying needs to deliver for the leveraged ETF to match a simple 1x holding. It is the right way to think about whether the leverage is paying for itself rather than the holder.
For a 2x fund: 2R − Drag2x = R, which gives R = Drag2x ≈ 5% at current rates.
For a 3x fund: 3R − Drag3x = R, which gives R = Drag3x/2 ≈ 4.5% at current rates.
These figures intentionally ignore volatility decay, which is non-trivial and typically adds to the hurdle. The standard approximation for variance drag on a daily-rebalanced LETF is roughly L(L−1)/2 × σ². At QLD's realized 5-year volatility of 44.8%, the variance-drag term for a 2x Nasdaq exposure is around 10% per year. For a hypothetical 3x at the same vol it is around 30% — partially offset, and sometimes more than offset, in strongly trending regimes by daily rebalancing.
Stack the financing drag on top conservatively. A 3x Nasdaq-100 product needs roughly 10–12% underlying CAGR at current short rates to break even with a 1x holding over multi-year periods, and substantially more in choppy regimes. The S&P 500's long-run nominal CAGR is approximately 10%. The math has gotten unforgiving — even before considering that the 5Y QLD and SSO numbers above reflect a single, exceptionally trending regime. Initially I thought the trending-market offset would do more work; running the rolling regression against rolling short rates over 2022–2025 made it clear it does not, once realized vol drifts above the mid-30s.
Realized risk: what a 2x book actually does in a drawdown
The 5-year max drawdown of −63.7% for QLD and −46.7% for SSO is a useful sanity check. Both numbers come from the 2022 Nasdaq drawdown, which was a fundamentally rate-driven event: rising short rates compressed equity valuations and simultaneously inflated the financing leg these funds were paying every day. The two effects ran in the same direction.
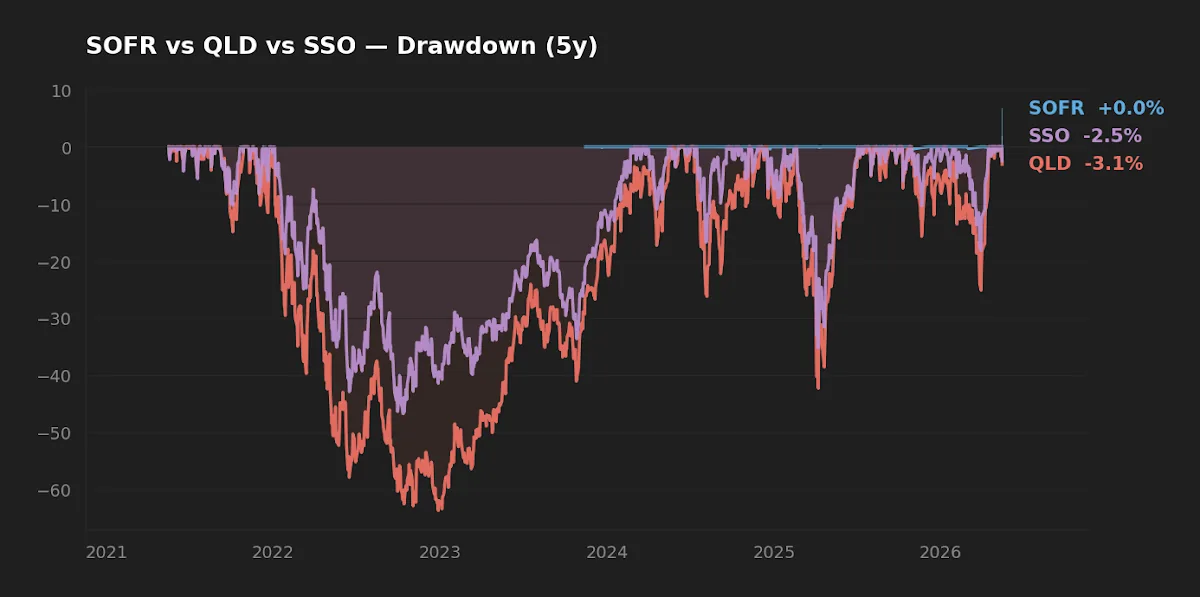
This is the non-obvious second-order effect worth holding onto: when rates rise sharply, an LETF holder is hit twice, in correlated fashion. The variance-drag literature treats financing cost as a constant baseline drift; in practice the financing cost is itself macro-sensitive and tends to spike in exactly the regimes where the underlying is selling off. The 1x holder pays no financing leg in either regime.
Counterintuitively, the current low-volatility regime (VIX 17.3, FRED, asof 2026-05-14) is the regime in which financing costs dominate total LETF cost. When realized volatility is low, the variance-drag term shrinks and the financing-drag term becomes the larger contributor to the LETF's underperformance versus its multiple of the index. In quieter markets, the cost-of-money problem is more visible. In high-vol regimes like March 2020, variance drag swamps it. Investors thinking about LETFs need both lenses, not just the volatility-decay one that dominates retail commentary.
Adjusting exposure to the macro regime
Three observations follow directly from the math:
- Rate cuts tighten the gap, asymmetrically. If the policy rate falls 100 bp from current levels, a 3x fund's annual financing drag falls by roughly 2 pp and a 2x by roughly 1 pp. Real money for a long-horizon holder. Interest Rate Cuts in 2026: What Happens to Stocks, Bonds, and Gold? works through the broader cross-asset implications.
- Rate hikes widen it the same way. The 3x suffers twice as much per pp of rate move as the 2x. Long-term holding of 3x products is therefore regime-sensitive in a way most prospectuses do not foreground — a holder is implicitly running a short position on the policy rate.
- Dealer-spread regime matters. In credit stress (2008, March 2020), spreads on equity total-return swaps widened materially — sometimes by 100 bp or more. The cost shock arrives precisely when underlying drawdowns are worst, which is the wrong direction for a leveraged book.
Scoreboard: where each instrument fits
| Category | Winner | Why |
|---|---|---|
| Cost (long-term core) | 1x broad index | No financing leg; expense ratios near 0.03–0.10% vs ~0.9% LETF base + ~5–9% financing |
| Realized risk | SSO over QLD | SSO 5Y max drawdown −46.7% vs QLD −63.7%; SSO realized vol 33.7% vs 44.8% |
| Realized return (5Y) | QLD | 24.9% 5Y CAGR vs SSO 19.6% — entirely a function of Nasdaq's run; not stable across regimes |
| Suitability for long-term core | Neither LETF | Hurdle rate at current short rates approaches long-run equity expectations |
FAQ
Is the financing cost actually deducted from NAV, or just an opportunity cost?
It is deducted from NAV. The fund pays the financing leg of the swap to the dealer in cash, and that payment reduces the fund's net assets daily. It is a real cash flow embedded in the fund's mechanics, not a hypothetical.
Is the reference rate the actual Fed Funds rate, or something else?
Most LETF swap agreements reference either the Effective Federal Funds Rate or SOFR (Secured Overnight Financing Rate), reset daily, plus a small dealer spread. SOFR has been dominant since the LIBOR transition completed in 2023. The two rates track within a few basis points in normal markets.
Does this mean leveraged ETFs should never be held?
No. It means the macro regime is a first-order input alongside horizon and the underlying's volatility. A short-horizon trader and a long-horizon holder face very different cost equations. Leveraged ETF vs Normal ETF and The Complete Guide to Leveraged ETF Investing walk through which use cases survive at current rates.
Do inverse ETFs (SH, SQQQ) have the same cost structure?
Inverse leveraged ETFs receive a financing leg rather than pay one, so the cost-of-money asymmetry runs the other way. They have other structural costs, though — variance drag is typically more punishing on a short position, and the short side of equity total-return swaps embeds equity borrow costs, which can be expensive for hard-to-borrow underlyings.
Why don't issuers advertise the financing cost more prominently?
It is disclosed in the prospectus and appears as part of "other expenses" or in swap-agreement footnotes, but it is not summarized into a single advertised figure the way the expense ratio is. The financing cost is dynamic — it changes daily with short rates — which makes a single headline number structurally awkward.
What this analysis can and can't tell you
The drag estimates above use static assumptions: a flat 40 bp dealer spread, a single representative expense ratio per leverage tier, and a financing rate equal to current Fed Funds. Real fund mechanics are dynamic. Dealer spreads vary by counterparty, underlying liquidity, and market stress; expense ratios differ across issuers; the financing rate is reset daily and weighted by intraday rebalancing flows. The figures here are first-order approximations suitable for sizing the regime effect, not exact attribution. For a specific fund's realized cost, the issuer's annual report and the swap-agreement schedule are the primary sources. The 5Y CAGR figures for QLD and SSO also reflect a single, exceptionally trending regime; reading them as a forward expectation would be a serious case of single-regime risk.
Scenarios where each instrument fits
Reader in 30s, taxable account, long horizon, no current leverage: a 1x broad-market index (VOO/VTI on the S&P/Total Market or QQQM on the Nasdaq-100) is the natural core. The hurdle rate for a 2x or 3x to beat it at current short rates is high enough that a satellite-only role makes more sense than core exposure.
Reader running a tactical sleeve and watching the rate path: a small SSO allocation as a satellite can be defensible if the explicit thesis is rate cuts plus contained vol, and if the sleeve is sized to be irrelevant to the long-term plan when wrong. QLD's higher realized vol and deeper drawdown make it the more macro-sensitive choice within the 2x universe.
Reader holding 3x as a long-term core: the math at 3.64% short rates is genuinely punishing. Re-reading the prospectus financing-cost language and running the hurdle-rate calculation against a realistic long-run index CAGR is worth the half-hour.
Key takeaways
- Leveraged ETF cost has two layers: a fixed expense ratio of ~0.87–0.95% and a variable financing cost that scales with (L−1) × short rates.
- At today's 3.64% Fed Funds, the financing leg adds roughly 5% annual drag for 2x and 9% for 3x products before any volatility decay — a regime change from the near-zero financing of 2020–2021.
- The hurdle rate for 3x to match a 1x position over multi-year periods is now in the 10–12% CAGR range, which is at or above long-run equity expectations.
- Rate sensitivity is asymmetric: a 1 pp move in short rates moves 3x annual drag by 2 pp. A long-horizon LETF holder is implicitly running a short policy-rate position.
- In a low-vol regime like the current one (VIX 17.3), financing drag is the larger share of total LETF cost; in high-vol regimes, variance drag dominates.
Editor's read
The case for any leveraged ETF as a long-term core position has always been narrow. At current short rates it is very narrow for 3x products and structurally fragile for 2x. The right mental model is that LETF exposure is a tactical position taken into specific regimes — low and falling rates, contained volatility, durable trends — not a buy-and-hold core. When the financing leg costs 9% per year on a 3x fund, the underlying has to do the work of paying that financing before it does any work for the holder. Of the two ProShares 2x products, SSO's lower realized volatility (33.7% vs QLD's 44.8%) and shallower 2022 drawdown (−46.7% vs −63.7%) make it the more defensible satellite if the use case truly demands 2x equity beta — but neither belongs in a long-term core sleeve at today's short rates.
Editor's holdings disclosure: the editor does not hold QLD or SSO at the time of writing.
Methodology
Fund data (expense ratio, AUM, inception, NAV, 5Y/10Y CAGR, realized vol, max drawdown) pulled from yfinance on 2026-05-16, cross-checked against the ProShares fund pages for QLD and SSO. Macro figures from FRED: Effective Federal Funds Rate (FEDFUNDS) at 3.64% asof 2026-04-01; 10-Year Treasury Constant Maturity (DGS10) at 4.47% asof 2026-05-14; CBOE Volatility Index (VIXCLS) at 17.26 asof 2026-05-14; CPI year-over-year (CPIAUCSL) at 3.9% asof 2026-04-01. Fund mechanics described from publicly available issuer prospectus disclosures (ProShares, Direxion). Drag calculations are first-order approximations: Drag ≈ (L − 1) × (financing rate + 40 bp dealer spread) + ~0.9% expense ratio. Variance-drag estimates use the standard L(L−1)σ²/2 approximation, ignoring trending-market offsets. Window analyzed: 5-year and 10-year trailing through 2026-05-16. Pulled 2026-05-16.
This article is for educational purposes and does not constitute personalized financial advice. See Disclaimer.