
The short version
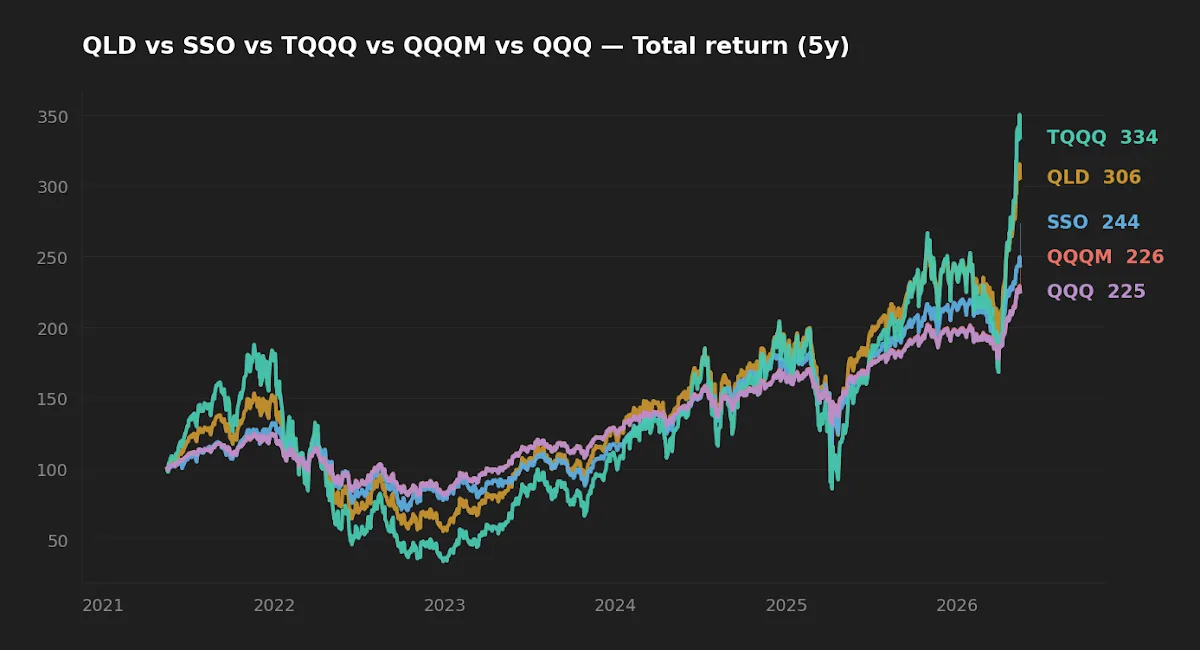
- Over the last five years QLD compounded at 24.9% versus QQQ's 17.6% — meaningful, but well short of the naive "2x" expectation of roughly 35% once volatility drag and financing costs are subtracted.
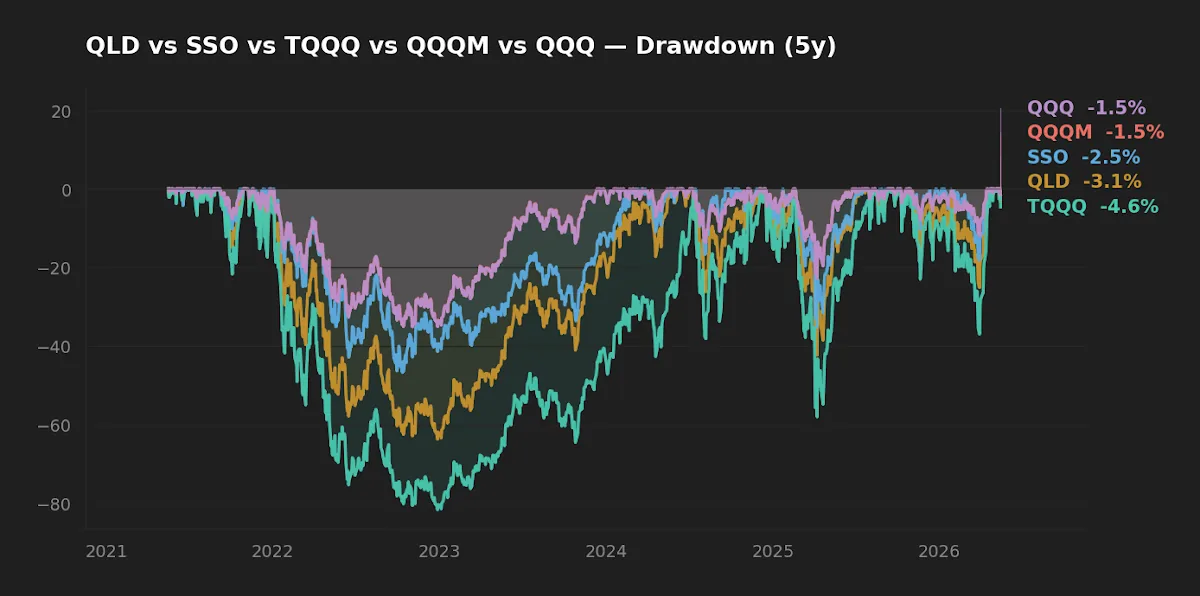
- SSO's realized drawdown of −46.7% is close to twice the unleveraged S&P 500's typical bear-market loss; QLD's −63.7% required a 175% recovery from the trough to break even.
- With the 10Y Treasury at 4.47% and Fed funds at 3.64%, the implicit financing cost embedded in 2x swap exposure is currently a larger headwind than the printed expense ratio.
The question isn't really whether QLD or SSO is "better." It's whether either belongs in a long-horizon core at all, and if the answer is "a small satellite, sized honestly," which one survives the math more gracefully. The five-year window from 2021 through 2026 covers a sharp drawdown, a fast recovery, and a long bull leg — enough of a sample to start separating skill from regime luck, though not enough to settle the question.
This piece looks at QLD (ProShares Ultra QQQ, 2x Nasdaq-100) and SSO (ProShares Ultra S&P 500, 2x S&P 500) using yfinance data pulled 2026-05-17, with realized risk and return cross-referenced against the unleveraged QQQ and QQQM. The goal is not to recommend a holding. It is to make the trade-off visible.
Context: what these products actually are
Both funds launched on the same day — 19 June 2006 — from the same issuer. They use total return swaps and futures to target daily 2x exposure to their respective indices. That daily reset is the structural feature that drives every conversation about leveraged ETFs: over multi-day, multi-week, and multi-year horizons, the realized multiple drifts away from 2x in a path-dependent way. Reset frequency interacts with realized volatility, and the interaction is almost always unfavorable when markets chop.
The macro backdrop matters more than the marketing suggests. Per FRED (asof 2026-05-14), the 10-year Treasury sits at 4.47% and the effective fed funds rate at 3.64% (asof 2026-04-01). Leveraged ETFs finance their notional exposure at short-term rates plus a spread; when overnight rates are near zero the financing line is invisible, but in a 3.5–4.5% rate regime it shows up clearly in realized tracking. The printed expense ratio is the smaller half of the all-in cost.
The data
| Metric | QLD | SSO | QQQM (ref) | QQQ (ref) |
|---|---|---|---|---|
| Underlying | Nasdaq-100 (2x daily) | S&P 500 (2x daily) | Nasdaq-100 (1x) | Nasdaq-100 (1x) |
| Expense ratio | 0.95% | 0.87% | 0.15% | 0.18% |
| AUM | $12.0B | $7.3B | $82.9B | $440.3B |
| Inception | 2006-06-19 | 2006-06-19 | 2020-10-13 | 1999-03-10 |
| Distribution yield | 0.2% | 0.7% | 0.5% | 0.4% |
| 5Y CAGR | 24.9% | 19.6% | 17.6% | 17.6% |
| 10Y CAGR | 35.8% | 24.2% | n/a | 21.8% |
| 5Y annualized vol | 44.8% | 33.7% | 22.3% | 22.4% |
| 5Y max drawdown | −63.7% | −46.7% | −35.0% | −35.1% |
Data: yfinance, pulled 2026-05-17. Expense ratio, AUM, distribution yield, and inception are cross-checked against issuer fact sheets: ProShares QLD, ProShares SSO, Invesco QQQM, Invesco QQQ.
Realized leverage versus the brochure number
If 2x exposure compounded cleanly, QLD's five-year CAGR would sit near 2 × 17.6% = 35.2%. The realized number is 24.9% — a 10.3 percentage point gap. That gap has three components, and the labels matter:
- Volatility drag. The arithmetic of daily compounding penalizes leveraged exposure in proportion to the variance of the underlying. With QQQ realizing roughly 22% annualized vol, the deterministic drag on a 2x daily-reset product is on the order of 4–5 percentage points per year, even before fees.
- Financing cost. The fund holds notional exposure equal to 200% of NAV. The "extra" 100% is financed at short rates. At today's 3.64% fed funds, that's roughly 3.5–4% per year flowing from the fund to swap counterparties — invisible on any fact sheet line, but visible in tracking.
- Expense ratio. The 0.95% printed fee is the smallest of the three drags, despite being the one retail commentary obsesses over.
SSO tells the same story with smaller numbers. Two times the S&P 500's 5Y CAGR (Vanguard VOO returned roughly 13% over this window) would be ~26%; realized is 19.6%. The 6–7 percentage point shortfall is again volatility drag plus financing plus fee, scaled to the S&P 500's lower realized vol.
The printed 0.95% expense ratio is the smallest of three drags on a 2x ETF. In a 3.6% rate regime, the swap financing line is roughly 4× larger than the fee — and it is nowhere on the fact sheet.
Realized risk: the asymmetry that hurts
QLD lost 63.7% from peak to trough during the 2022 drawdown. SSO lost 46.7%. The underlying QQQ lost 35.1%, so both products tracked very close to their nominal 2x multiple on the downside — leverage rarely fails to deliver on the loss side. The arithmetic of recovery is what compounds the damage:
- A 35% drawdown requires a 54% recovery to break even.
- A 47% drawdown requires an 88% recovery.
- A 64% drawdown requires a 178% recovery.
This is not a hypothetical. A QLD holder who entered at the November 2021 peak had to wait through the back half of 2022, all of 2023, and into 2024 before the position printed black again — over two years of drawdown duration. A QQQ holder reached the same milestone meaningfully sooner. The behavioral question — can you actually hold a position down 60% without trimming — is harder to answer in advance than the spreadsheet question.
The financing-cost regime shift most readers haven't priced in
From 2009 through 2021, the fed funds rate spent most of its time within a few basis points of zero. The financing line on a 2x ETF was effectively free, which made leveraged products look structurally cheap. That regime ended. With short rates now near 3.6% and the 10Y near 4.5% (FRED, asof 2026-05-14), the implicit financing on the 100% of notional that QLD and SSO borrow runs roughly 4% per year. Add the 0.87–0.95% expense ratio and the all-in cost of holding 2x leverage is closer to 5% than to 1%.
This matters for the long-term thesis. The historical 10Y CAGRs in the table (35.8% for QLD, 24.2% for SSO) were earned partly during the zero-rate era. The next decade of leveraged returns, at any given underlying return, will start the race roughly 3–4 percentage points behind where it started in 2015. That is not a prediction about market direction. It is an accounting identity about the cost of borrowed exposure.
For more on how the daily reset interacts with both volatility and financing, see Leveraged ETFs vs Index ETFs: What Daily Reset Actually Costs a Long-Term Holder and The Honest Math of Leveraged ETFs.
Scoreboard
| Category | Winner | Why |
|---|---|---|
| Cost (printed) | SSO | 0.87% vs 0.95% — 8 bp gap, modest but compounds |
| Realized 5Y return | QLD | 24.9% vs 19.6% — the tech tilt paid in this window |
| Realized 5Y risk | SSO | −46.7% drawdown vs −63.7%; 33.7% vol vs 44.8% |
| Survivability of holder | SSO | Smaller drawdown means lower probability of capitulation |
| Suitability as core holding | Neither | Daily reset, financing drag, and drawdown geometry argue against core status for either |
FAQ
Is the "2x is the sweet spot" framing correct? Partially. The Kelly-style argument that 2x is closer to the optimal growth-rate leverage for equities only holds under specific assumptions — log-normal returns, constant volatility, free financing. In a real environment with fat tails, volatility clustering, and 4%-ish funding costs, the optimal leverage for a passive holder collapses well below 2.
Does the 10Y CAGR mean QLD has actually delivered 2x QQQ over a decade? No. QQQ's 10Y CAGR is 21.8%; 2x would be ~43.6%. QLD's 10Y CAGR is 35.8% — a roughly 1.6x realized multiple over the decade, not 2x. The gap is volatility drag plus financing plus fees, accumulated.
Why does SSO drawdown more than 2x its underlying suggests in some windows? Because the 2x multiple is reset daily. In a multi-day decline with intra-period whipsaw, the compounded loss can exceed (or fall short of) the simple 2x of the index loss. SSO's −46.7% versus the S&P 500's roughly −25% over the same window reflects exactly this path effect.
Is there a position size at which leveraged ETFs make sense? Investors who use them tend to treat them as a small satellite — single-digit percent of equity allocation — sized so that even a total loss is recoverable from ongoing contributions. That is a behavioral construction, not an endorsement.
What about a defined holding period, like one to three years? A shorter, tactical horizon is the use case these products were designed for. The daily reset is a feature when you hold for days, a tax on you when you hold for years.
What this comparison can and can't tell you
The five-year window analyzed here covers a single full cycle dominated by the post-2021 rate shock and the AI-driven mega-cap rally. It does not include the 2008 financial crisis or the 2000–02 dot-com collapse — both of which would have produced QLD-equivalent drawdowns well past −80%. Treating five-year CAGRs as a steady-state estimate of future returns ignores survivorship bias in the sample. The all-in financing drag is also regime-dependent: if short rates return to zero, the math improves materially. If they rise further, it worsens.
One thing the data cannot tell us is whether a given investor would actually hold through a −60% drawdown. Backtests assume infinite patience. Live accounts don't.
Scenarios where each fund fits
- Tactical trader with a defined horizon (days to weeks): SSO offers cleaner exposure with lower vol-drag arithmetic; QLD offers more concentrated AI/mega-cap beta.
- Long-horizon investor wanting a small leveraged satellite: SSO is the more forgiving choice — diversification across 500 names dampens the path dependency. Sizing at a few percent of equity allocation is the relevant control variable, not which fund.
- Investor whose core is already Nasdaq-heavy (QQQM, single-stock tech): Adding QLD layers concentration on top of concentration. SSO would diversify the leverage exposure.
- Retirement-account holder in a long bear or sideways regime: Neither. The financing drag and reset arithmetic make both structurally unfriendly when the underlying doesn't trend.
For the broader framework on whether leverage belongs in a long-horizon portfolio at all, see Can Leveraged ETFs Be Part of a Long-Term Portfolio?
Editor's read
Initially the editor expected QLD's five-year edge over SSO to look more decisive. It doesn't, once the realized leverage multiple is computed properly: QLD delivered ~1.4x QQQ's CAGR, not 2x, while accepting nearly 2x the drawdown. SSO is the cleaner instrument of the two — lower vol, smaller drawdown, broader diversification — but the more useful conclusion is that neither belongs in the long-horizon core for most investors. The current rate regime widens the financing gap, and the geometry of −47% and −64% drawdowns asks more of a holder than spreadsheets capture. If a leveraged satellite is on the table at all, SSO sized at a single-digit percent of equities is the more defensible expression.
The editor does not hold QLD, SSO, or any 2x or 3x leveraged equity ETF in the long-term core sleeve at the time of writing.
Methodology
Price and total-return series were pulled from yfinance on 2026-05-17. CAGR is computed from daily close-to-close total return over the trailing 5-year window (and 10-year where available). Annualized volatility is the standard deviation of daily log returns × √252. Max drawdown is the deepest peak-to-trough decline over the same window. Expense ratio, AUM, distribution yield, and inception date are reconciled to issuer fact sheets (linked above). Macro reference rates are sourced from FRED with asof dates noted inline. No transaction costs, bid-ask spreads, or taxes are modeled; for leveraged ETFs in particular, real-world tracking error tends to exceed the gross calculation shown here.
This article is for educational purposes and does not constitute personalized financial advice. See Disclaimer.