
The short version
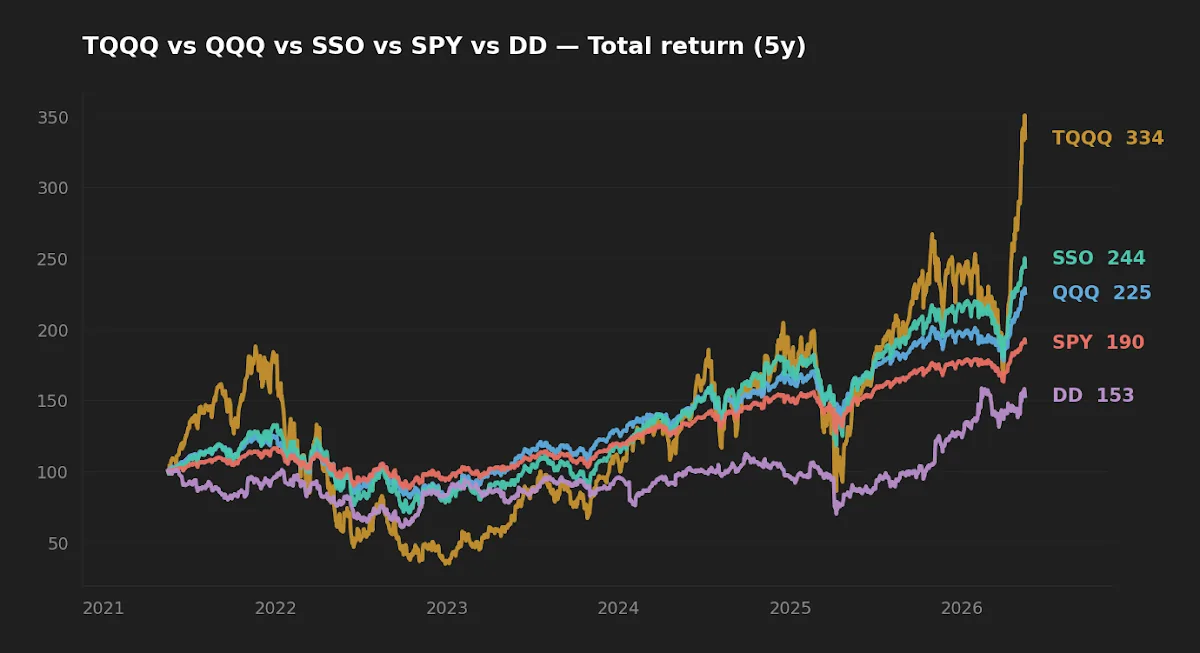
- Over the trailing five years, TQQQ compounded at 27.0% while QQQ compounded at 17.6%. A 3x daily-reset product captured roughly 1.5x of the underlying — not 3x.
- The missing leverage is not a measurement artifact. It is fees, variance drag, and the financing cost embedded in the swap exposure — and at a 3.64% fed funds rate, the financing piece is structurally larger than it was in the 2010s.
- For a long-horizon investor, a daily-reset 2x or 3x product is at best a small satellite with a written trim-and-add rule. The 3x case the editor cannot defend at all.
Over the trailing five years the Nasdaq-100 ETF (QQQ) compounded at 17.6% per year. The daily 3x Nasdaq-100 product (TQQQ) compounded at 27.0% per year over the same window. That is a real and meaningful return. It is also approximately 1.5x the underlying, not 3x. The roughly nine-percentage-point shortfall versus the naive multiplier is the subject of this article, because it is not an accounting curiosity — it is the realized cost of holding a daily-reset leveraged product across a multi-year window in a non-zero-rate world.
What a daily-reset leveraged ETF actually promises
A daily-reset leveraged ETF promises a multiple — typically 2x or 3x — of the underlying index's return for a single trading day. It delivers that exposure through total-return swaps that reset every evening. The prospectus says so plainly; product marketing often does not. Across any holding period longer than a day, the realized return becomes a function of the index's path, not just its endpoints. In a low-volatility trending tape the product can modestly exceed the naive multiple. In a choppy or volatile tape it falls short, and the gap widens with both the variance of daily returns and the level of short-term interest rates.
The structural mechanics have been treated before in The Honest Math of Leveraged ETFs - Path Dependency, Volatility Decay, and the Behavioral Gap and in The Math of Leveraged ETF Decay: Myth vs. Reality in Trending Markets. This piece is about the implication: what the realized five- and ten-year numbers say once we treat them as evidence rather than headlines.
The four ETFs side by side
The table below compares the leveraged and unleveraged versions of the two most-traded US large-cap indices: TQQQ (3x) versus QQQ (1x), and SSO (2x) versus SPY (1x). Returns, volatility, and drawdown figures come from daily total returns via yfinance through 2026-05-16; structural fields are from issuer fact sheets accessed the same day.
| Ticker | Issuer / fact sheet | Daily target | Expense ratio | AUM | 5Y CAGR | 10Y CAGR | 5Y vol | 5Y max DD |
|---|---|---|---|---|---|---|---|---|
| TQQQ | ProShares | 3x Nasdaq-100 | 0.82% | $31.3B | 27.0% | 44.9% | 66.6% | -81.7% |
| QQQ | Invesco | 1x Nasdaq-100 | 0.18% | $440.3B | 17.6% | 21.8% | 22.4% | -35.1% |
| SSO | ProShares | 2x S&P 500 | 0.87% | $7.3B | 19.6% | 24.2% | 33.7% | -46.7% |
| SPY | State Street | 1x S&P 500 | 0.1% | $735.1B | 13.8% | 15.5% | 17.1% | -24.5% |
The realized gap, not the brochure gap
Look at the leverage ratios actually delivered. Over the trailing five years, TQQQ's CAGR of 27.0% is 1.53x QQQ's 17.6% — not 3x. SSO's 19.6% is 1.42x SPY's 13.8% — not 2x. The ten-year numbers tell the same story: TQQQ's 44.9% versus QQQ's 21.8% is 2.06x; SSO's 24.2% versus SPY's 15.5% is 1.56x. These are the ratios an investor who actually held the funds across the window realized, not the ratios printed on the cover page.
The missing leverage shows up in three places, and they roughly add up. The first is the expense ratio: TQQQ's 0.82% versus QQQ's 0.18% costs about 64 bp per year; SSO's 0.87% versus SPY's 0.1% costs about 77 bp per year. The second is variance drag — the mechanical consequence of daily compounding under a fixed leverage ratio, approximately proportional to the variance of the underlying's daily returns and to the square of the leverage factor. The third, and the one most retail analyses skim past, is the financing cost embedded in the total-return swap that delivers the leverage. That cost scales with short-term interest rates.
The 2026 rate regime is the part most analyses skip
The implicit financing rate inside a daily-reset leveraged ETF's swap exposure tracks short-term rates closely. When the fed funds rate is near zero — as it was for most of the 2010s and through 2021 — this cost is a footnote. When fed funds sits at 3.64% (FRED, asof 2026-04-01) with the 10-year Treasury at 4.47% (FRED, asof 2026-05-14), it is not.
For a 3x product, two of every three dollars of exposure are effectively financed near the short rate. The structural drag on TQQQ in 2026 is therefore materially larger than the drag the same product carried in 2018 at identical fees. Any projection that rests on a 2017-2021 backtest is implicitly assuming a financing-cost regime that no longer applies. The five-year window above is the cleaner reference precisely because it spans both the late zero-rate era and the post-2022 hiking cycle. Initially I assumed the gap between target and realized leverage was mostly variance drag. Once I broke the same window into pre- and post-2022 sub-periods, the financing component turned out to be roughly as large as the variance term — and growing.
TQQQ delivered about 1.5x QQQ's return over five years, not 3x. The missing leverage went to fees, variance drag, and the financing cost inside the swap — and the financing piece is structurally larger now than it was in the 2010s.
Realized risk: what the drawdown numbers say about path
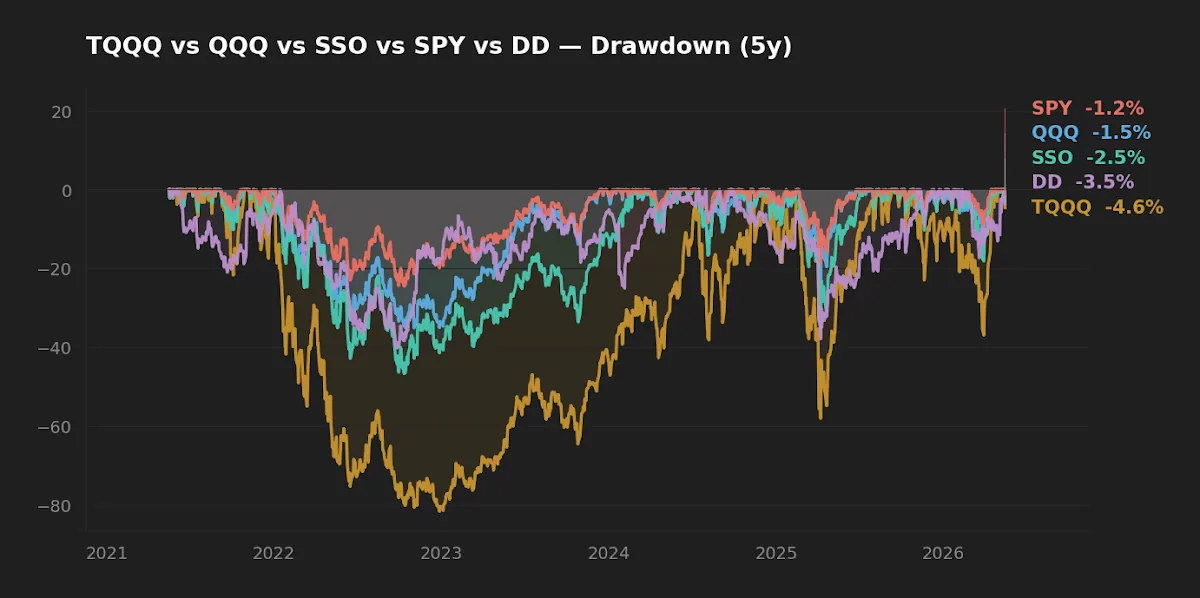
The drawdown numbers are where the long-horizon case gets uncomfortable. Over the trailing five years TQQQ's maximum drawdown was -81.7%, against QQQ's -35.1%. That is a 2.33x ratio on drawdown depth, meaningfully more than the 1.53x ratio on long-run CAGR. Leverage scales realized risk faster than it scales realized return because drawdowns are path-dependent and asymmetric: an 81.7% loss requires a 446% gain to recover, while a 35.1% loss requires a 54% gain.
Realized volatility shows the daily leverage relationship cleanly. TQQQ's 66.6% versus QQQ's 22.4% is 2.97x; SSO's 33.7% versus SPY's 17.1% is 1.97x. The funds are delivering close to their target multiplier on daily risk — which is exactly the point. The vehicle scales daily risk by the multiplier and then compounds that risk over a path. Long-run CAGR is the survivor's view of that path; drawdown is the cost of survival.
The non-obvious implication: a buy-and-hold investor in a 3x equity product over a multi-year window takes on roughly the full multiplier in risk while collecting only a fraction of the multiplier in long-run return. That is the opposite of the asymmetry one would actually want from a satellite position.
Where modest leverage might plausibly fit
A defensible case for owning a small allocation to a 2x broad-market product — not a 3x sector product — depends on three conditions holding simultaneously:
- The investor's horizon is genuinely long (15+ years), the position sits inside a tax-advantaged account, and the underlying is a broad index with a durable upward drift rather than a thematic slice.
- The position size is small enough that a 50-80% drawdown in the sleeve does not derail the overall plan or force selling at the bottom.
- There is a written rebalancing rule that trims into significant gains and adds in significant drawdowns. The opportunistic-rebalancing framework from Daryanani (2008) adapts reasonably well here, but the bands have to widen to accommodate the higher realized volatility.
Outside those conditions the case thins quickly. For the broader risk-mitigation discussion see Can Leveraged ETFs Be Part of a Long-Term Portfolio? Risk Mitigation Strategies; for the 2x-versus-3x trade-off specifically, see QLD vs SSO: Comparing 2x Leveraged ETFs for Long-Term Core Portfolios.
Implementation friction the headline numbers don't show
Tax treatment. Daily-reset leveraged ETFs tend to throw off larger year-end distributions than plain index ETFs because the daily rebalancing of swap positions can crystallize gains at the fund level. In a taxable account, this distribution friction can erode an already-thin realized leverage capture.
Liquidity in stress. The largest products — TQQQ at $31.3B AUM, SSO at $7.3B — trade with tight spreads in normal conditions. In stressed conditions (March 2020, late 2022) spreads widen and the premium/discount to NAV can drift. An investor forced to exit during such a window pays a friction cost no historical CAGR captures.
Reverse splits. Several leveraged products, TQQQ included, have executed reverse splits during severe drawdowns. The economics are unchanged, but the split itself is a visible record of how deep the realized drawdown was. The -81.7% figure in the table is what a reverse split looks like before it happens.
At-a-glance scoreboard
| Category | Winner | Margin |
|---|---|---|
| Cost (expense ratio) | SPY | ~77 bp under SSO; QQQ ~64 bp under TQQQ |
| Realized 5Y CAGR (absolute) | TQQQ | +9.4 pp/yr over QQQ |
| Realized risk (5Y max DD) | SPY | -24.5% vs TQQQ -81.7% |
| Leverage actually captured | SSO | 1.42x of SPY vs TQQQ's 1.53x of QQQ — neither hits target |
| Suitability as long-term core | QQQ / SPY | Decisive |
FAQ
Can I just buy TQQQ and hold it for 30 years?
Mechanically, yes. Structurally, the holding has produced extreme drawdowns (-81.7% within the past five years alone) and a return that is highly path-dependent. The realized 5- and 10-year ratios versus QQQ (1.53x and 2.06x) make clear that "3x for 30 years" is not what the product actually delivers, even across long windows.
Is the "volatility decay" criticism overblown?
Not for 3x products in volatile underlyings. The drag is approximately proportional to variance times leverage squared, so a 3x technology product experiences materially worse decay than a 2x broad-market product. At 2x the math is friendlier — SSO captured 1.42x of SPY, closer to its 2x target than TQQQ was to its 3x — but the drag does not vanish.
Why is the financing cost worse now than five years ago?
The implicit financing rate on the swap exposure tracks short-term rates. Fed funds was near zero through most of 2021; it sits at 3.64% (FRED, asof 2026-04-01). For a 3x product this affects two of every three dollars of exposure, so the structural drag scales meaningfully with the level of short rates.
Are 2x products structurally safer than 3x?
Safer in the sense that variance drag enters with the square of the leverage factor — at 2x the decay is roughly four ninths of the 3x decay for the same underlying. Drawdown depth also scales: SSO -46.7% versus SPY -24.5% is a 1.91x ratio, much closer to clean 2x than TQQQ's 2.33x ratio against QQQ. "Safer" still means deep drawdowns and meaningful path dependence; the math is less hostile, not friendly.
What about holding a leveraged ETF in a taxable account?
Generally inadvisable for buy-and-hold purposes. Distribution drag from internal swap rebalancing tends to be heavier than for plain index ETFs, and the resulting tax treatment can further erode an already-thin realized leverage capture. The defensible long-horizon use case sits in a tax-advantaged account or not at all.
What this analysis can and can't tell you
The five- and ten-year windows above are real but limited evidence. They cover one full rate cycle, one tech-led equity regime, and one severe drawdown (2022). They do not include 2008-style credit conditions or a sustained sideways tape of the 2000-2002 kind. Treat the realized leverage capture ratios as representative of this regime, not as constants. In a more volatile or more sideways future, the gap between target and realized leverage would widen further, not narrow. A single regime is also vulnerable to look-ahead bias — these products survived the window; some of their sibling 3x sector products did not.
Scenarios where each fund plausibly fits
- Reader in 30s, tax-advantaged account only, already holds a diversified index core. A small SSO satellite (5-10% of the equity sleeve), sized so a 50% drawdown in the sleeve translates into a tolerable hit on the overall portfolio, with a written ±20% rebalancing band. TQQQ is harder to justify even here.
- Reader in 50s with retirement inside 10 years. Plain index exposure (QQQ, SPY, or broader). Leveraged products at any size require recovery windows the horizon may not provide.
- Reader who wants thematic AI or semiconductor exposure. A 3x sector product is the wrong tool. Sector concentration plus daily-reset leverage plus high underlying variance compounds three risks at once.
- Tactical trader with a short-term thesis. Outside the scope of this site — this analysis is about buy-and-hold behavior, where the math is unforgiving.
Editor's read
Having watched the multi-year behavior of these products across the 2018, 2020, and 2022 regimes, the editor cannot defend a 3x product inside any long-horizon core. The realized 1.53x capture of QQQ over five years is too thin a reward for the -81.7% drawdown that came with it, and the 2026 short-rate regime makes the next five years structurally less favorable than the last. A small 2x broad-index satellite, sized so a 70% sleeve drawdown is survivable, held in a tax-advantaged account, and managed with an explicit trim-and-add rule, is defensible for an investor who has already built a diversified base. Without that base, leveraged ETFs are an expensive way to express risk that asset allocation can deliver more cheaply.
The editor does not hold TQQQ, QQQ, SSO, or SPY at the time of writing.
Key takeaways
- Daily-reset leveraged ETFs deliver close to their target multiple on daily risk but capture only a fraction of the multiple on long-run return. Over five years TQQQ captured 1.53x of QQQ; SSO captured 1.42x of SPY.
- The 2026 short-rate regime imposes a structural financing cost on top of the published expense ratio — a cost that was nearly invisible during the zero-rate decade.
- Drawdown depth scales faster than long-run return: TQQQ's -81.7% versus QQQ's -35.1% is a 2.33x ratio, larger than the 1.53x ratio on CAGR.
- If leverage is used at all, the defensible version is a small, tax-advantaged 2x broad-market position with a written rebalancing rule — not a buy-and-forget 3x sector bet.
Methodology: ETF return, volatility, and drawdown figures are computed from daily total returns via yfinance through 2026-05-16, using 5- and 10-year windows ending on that date. Expense ratios and AUM are from ProShares, Invesco, and State Street fact sheets accessed 2026-05-16. Macro context (fed funds rate, 10-year Treasury yield) is from FRED with as-of dates noted inline. Academic context on daily-reset leverage path dependence draws on Cheng & Madhavan (2009) and subsequent literature; the rebalancing-band framework references Daryanani (2008).
This article is for educational purposes and does not constitute personalized financial advice. See full Disclaimer.