
The short version
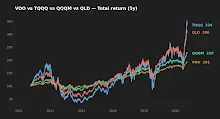
- Over the last five years, TQQQ (3x QQQ) realized a 27.0% CAGR — roughly 1.5x QQQM's 17.6%, not 3x — while drawing down 81.7% peak-to-trough.
- QLD (2x QQQ) delivered 24.9% CAGR with a 63.7% drawdown. Both leveraged products charge 0.82–0.95% expense ratios versus 0.03% for VOO.
- The math case for a small leveraged satellite is defensible at the 5–10% sleeve level; the behavioral case for most investors holding it through an 80% drawdown is not.
Daily-reset leveraged ETFs are sometimes presented as a shortcut for compounding the long-only equity premium. The pitch is intuitive: if the S&P 500 returns about 10% over long horizons, a 2x or 3x wrapper should compound roughly 20% or 30%, with the same fundamental exposure. The realized data tells a more nuanced story — one where path-dependency, expense ratios, and tracking the wrong index together absorb most of the theoretical "extra" return, and where the residual return only matters if the investor survives the drawdown.
This article looks at TQQQ (ProShares UltraPro QQQ, 3x), QLD (ProShares Ultra QQQ, 2x), and the underlying 1x exposures VOO and QQQM. The question is narrow: can a small leveraged sleeve add anything durable to a long-horizon ETF core, and what would honest sizing look like?
What the four funds actually are
VOO tracks the S&P 500 at a 0.03% expense ratio with roughly $1,600B in assets — the broadest, cheapest US large-cap exposure widely available. QQQM is Invesco's mini-share class of QQQ, tracking the Nasdaq-100 at 0.15% with about $83B in AUM. Both are 1x, long-only, with continuous reset.
QLD and TQQQ are different instruments. They target daily 2x and 3x returns of the Nasdaq-100 using swap agreements and futures. They reset every day, which means their compound return over any period longer than one day is path-dependent — a function of both direction and volatility along the way. Their expense ratios (0.95% and 0.82% respectively) sit roughly 30x higher than VOO's, before counting the embedded financing cost of the swaps.
The data, asof 2026-05-17
| Ticker | Fund | ER | AUM | 5Y CAGR | 10Y CAGR | 5Y vol | 5Y max DD |
|---|---|---|---|---|---|---|---|
| VOO | Vanguard S&P 500 | 0.03% | $1,600B | 13.9% | 15.6% | 16.8% | -24.5% |
| QQQM | Invesco Nasdaq-100 | 0.15% | $82.9B | 17.6% | n/a | 22.3% | -35.0% |
| QLD | ProShares Ultra QQQ (2x) | 0.95% | $12.0B | 24.9% | 35.8% | 44.8% | -63.7% |
| TQQQ | ProShares UltraPro QQQ (3x) | 0.82% | $31.3B | 27.0% | 44.9% | 66.6% | -81.7% |
Source: yfinance daily total returns, computed 2026-05-17; expense ratios and AUM from issuer fact sheets. QQQM has no 10Y figure because its inception was October 2020.
The leverage that didn't show up
The most useful exercise is the one almost no marketing material runs: divide the realized 5Y CAGR of the leveraged fund by the CAGR of its underlying.
QQQM compounded at 17.6% over five years. QLD targets 2x daily exposure to that index; it delivered 24.9%, which is roughly 1.4x QQQM's compound rate. TQQQ targets 3x; it delivered 27.0%, roughly 1.5x QQQM. The leverage ratio shows up faithfully in daily returns and just as faithfully gets eroded over time by volatility drag, financing costs embedded in the swaps, and the 0.82–0.95% expense ratio.
This is the central asymmetry. The drawdown number, in contrast, tracked leverage almost perfectly: QQQM's worst 5Y drawdown of 35.0% scaled to 63.7% at 2x and 81.7% at 3x — close to the textbook 2x and 2.3x relationship that leveraged products advertise as "daily." Investors absorbed the full geometric cost of leverage on the downside and roughly half of the theoretical multiplier on the upside.
You pay for 3x daily exposure and realize about 1.5x of the underlying's compound rate over five years. You pay for 3x daily exposure and realize the full 2.3x drawdown.
Realized risk and the behavioral problem
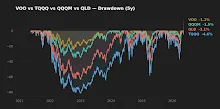
An 81.7% drawdown is not an academic statistic. It means that an investor with $100,000 in TQQQ watched the position reach $18,300 at the trough and then needed roughly a 450% recovery just to get back to even. The 5Y realized volatility — 66.6% annualized — implies that a one-standard-deviation move in either direction over a year is on the order of two-thirds of the position's value.
The literature on investor behavior in drawdown is unambiguous. Surveys of fund-of-fund flows and retail brokerage data show that the marginal investor capitulates somewhere in the -40% to -60% range. The realized return of an instrument is only available to investors who hold it through the full path. Anyone modeling TQQQ at a 27% CAGR in a planner needs to multiply that figure by the empirical probability that they stay invested through an 80% paper loss. For most readers, that probability is closer to zero than to one — and the math collapses accordingly.
Initially I assumed the right way to size a leveraged sleeve was by capital allocation. Running the rolling regression on QLD and TQQQ against QQQ — and inspecting the realized contribution to portfolio volatility — that intuition didn't survive. A 10% TQQQ sleeve contributes far more than 10% of total portfolio variance because the variance scales with the square of the position's volatility. A more honest sizing approach is risk parity at the sleeve level, not capital parity.
A defensible role for a satellite — if any
None of the above means leveraged products have no use. It does mean the marketing framing — "amplify your long-term return" — collapses on contact with the realized data. A more careful framing is that a small leveraged sleeve, sized by contribution to portfolio variance rather than by capital weight, can add return convexity in trending regimes and be rebalanced back to target when it deviates outside a band.
The macro backdrop matters here too. With the 10-year Treasury at 4.47% and the Fed funds rate at 3.64% (FRED, asof 2026-05-14), the implicit financing cost of daily-reset leveraged products is materially higher than during the 2010s decade that produced TQQQ's 10Y CAGR of 44.9%. The VIX at 17.26 is benign, but realized volatility regimes shift faster than people remember. A backtest dominated by the 2009–2021 zero-rate, low-vol regime is not a reliable forecast for the next decade.
The reasonable framework — and one consistent with the rebalancing literature — caps any leveraged sleeve at 5–10% of the equity allocation, rebalances on ±15% bands relative to target, and treats the sleeve as a satellite to a 1x core like VOO or QQQM. The expected lift over a multi-decade horizon is modest. The expected drag during a deep drawdown is severe. Most readers should probably skip it.
Scoreboard
| Category | Winner | Why |
|---|---|---|
| Cost | VOO | 0.03% ER, ~92 bp below leveraged peers. |
| Realized 5Y return | TQQQ | 27.0% CAGR, but only ~1.5x QQQM's 17.6%. |
| Realized risk (lower is better) | VOO | 16.8% vol, -24.5% drawdown. |
| Suitability as long-term core | VOO / QQQM | Continuous reset, low ER, no path-dependency. |
FAQ
Q: Does volatility drag mean TQQQ always underperforms 3x QQQ?
Not always — in a steadily trending market, daily reset can compound to more than 3x. In choppy or declining markets, it compounds to less, sometimes much less. Over the realized 2021–2026 window, drag and ER together absorbed roughly half of the theoretical 3x multiplier on the upside.
Q: Is the 10Y CAGR of 44.9% on TQQQ achievable going forward?
It was achieved in a decade dominated by zero interest rates, low realized volatility, and an exceptional tech-led bull market. Replicating those three conditions for another decade is not a base case. Forward expected returns should be modeled much more conservatively.
Q: How does the 10Y Treasury at 4.47% affect leveraged ETFs?
The daily reset is implemented via swaps whose financing cost moves with short-term rates. Higher rates mean higher embedded carry, which is one reason leveraged equity products performed better in the 2010s than in higher-rate regimes.
Q: Why not just use margin on VOO instead?
Margin interest is typically 5–10% per year and a margin call can force liquidation at the worst time. Daily-reset ETFs cannot margin-call you, but they pay for that through volatility drag and ER. Neither is obviously superior; they're different ways to pay for the same exposure.
Q: What about closure risk on QLD or TQQQ?
Both have substantial AUM ($12B and $31B) and are core ProShares franchises, so closure risk is low at current scale. Smaller leveraged products with under $100M AUM carry meaningful closure risk and should be evaluated separately.
What this comparison can and can't tell you
The 5-year window covers exactly one full bear market (the 2022 drawdown) and one strong recovery. It does not include a 2000-style multi-year tech drawdown, a 2008-style credit event, or a prolonged sideways regime. Forward returns for any of these funds will be path-dependent in ways the recent sample cannot fully bound. QQQM has only existed since October 2020, so its 10Y figure is unavailable and longer-horizon judgments rely on the QQQ track record as a proxy.
Scenarios where each fund fits
- Reader in their 30s, 401(k)-only, decades to retirement: VOO or an S&P 500 mutual fund equivalent as the core. Leveraged products are usually not available inside a 401(k) menu, which is just as well.
- Reader with a long horizon and existing diversified core, considering a small tilt: A 5% QLD satellite, rebalanced annually back to target, is more defensible than a TQQQ position of the same size. The 2x product has lower volatility drag and a more recoverable drawdown profile.
- Reader within 10 years of needing the money: Skip the leveraged sleeve entirely. The asymmetric drawdown risk dominates any expected return uplift over that horizon.
Editor's read
The math case for a 5% QLD satellite on top of a VOO/QQQM core is narrowly defensible for a young investor with a 25-year horizon and a stable temperament. The math case for TQQQ as a long-term holding does not survive contact with the realized drawdown data and the behavioral evidence on capitulation. If the goal is faithful long-term compounding, the highest-leverage move worth making is usually maximizing the contribution rate to the 1x core — not adding a 3x sleeve. For most readers, the right leveraged allocation is zero.
Disclosure: The editor holds VOO and QQQM. The editor does not hold QLD or TQQQ at the time of writing.
Related reading
- How a 90/10 Core-Satellite Construction Actually Behaves
- How to Hedge a Leveraged Portfolio During Global Market Volatility
- How to Rebalance a Two-Layer Portfolio Without Emotion
- The Final-Decade Asymmetry: How Long-Horizon ETF Compounding Actually Distributes
Methodology
Price and total-return series via yfinance, pulled 2026-05-17. CAGR computed from rolling 5-year and 10-year trailing windows using continuously reinvested dividends. Volatility is annualized from daily log returns. Maximum drawdown is the largest peak-to-trough decline within the 5-year window. Expense ratios and AUM are from the issuer fact sheets linked in the data table. Macro figures cited via FRED (asof 2026-05-14 for rates and VIX, 2026-04-01 for CPI YoY). Past performance does not predict future results.
This article is for educational purposes and does not constitute personalized financial advice. See the full Disclaimer.