Photo by Egor Komarov on Unsplash
The short version
- IGV, WCLD, and QQQ are sold as "tech ETFs" but they are not interchangeable. QQQ is a diversified large-cap growth index, IGV is a concentrated software bet, and WCLD is a pure cloud-software equal-weight bet.
- Over the last five years the realized return ranking is QQQ (17.6% CAGR) > IGV (6.0%) > WCLD (-9.4%), with WCLD's max drawdown reaching -64.9%. Narrower thesis, higher dispersion.
- For a long-term core, QQQ is the only one of the three that behaves like a core holding. IGV is a software sleeve. WCLD is a thematic satellite whose live record is one full rates-cycle deep — and that cycle was not kind.
"Tech beta" is a phrase that hides more than it reveals. Three ETFs that frequently get lumped under it — Invesco QQQ, iShares Expanded Tech-Software (IGV), and WisdomTree Cloud Computing (WCLD) — actually express three different bets with three different risk profiles. Treating them as substitutes is how investors end up holding far more software concentration, or far more pre-profit growth equity, than they intended.
The question worth answering is not which one wins. It is what each one actually is, where each lives in a portfolio, and what the last five years tell us about how each behaves when the macro stops cooperating.
What the three funds actually are
The naming is misleading. All three have "tech" in their elevator pitch. Their construction is not similar.
QQQ tracks the Nasdaq-100: the 100 largest non-financial companies listed on the Nasdaq, market-cap weighted with rebalancing rules. It is sector-concentrated (heavy in Information Technology, Communication Services, and Consumer Discretionary) but it is not a tech-pure index. Costco, PepsiCo, and Amgen are in it. The largest seven or eight names — the usual mega-cap suspects — dominate the weight.
IGV tracks the S&P North American Expanded Technology Software Index. It is narrower than QQQ — software companies only, plus interactive home entertainment and interactive media — and modified market-cap weighted with a single-name cap (8%). The top holdings are typically Microsoft, Oracle, Salesforce, Adobe, SAP, ServiceNow, and the platform-software cohort. Roughly 30-40 holdings, depending on the rebalance.
WCLD tracks the BVP Nasdaq Emerging Cloud Index, an equal-weighted basket (subject to a tiered weighting cap) of companies that derive a majority of revenue from cloud software/services and meet revenue-growth thresholds. The equal-weight construction is the key design choice: it deliberately downweights the megacaps and tilts toward smaller, higher-growth, often-unprofitable cloud-native names. Snowflake, Datadog, Zscaler, Shopify, and the SaaS mid-cap cohort sit alongside larger names at similar weights.
One way to think about the stack: QQQ is the index, IGV is the sector, WCLD is the theme. As you move down the stack you give up diversification and gain factor purity — value in some regimes, ruin in others.
The numbers
All figures below are from yfinance as of 2026-05-16, with cross-reference to issuer fact sheets for fees, AUM, and methodology.
| Field | QQQ | IGV | WCLD |
|---|---|---|---|
| Issuer | Invesco | iShares (BlackRock) | WisdomTree |
| Inception | 1999-03-10 | 2001-07-10 | 2019-09-06 |
| Expense ratio | 0.18% | 0.39% | 0.45% |
| AUM | $440.3B | $12.1B | $0.23B |
| Trailing dividend yield | 0.4% | 0.0% | n/a |
| 5Y CAGR | 17.6% | 6.0% | -9.4% |
| 10Y CAGR | 21.8% | 16.6% | n/a (post-2019) |
| 5Y annualized vol | 22.4% | 27.5% | 37.0% |
| 5Y max drawdown | -35.1% | -45.9% | -64.9% |
| NAV (2026-05-16) | $708.75 | $91.78 | $28.62 |
Source: yfinance (price, NAV, distribution-adjusted return) cross-referenced with Invesco, iShares, and WisdomTree fact sheets for fee and AUM. WCLD has no 10Y figure because the fund launched in September 2019.
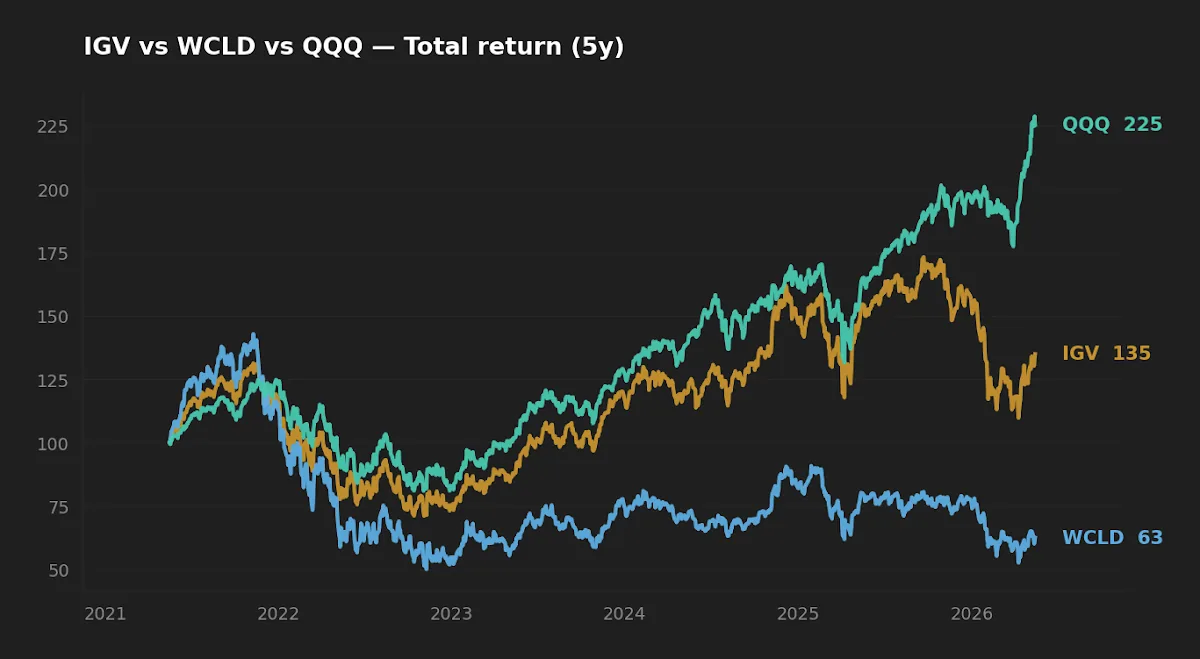
Two observations before the analysis. First, the 5Y vs 10Y gap is the entire story for IGV: the 10Y CAGR of 16.6% is respectable, the 5Y CAGR of 6.0% is not. That is one regime overwriting another, and any reader treating 5Y as the verdict is overweighting a single cycle. Second, WCLD's 5Y is negative — not "underperformed" — and its drawdown crossed two-thirds. That is not a tech fund behaving badly. That is a thematic fund behaving exactly as a thematic fund does when its thesis runs into 525 basis points of rate hikes.
Why the dispersion is this wide: the rate-cycle test
The 10-year Treasury sits at 4.5% and the fed funds rate at 3.6% (FRED, asof 2026-05-14 and 2026-04-01 respectively). That is the proximate frame, but the more important fact is the round-trip the last five years contained: zero-bound rates through 2021, the most aggressive hiking cycle since the early 1980s through 2023, and a slow normalization since. Long-duration equity got revalued — twice.
The three funds carry very different effective equity duration:
- QQQ: Megacap-weighted. The top names are profitable, free-cash-flow positive, and increasingly hold pricing power. Duration high but cushioned by current earnings.
- IGV: Software-heavy with a megacap tilt (Microsoft, Oracle, SAP, Adobe). Most holdings profitable. Duration higher than QQQ — software multiples are sensitive to discount rates — but anchored by cash-generative incumbents.
- WCLD: Equal-weighted cloud-native. Many holdings unprofitable or marginally so on GAAP. Maximum effective duration of the three. This is the cohort that gets repriced hardest when the discount rate moves.
The drawdown chart below shows the cohort behavior more cleanly than any return number.
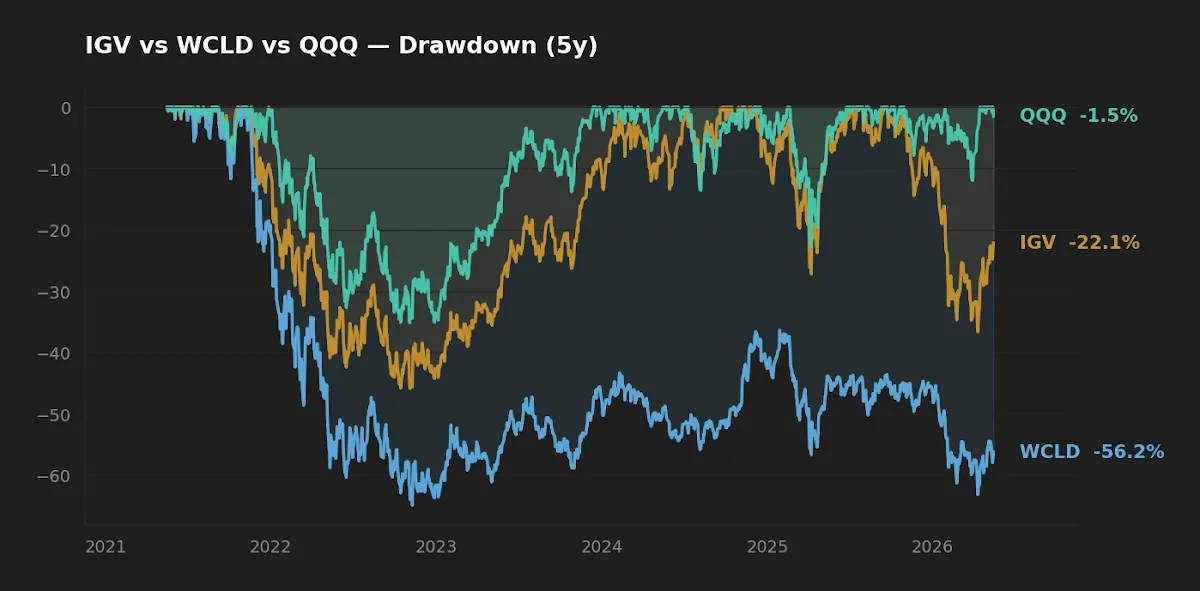
QQQ's worst trough was about -35%, recovered, and is at new highs. IGV's was -46%, recovered more slowly. WCLD's was -65%, and as of the price on 2026-05-16 it has not made a full new high since its 2021 peak. Recovery duration matters as much as drawdown depth for a buy-and-hold investor — and on duration, the three funds rank in the same order as their drawdowns.
The 10Y CAGR of 16.6% for IGV is respectable. The 5Y CAGR of 6.0% is not. That is one regime overwriting another — and treating either window as the verdict overweights a single cycle.
Cost, capacity, and the small-AUM question
QQQ at 0.18% and $440B in AUM is a utility. IGV at 0.39% and $12B is still in the comfort zone for a sector-software product — bid-ask spreads tight, holdings liquid, closure risk negligible. WCLD at 0.45% and $227M is in a different category.
$227M is not a closure threshold by itself, but it is small enough that the bid-ask cost on a market order is materially worse than QQQ's, and the fund's continued existence depends on the cloud-software thesis attracting net inflows. For a 30-year holder, the relevant friction is not the headline expense ratio but the implementation cost including spread, plus the non-zero probability that the fund delists or merges before the thesis plays out. WCLD's parent is well-capitalized, but small thematic funds get shuttered routinely when AUM stagnates.
Translated to dollars on a $50,000 position held 20 years at a 7% gross return: a 0.18% fee leaves about $189,400, a 0.39% fee leaves about $182,300, and a 0.45% fee leaves about $180,400. The gap between QQQ and WCLD is roughly $9,000 over two decades — meaningful but not decisive. The dispersion of gross returns will swamp that math. Which is why "cheap" is the wrong primary lens here; which exposure are you actually buying is the right one.
What the 5Y window can and can't tell us
WCLD has only ever existed in two regimes: zero-rate cloud euphoria (2019-2021) and the rate-driven repricing that followed. We have not seen this fund in a credit-led recession, a productivity boom, or a sustained capex cycle that benefits enterprise software disproportionately. The 5Y CAGR is real, but it is a single-regime number for a thematic product. Anyone using it as a forward expectation is doing factor extrapolation on n=1.
IGV is in better shape on this front — live since 2001, including the 2008 credit crisis, the 2018 fourth-quarter selloff, COVID, and the 2022 drawdown. Its 23-year track record across multiple regimes is the case for taking the 10Y CAGR (16.6%) as the more honest base rate than the 5Y (6.0%).
QQQ is the longest-lived of the three (1999) and has the most robust regime coverage including the dot-com bust itself. That is the strongest argument for treating it as a core sleeve and the other two as satellites.
One non-obvious effect to flag: equal-weighted thematic funds like WCLD do not just have higher volatility — they have a different volatility profile. By construction, when the cohort drifts in performance between rebalances, the fund sells its winners and buys its losers, a contrarian rebalance within the theme. In a sustained momentum regime that hurts. In a mean-reverting one it helps. That mechanical contrarian tilt does not show up in the headline expense ratio or in standard factor regressions against broad benchmarks, and it is a meaningful part of why WCLD's path-of-returns has been so different from QQQ's even within the same broad sector.
The factor overlap problem (for QQQ holders especially)
If you already own QQQ, adding IGV or WCLD doesn't diversify you — it concentrates you. Microsoft, the largest holding of IGV, is also the largest or second-largest holding of QQQ. Snowflake and Datadog (WCLD holdings) are in QQQ. The overlap is not 1:1, but the factor exposures (growth, software, US large-cap, long-duration equity) compound.
The mechanical implication: stacking QQQ + IGV in similar weights means roughly 40-50% of your effective exposure is large-cap US software, depending on the period. That is a portfolio choice, not a diversification benefit. Adding WCLD on top adds a higher-volatility version of a similar bet. Investors who think they are "diversifying within tech" by holding all three are mostly buying different weights of the same factor — with rising idiosyncratic risk as the weights drift.
Readers thinking about how smart-beta and factor tilts interact with a broad core will find the same lesson there. Factor stacking only diversifies if the factors are not the same factor in different packaging.
At-a-glance scoreboard
| Category | Winner | Margin |
|---|---|---|
| Cost | QQQ | Material — 21 bp vs IGV, 27 bp vs WCLD |
| Realized 5Y return | QQQ | Large — 11.6 pp/yr vs IGV, 27.0 pp/yr vs WCLD |
| Realized 5Y risk | QQQ | Strong — lowest vol and shallowest drawdown |
| Regime coverage (live history) | QQQ > IGV > WCLD | Decisive |
| Suitability for long-term core | QQQ | The other two are not core candidates |
| Purity of thesis (if you want one) | WCLD > IGV > QQQ | Inverse of suitability |
Scenarios where each fund fits
- QQQ as a core growth sleeve, alongside a broad-market fund — for a reader who already holds VTI or VOO and wants a deliberate large-cap growth overweight, with full understanding that this is a growth tilt and not "tech exposure" per se.
- IGV as a satellite for an investor who specifically wants software — perhaps a reader whose career is outside tech and who wants exposure to enterprise software economics without picking single names. Reasonable as a 5-10% tilt on top of a broad core. Hard to justify as more than that without an explicit view.
- WCLD as a small, deliberate thematic position — only for investors who can articulate why they want cloud-native, equal-weighted, often-unprofitable growth exposure specifically, and who are willing to underwrite a 60%+ drawdown without selling. The recovery from the 2021 peak is the test case. A 2-5% sleeve at most.
- Holding all three: not a strategy. It is unintentional factor concentration with rising fees.
Editor's read
If forced to pick one for a long-term core sleeve, the editor leans QQQ — not because it is "the best tech fund," but because it is the only one of the three that diversifies across enough underlying business models and revenue regimes to plausibly survive a thirty-year holding period without a thesis change. IGV is interesting as a 5-10% software tilt for an investor who already owns broad market exposure and wants concentrated incumbent-software economics. WCLD is interesting as a thought experiment in equal-weighted thematic construction, but the editor would not own it as anything other than a small, time-boxed conviction bet — and only after seeing it survive a regime that is not the one it has just lived through. For broader portfolio context, the Editor's Portfolio May 2026 snapshot shows how a single growth tilt fits inside a diversified long-horizon allocation.
The editor does not hold IGV or WCLD; the editor holds QQQ-equivalent broad large-cap growth exposure as part of a diversified long-horizon allocation.
Frequently asked questions
Are QQQ, IGV, and WCLD redundant if I own all three?
Largely yes. The factor overlap is heavy — US large-cap growth, software, long-duration equity. Holding all three weights you toward the same exposure with rising fees and less clarity about what you actually own. Pick one as the primary tech sleeve and skip the others, or accept that you are running a concentrated growth bet rather than a diversified one.
Why did WCLD lose money over five years if cloud computing is growing?
Revenue growth and equity returns are not the same thing. The underlying cloud-software businesses kept growing. The discount rate applied to their future cash flows roughly doubled between 2021 and 2023, which compressed the multiples investors were willing to pay. Equal-weighted exposure to the most rate-sensitive cohort produced the deepest repricing. The thesis was not invalidated; the price paid for the thesis was.
Is QQQ a tech ETF?
Not exactly. It is the Nasdaq-100, which is dominated by tech and tech-adjacent firms but also includes consumer staples, healthcare, and consumer discretionary names. It is more accurately described as a large-cap growth index that happens to be very tech-heavy. If you want a true tech sector fund, XLK or VGT is closer. IGV is narrower again — software only.
How does the current rate environment factor in?
The 10-year Treasury at 4.5% and CPI year-over-year around 3.9% (FRED, asof 2026-05-14 and 2026-04-01) mean discount rates remain materially higher than the 2019-2021 baseline that produced the cloud-software peak. That does not predict the next move, but it does mean readers should not anchor expectations on the multiples seen at the bottom of the rate cycle. WCLD especially is being priced against a different cost of capital than the one it launched into.
Should I wait for WCLD to recover to its old high before buying?
The price level a fund hit in a different regime is not a meaningful target. Either the current thesis (cloud-software economics, recurring revenue, operating leverage at scale) is attractive at today's valuations or it isn't — independent of where the price was in 2021. Anchoring on prior peaks is a behavioral trap, not a discipline.
Key takeaways
- QQQ, IGV, and WCLD are three different products — index, sector, theme — with sharply different risk profiles. Treating them as interchangeable tech exposure is the most common mistake here.
- Realized 5Y dispersion (-9.4% to +17.6% CAGR) is a feature of the construction differences, not a fluke. The narrower the thesis, the wider the realized outcomes.
- WCLD's max drawdown of -64.9% is a structural property of equal-weighted, high-duration, often-unprofitable thematic exposure — not a one-time event to be filtered out of the base rate.
- For a long-horizon core, QQQ is the only one of the three with the regime coverage to plausibly underwrite. IGV is a sleeve. WCLD is a satellite with a single-regime live record.
- Stacking all three concentrates a factor rather than diversifying it. Decide which exposure you want and own it deliberately.
What this comparison can and can't tell you
The 5Y window covers exactly one full rate cycle and an unfinished normalization. WCLD's entire live history is contained inside it. IGV and QQQ have longer records but their last five years are dominated by the same single regime. None of the numbers above tell you what the next regime will reward; they tell you what the last one did. The methodology behind the long-term editor's framework — drift-band rebalancing, weekly review, evidence-led tilts — is the same one applied in the 2026 hybrid portfolio framework; the point of that framework is to keep position sizing honest when the next regime arrives, whatever it turns out to be.
Methodology
Returns, NAV, volatility, and drawdown computed from yfinance price series with distributions reinvested, pulled 2026-05-16. Five-year window is 2021-05-16 through 2026-05-16. Expense ratios and AUM cross-referenced against Invesco, iShares, and WisdomTree fact sheets. Macro context from FRED (10-year Treasury asof 2026-05-14; fed funds rate asof 2026-04-01; VIX asof 2026-05-14; CPI year-over-year asof 2026-04-01). Single-window analysis: regime extrapolation should be treated with caution, especially for WCLD whose entire live history sits inside the 5Y window.
This article is for educational purposes and does not constitute personalized financial advice. See Disclaimer.