
Photo by Alina Matveycheva on Unsplash
The short version
- The three iShares single-factor ETFs all carry the same 0.15% fee, but their realized 5Y CAGRs differ by 6.0 percentage points — that gap is mostly about whose factor stayed in regime, not about manager skill.
- MTUM's holdings turn over the most (semi-annual reconstitution on trailing momentum), QUAL's the least (slow-changing fundamentals), and SIZE's "inverse cap" weighting drifts toward mid-cap rather than small-cap by construction.
- For a long-horizon core, the factor you can actually live with through a drawdown matters more than the one with the best trailing window.
Single-factor ETFs are usually presented as if they were stable boxes — a momentum box, a quality box, a size box — that an investor can slot into a portfolio. The price data over the last five years tells a different story. The three iShares MSCI USA factor ETFs (MTUM, QUAL, SIZE) share an issuer, an index family, and a fee, yet they delivered very different return and drawdown profiles. The interesting question is not which one won the five-year window; it is whether the factor each fund holds today resembles the factor it held in 2021.
Why these three funds are worth comparing
iShares launched the MSCI USA single-factor series in mid-2013, which means each fund now has a 12-13 year live track record across at least three distinguishable regimes: the post-COVID liquidity surge (2020-2021), the 2022 rate shock, and the AI-led concentration of 2023-2025. They use the same parent universe (large- and mid-cap US equities from the MSCI USA Index), the same issuer infrastructure, and the same 0.15% expense ratio. What differs is the screen — and how often that screen forces the portfolio to turn over.
This combination — same fees, same universe, very different turnover rules — makes the trio one of the cleanest natural experiments in single-factor investing available to a US retail investor. It is also the right place to push back on the casual claim that "factors work over the long run." They do, in academic backtests. Live, they drift.
The data, side by side
| Ticker | Factor | Expense ratio | AUM | Distribution yield | 5Y CAGR | 10Y CAGR | 5Y volatility (annualized) | 5Y max drawdown | Inception |
|---|---|---|---|---|---|---|---|---|---|
| MTUM | Momentum | 0.15% | $24.2B | 0.7% | 13.9% | 16.3% | 20.5% | −32.3% | 2013-04-16 |
| QUAL | Quality (high ROE, low leverage, stable earnings) | 0.15% | $50.1B | 0.9% | 11.9% | 14.1% | 17.4% | −28.2% | 2013-07-16 |
| SIZE | Size (smaller within large-/mid-cap universe) | 0.15% | $0.4B | 1.5% | 7.8% | 11.6% | 17.4% | −24.0% | 2013-04-16 |
Source: yfinance price/return data pulled 2026-05-16; iShares fact sheets for MTUM, QUAL, and SIZE for expense ratio, methodology, and AUM. CAGRs and volatility are computed from total return on daily closes; max drawdown uses peak-to-trough on the same series.
How each index is actually built (and how often it turns over)
The factor labels suggest stability. The construction rules don't.
MTUM tracks the MSCI USA Momentum Index, which scores each stock on its risk-adjusted price performance over the trailing 6 and 12 months (excluding the most recent month), then rebalances semi-annually. Twice a year, the names that were "momentum" twelve months ago can leave the index entirely and be replaced by whatever has been trending recently. In practice, MTUM has cycled from a defensive/healthcare tilt in 2019, to growth/tech in late 2020, to energy/value in 2022, and back toward mega-cap tech in 2023-2024. The ticker did not change. The factor exposure absolutely did.
QUAL screens for high return on equity, low debt-to-equity, and low earnings variability. Those balance-sheet attributes are slow-moving — a high-quality firm tends to stay high-quality across a few earnings cycles. QUAL rebalances semi-annually too, but the screen produces something close to a stable roster of cash-generative megacaps. The factor identity is the most persistent of the three.
SIZE tracks the MSCI USA Risk Weighted Index, which weights its constituents inversely to the square of their volatility — meaning lower-volatility names get a bigger weight than they would in a cap-weighted index. The fund is marketed as a "size" exposure, but mechanically it is closer to a low-volatility / equal-weight hybrid drawn from the large-/mid-cap universe. It does not own small caps. This is the single most misread fact about SIZE.
What the 5Y window actually rewarded
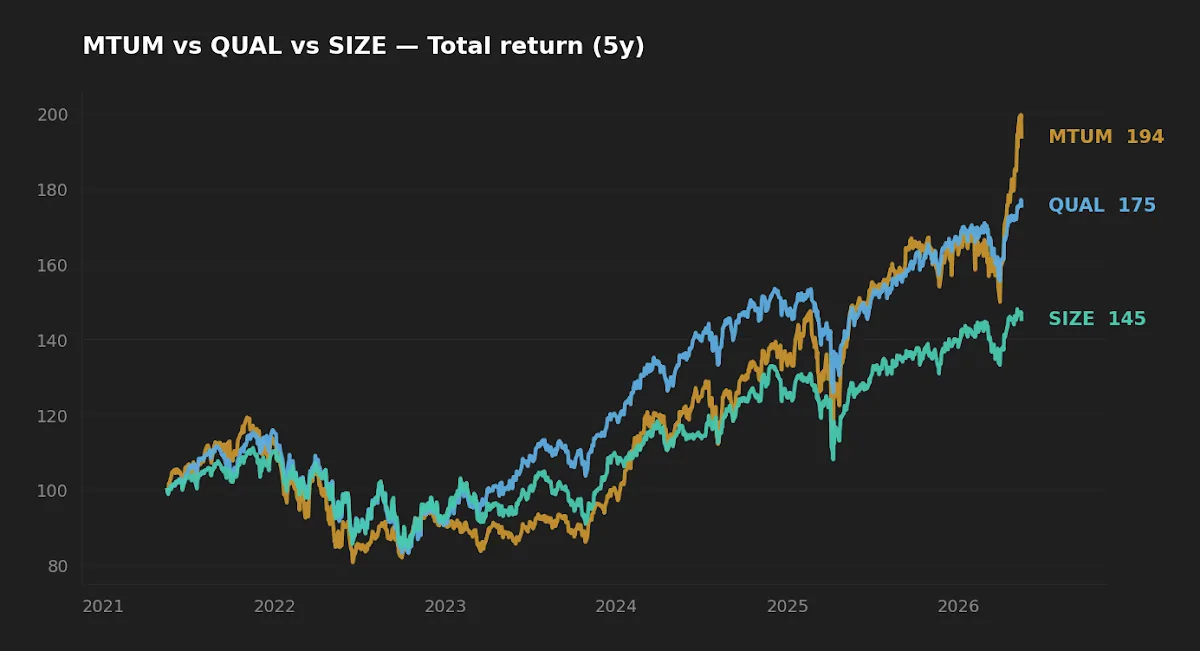
Over the past five years, MTUM compounded at 13.9% per year, QUAL at 11.9%, and SIZE at 7.8% (yfinance, 2026-05-16). The gap between the best and worst — 6.0 percentage points annualized — is large enough that on $50,000 invested five years ago the dollar outcomes differ by roughly $23,000. None of that gap is explained by fees, since all three charge 0.15%. It is explained by which factor was in regime.
The 2020-2025 window was dominated by mega-cap concentration: a small group of high-quality, cash-generative growth names drove most of the index return. That regime rewards both quality (because the winning firms had pristine balance sheets) and, in the back half of the window, momentum (because MTUM eventually rotated into them). It penalizes a fund whose weighting scheme down-weights the largest names — which is what SIZE does by design.
The ticker did not change. The factor exposure absolutely did. The MTUM an investor bought in 2021 is not the same fund, in factor terms, as the MTUM they own in 2026.
This is the single most useful frame for thinking about single-factor ETFs: trailing returns reward the factor that benefitted from the past regime, not the factor most likely to benefit from the next one. Reading the 5Y leaderboard as a buy signal mistakes a regime payoff for a structural one. The academic case for factor investing rests on rebalancing across full cycles, not on chasing the latest five-year winner.
Realized risk: drawdown duration matters more than peak depth
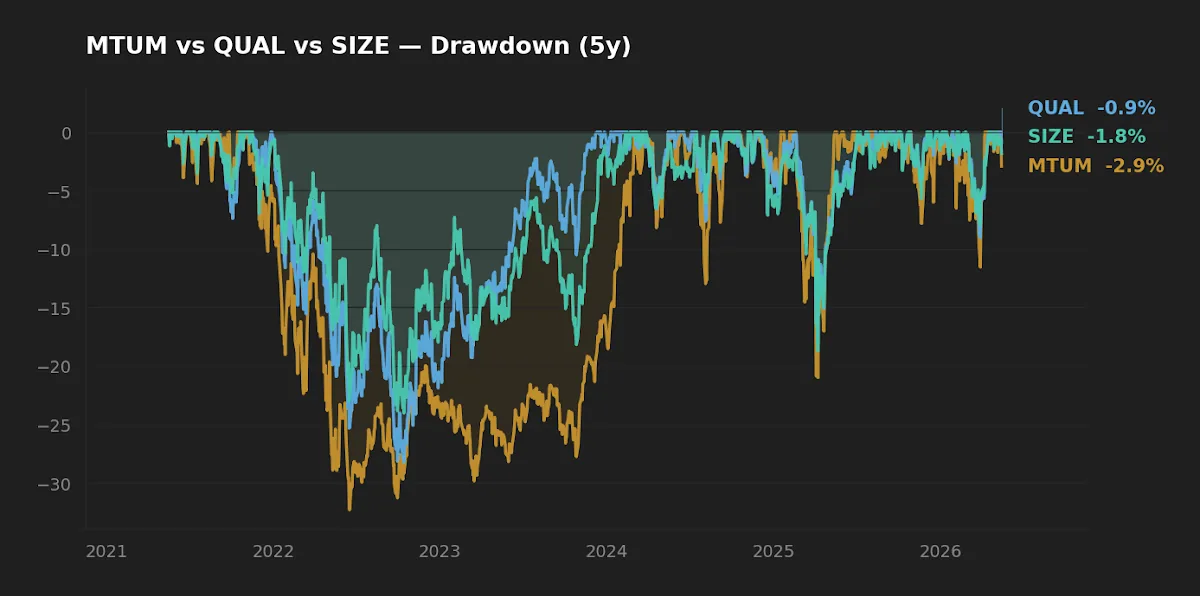
The 5Y drawdown numbers (yfinance, 2026-05-16) tell a coherent story. MTUM took the deepest hit at −32.3% — most of that pain came in the 2022 rate shock, when the fund's then-growth tilt was punished and the semi-annual reconstitution dragged it into energy/value after the rotation had already happened. QUAL drew down −28.2%, and SIZE −24.0%. The depth ranking matches what factor theory would predict: momentum carries the highest tail risk because it is, by construction, a regime-dependent strategy.
For a buy-and-hold investor, however, drawdown duration matters more than peak depth. A holder who panicked at MTUM's trough in late 2022 locked in a permanent loss. A holder who stayed put recovered within roughly 14 months. The fund design did not save them; their behavior did. That is the same lesson covered in what risk really means in long-term ETF investing — the realized risk of any strategy is the volatility the investor can actually sit through.
SIZE: when the label and the exposure disagree
SIZE is the least-discussed of the three, and the most often misunderstood. It holds $409M in assets — a fraction of QUAL's $50.1B — which by itself is not a problem for a fund tracking liquid large-/mid-cap US stocks. The concern is identity. An investor who buys "SIZE" expecting a small-cap tilt is buying something closer to a low-volatility-weighted version of the MSCI USA universe. Over the 5Y window, that delivered 7.8% CAGR with 17.4% volatility — useful as a defensive sleeve, but not the small-cap premium most investors are reaching for.
Two practical consequences follow. First, SIZE is not a substitute for a small-cap fund. Investors looking for genuine small-cap exposure are usually better served by a fund built on a small-cap parent universe rather than a "size factor" overlay on a large-/mid-cap one. Second, SIZE's modest AUM raises the standard small-fund considerations: wider bid-ask, lower trading volume, and the (low but non-zero) possibility of closure if assets stagnate. Neither is disqualifying; both are worth pricing in.
Macro context and what it means for factor allocation
As of mid-May 2026, the 10-year Treasury yields 4.47% (FRED, asof 2026-05-14), the Fed funds rate sits at 3.64% (FRED, asof 2026-04-01), the VIX is at 17.26 (FRED, asof 2026-05-14), and CPI is running at 3.9% year-over-year (FRED, asof 2026-04-01). That is a regime where high real yields keep duration risk priced into long-dated growth assets, but inflation is no longer the dominant shock it was in 2022.
This kind of mid-cycle regime is historically friendly to quality (cash flow holds up) and unfriendly to pure momentum (regime changes punish trailing-window strategies). It is not a forecast — it is the conditional context an investor should hold in mind when reading 5Y CAGR tables.
At-a-glance scoreboard
| Category | Best of the three | Margin |
|---|---|---|
| Cost | Three-way tie | All 0.15% |
| Realized 5Y return | MTUM | +2.0 pp/yr over QUAL; +6.0 pp/yr over SIZE |
| Realized 5Y drawdown | SIZE | ~8 pp shallower than MTUM |
| Factor identity stability | QUAL | Clear — slow-moving fundamentals |
| Suitability as a long-horizon core sleeve | QUAL | Most defensible across regimes |
FAQ
Q: If MTUM had the highest 5Y CAGR, isn't it the best long-term factor pick?
A: Not necessarily. MTUM's 13.9% 5Y CAGR (yfinance, 2026-05-16) reflects a specific regime where momentum eventually caught up with mega-cap tech leadership. Momentum is also the factor with the most behavior risk during regime changes — its −32.3% 5Y max drawdown is the deepest of the three. Trailing returns are the worst guide to factor selection, not the best.
Q: Why is QUAL so much bigger than MTUM and SIZE?
A: QUAL's $50.1B AUM versus MTUM's $24.2B and SIZE's $409M (yfinance, 2026-05-16) reflects institutional preference. Quality is the factor with the most stable identity and the cleanest defensive properties, which makes it easier to size in a long-term allocation. It is not necessarily the best forward-looking pick — it is the most acceptable one for a wide range of mandates.
Q: Does SIZE actually give me small-cap exposure?
A: No. SIZE tracks the MSCI USA Risk Weighted Index, which is drawn from the large- and mid-cap parent universe and weights by inverse volatility. Investors looking for the small-cap risk premium are usually better served by a fund built on a true small-cap parent universe.
Q: How does factor drift differ between the three?
A: MTUM rotates the most — by design, since the index reconstitutes semi-annually on trailing 6- and 12-month momentum. QUAL is the most stable because high-quality firms (high ROE, low leverage, stable earnings) change slowly. SIZE's drift is subtle: its sector and size profile shifts gradually with the volatility-weighted overlay. The MTUM holdings of 2021 and 2026 differ substantially; the QUAL holdings differ much less.
Q: Can I combine all three to "smooth" my factor exposure?
A: Mechanically, yes — a multi-factor sleeve is a common construction. The practical question is whether you would do better with a single multi-factor ETF that handles the weighting internally, since hand-constructed combinations rebalance only when you do, and concentration can creep in between rebalances. The academic literature (Fama and French, 1992, 1993; Asness, Frazzini, and Pedersen on quality) supports diversification across factors; it does not say "use three single-factor ETFs."
Key takeaways
- Same issuer, same parent universe, same 0.15% fee — and a 6.0 pp 5Y CAGR spread. The difference is which factor benefitted from the regime, not which fund is better engineered.
- MTUM rotates the most. The momentum factor an investor owns in 2026 is not the one they owned in 2021. That is a feature, but it makes trailing-return comparisons especially misleading.
- QUAL's slow-moving factor identity is the reason it has $50.1B in assets. Stability of exposure is itself a portfolio property.
- SIZE is not a small-cap fund. It is an inverse-volatility-weighted slice of the large-/mid-cap universe. Useful in some contexts; not a substitute for genuine small-cap exposure.
- The realized risk of any factor strategy is the volatility the investor can actually sit through. MTUM's −32.3% drawdown is the empirical reminder.
What this comparison can and can't tell you
The 5Y window covered here is dominated by one structural feature: mega-cap concentration. It includes one acute bear (2022) and several regime shifts, but it is not a substitute for a full credit-driven downturn of the 2008 type. The 10Y CAGRs (MTUM 16.3%, QUAL 14.1%, SIZE 11.6%) widen the lens and tell a similar story, but they too sit largely inside an era of falling and then low rates. Treat any "winner" verdict as conditional on the regime that produced it.
Scenarios where each could fit
- Long-horizon core seeker, 401(k) only: QUAL is the most defensible single-factor tilt for a core sleeve because its factor identity does not drift with the cycle.
- Investor with broad index exposure already, looking for a satellite: A small MTUM sleeve sized for the drawdown the investor would actually tolerate (treat the −32% number as the floor, not the worst case) is a reasonable expression of a momentum view.
- Investor seeking small-cap exposure: Look elsewhere. SIZE will not deliver it.
- Investor uncertain which factor to pick: A diversified multi-factor fund or simply broad-market exposure is usually a better default than picking one trailing winner.
Editor's read
If forced to pick one of these three for a long-horizon core sleeve, the editor leans QUAL — not because its 5Y CAGR is the best (it isn't), but because the factor it captures is the one whose live exposure most resembles the academic backtest. MTUM's appeal is real, but it is a sleeve, not a core, and it has to be sized to a drawdown an investor will actually live through. SIZE is the hardest to justify here: the name promises something the construction does not deliver.
Methodology note: price and return data via yfinance, pulled 2026-05-16. Expense ratio, AUM, distribution yield, inception date, and index methodology cross-referenced against the iShares fact sheets for MTUM, QUAL, and SIZE. Macro context from FRED series DGS10, FEDFUNDS, VIXCLS, and CPIAUCSL, asof dates noted inline. CAGRs computed on daily total return; max drawdown on peak-to-trough of the same series. The editor maintains an in-house weekly portfolio review framework grounded in Daryanani (2008) and Vanguard (2024) rebalancing-band research, which informs how single-factor sleeves are sized in this analysis.
This article is for educational purposes and does not constitute personalized financial advice. See full Disclaimer.