
Photo by Maria Kovalets on Unsplash
The short version
- Three funds, three different definitions of "quality dividend": SCHD screens on financial strength plus yield, NOBL filters by 25+ years of consecutive dividend increases, and DIVZ runs a concentrated active book of ~25–35 names.
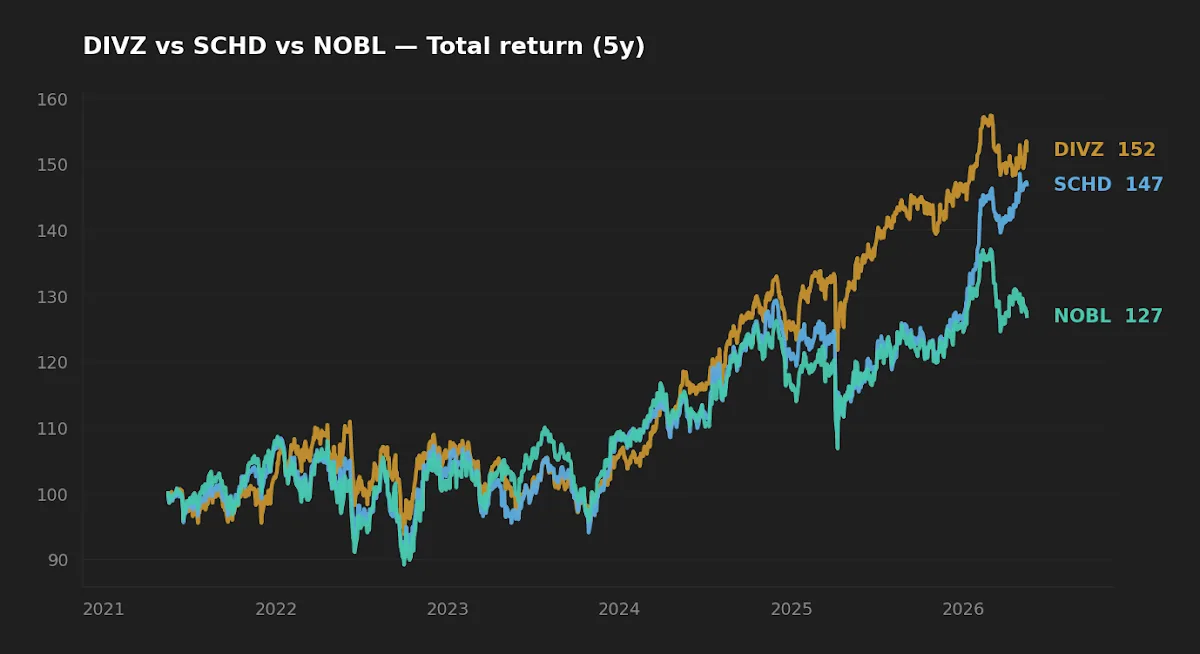
- Over the trailing five years, DIVZ leads on CAGR (9.1%) and NOBL trails badly (4.9%) — but the 10-year picture, where available, narrows the gap considerably and points to regime, not strategy, as the main driver.
- SCHD remains the default long-horizon core option on fee, scale, and methodology durability. NOBL is a defensive-sector tilt with a long pedigree. DIVZ is a satellite for investors who want active concentration with explicit valuation discipline.
"Quality dividend" is one of the more abused phrases in ETF marketing. Every fund in the category claims it, and yet the three funds in front of us — DIVZ, SCHD, and NOBL — would each fail at least one of the others' definitions. The interesting question is not which one is best, but what each is actually screening for, and whether the trailing-five-year numbers reflect strategy quality or simply the regime the strategy met.
This piece compares the three head-to-head on fees, methodology, realized return, realized risk, and the kind of investor each plausibly fits. The data is from yfinance as of 16 May 2026, cross-checked against issuer fact sheets.
What each fund is actually doing
SCHD tracks the Dow Jones U.S. Dividend 100 Index. The screen requires at least ten consecutive years of dividend payments, then ranks the surviving universe on a composite of cash-flow-to-total-debt, return on equity, dividend yield, and five-year dividend growth rate. The top 100 names by composite score make the index, weighted by modified market cap with a 4% per-name and 25% per-sector cap (Schwab fact sheet). It is rules-based, broad, and unforgiving on financial-strength criteria.
NOBL tracks the S&P 500 Dividend Aristocrats Index. The single hard rule: 25+ consecutive years of dividend increases, holding from the S&P 500 universe. The index is equal-weighted across ~65 names, rebalanced quarterly (ProShares fact sheet). The methodology is severe and prestige-driven: it filters out anything that did not survive — and keep raising — through 2001, 2008, and 2020.
DIVZ, the Polen Dividend Income ETF, is actively managed. Polen Capital runs ~25–35 names selected on a quality framework (durable competitive advantage, low debt, high return on invested capital) plus a dividend income overlay, with explicit valuation discipline (Polen Capital fact sheet). It is the most concentrated of the three and the only one not bound to a published index methodology.
The numbers, side by side
| Metric | DIVZ | SCHD | NOBL |
|---|---|---|---|
| Issuer / structure | Polen, active | Schwab, indexed | ProShares, indexed |
| Inception | Jan 2021 | Oct 2011 | Oct 2013 |
| Expense ratio | 0.65% | 0.06% | 0.35% |
| AUM | $0.24B | $91.1B | $11.3B |
| 30-day dividend yield | 2.6% | 3.3% | 2.1% |
| 5Y CAGR (total return) | 9.1% | 8.2% | 4.9% |
| 10Y CAGR (total return) | n/a (5.3 yrs live) | 12.7% | 9.4% |
| 5Y annualized volatility | 12.6% | 14.4% | 14.4% |
| 5Y max drawdown | −15.4% | −16.8% | −17.9% |
| Holdings count (approx.) | ~30 | 100 | ~65 |
Source: yfinance, pulled 16 May 2026; issuer fact sheets linked above. CAGR figures are total-return, not price-only. NOBL and SCHD 10Y windows include the 2015–2020 period; DIVZ does not, having launched in January 2021.
For macro context, the 10-year Treasury sits at 4.5% and the Fed funds rate at 3.6% (FRED, asof 14 May 2026 and 1 Apr 2026 respectively). None of these dividend funds clear the risk-free rate on yield alone — they are equity exposures with an income tilt, not bond substitutes.
Why NOBL trails — and why the 10-year window matters
The five-year gap between NOBL (4.9% CAGR) and SCHD (8.2%) is wide enough to demand explanation. The temptation is to read it as evidence that the Aristocrats screen is broken. The 10-year window tells a different story: NOBL has compounded at 9.4% over a decade versus SCHD's 12.7% — still behind, but by a much smaller margin, and well above its 5-year drag.
What changed across windows? Sector composition. The 25-year dividend-increase screen structurally tilts NOBL toward consumer staples, industrials, and dividend-mature healthcare — sectors that build dividend tenure precisely because they generate boring, repeatable cash flows. From 2020 through early 2024, those sectors materially lagged the broader market as multiple expansion concentrated in technology and growth. SCHD's financial-strength composite, by contrast, accommodates a wider sector spread (its top weights have rotated through energy, financials, and consumer discretionary depending on the screen window). The five-year underperformance is largely a sector-driven artifact of the regime NOBL met, not evidence that 25-year dividend tenure has stopped mattering.
This matters for forward-looking use. If you believe the 2020–2024 growth concentration was unusually wide and likely to mean-revert, NOBL's trailing-five-year drag will look less informative than its 10-year record. If you believe the regime will persist, the trailing five years are the better guide. The data alone cannot adjudicate this.
NOBL's 5-year underperformance isn't a verdict on Aristocrats as a strategy — it's a verdict on the sectors that historically populate the screen meeting a regime that didn't reward them.
Realized risk: where DIVZ surprises
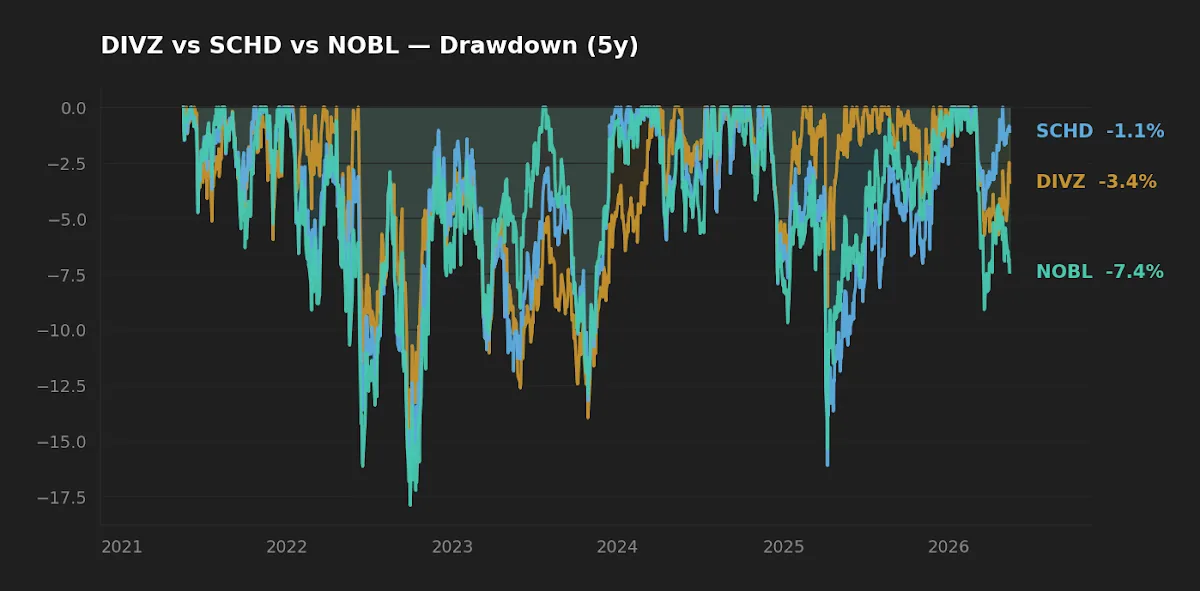
The intuitive ranking on risk would put the concentrated active fund (DIVZ, ~30 names) at the top of the volatility table, then the equal-weighted defensive basket (NOBL), then the broad indexed quality fund (SCHD). The data inverts the first part of that intuition. DIVZ has the lowest realized 5-year annualized volatility of the three (12.6% vs 14.4% for both SCHD and NOBL) and the shallowest 5-year max drawdown (−15.4% vs −16.8% and −17.9%).
Two things are happening. First, concentration in a small set of high-quality, low-debt, mature-cash-flow names can reduce realized volatility relative to a broader basket — provided the concentration is on the right names. Second, an active manager can sidestep positions before drawdowns in a way an index methodology cannot. The flip side: with only 30 names, a single position blowup or strategy drift hurts much more than in a 100-name index, and the live track record is only 5.3 years — not long enough to tell whether the realized vol advantage is structural or sample-window luck.
SCHD's drawdown profile is the most studied of the three. The fund has now lived through 2020, the 2022 rate-shock drawdown, and the 2023 regional banking episode while retaining its top-1% rank by AUM in the dividend ETF category. NOBL's slightly deeper drawdown reflects its equal-weighting plus the sector concentration noted above; equal-weighting amplifies whatever the average constituent does, in both directions.
Cost arithmetic over a long horizon
The fee gap is the part of the analysis where the data is unambiguous. SCHD at 0.06%, NOBL at 0.35%, DIVZ at 0.65%. The headline gap is 59 basis points between SCHD and DIVZ, 29 between SCHD and NOBL.
On a $50,000 allocation held for 20 years at a hypothetical 7% gross return, the fee drag compounds to roughly $2,300 (SCHD), $12,800 (NOBL), and $23,000 (DIVZ) in foregone terminal value. That is not the same as saying SCHD will outperform DIVZ — it is saying that DIVZ has to add 59 basis points of annualized alpha, net, just to break even on cost. Over the past five years it has cleared that bar by ~90 bp/yr. Whether a concentrated active book can clear it over the next twenty is the question every active-versus-indexed comparison eventually comes down to.
For longer-form treatments of how compounded fee drag interacts with rebalancing discipline at the portfolio level, see the SCHD vs. VIG quantitative analysis and the related SCHD vs. DIVZ deep dive, which both cover the SCHD methodology in more depth than fits here.
What this comparison can and cannot tell you
The 5-year window contains exactly one bear-market regime (2022) and one delivery of zero-interest-rate normalization. It does not contain a 2008-style credit-driven downturn. NOBL has live track record through 2008 only via its underlying index; the ETF itself launched in 2013. DIVZ has only its 2022 episode as a real stress test. Treating any of the trailing numbers as the verdict overweights one regime.
The 10-year CAGR comparison between SCHD and NOBL is more informative than the 5-year — but it still excludes the meaningfully different rate regimes of the 1980s and 1990s, when dividend tenure carried different signaling value. Quality dividend, as a factor, was not consistently rewarded across all 20th-century decades.
What the data does support: SCHD's screen and scale have been durable through more than one regime. NOBL's screen is doing what it is supposed to do (filter for resilience), even when the sectors it produces are out of favor. DIVZ's first five years have been creditable but are a single-regime data point.
Scenarios where each fund fits
- Investor in their 30s, tax-deferred account, no current dividend exposure → SCHD as a 5–15% sleeve is reasonable. Adding NOBL on top is redundant; the two have meaningful overlap in financials and consumer staples.
- Investor in their 50s, taxable account, wants higher yield with defensive sector tilt → SCHD remains the cost-efficient core; NOBL adds explicit defensive-sector tilt at a higher fee. Holding both is defensible if the investor specifically wants the Aristocrats screen's resilience characteristic.
- Investor who already owns broad market exposure and wants a concentrated active income sleeve with valuation discipline → DIVZ at 3–8% is the most plausible use case. Larger allocations are hard to justify on fee and capacity grounds (AUM is still under $250M).
- Retiree drawing portfolio income → SCHD's higher yield (3.3%) wins on the income leg; the qualified-dividend treatment matters in a taxable account. NOBL's lower yield (2.1%) is paid for by sector defensiveness, not income.
At-a-glance scoreboard
| Category | Winner | Margin |
|---|---|---|
| Cost | SCHD | Wide — 29 to 59 bp vs peers |
| Yield | SCHD | Modest — 30 to 120 bp |
| Realized return (5Y) | DIVZ | Marginal — 90 bp/yr vs SCHD |
| Realized return (10Y) | SCHD | Wide — 330 bp/yr vs NOBL |
| Realized risk (5Y) | DIVZ | Modest — 180 bp vol, 150 bp drawdown |
| Scale & liquidity | SCHD | Decisive — ~380× DIVZ AUM |
| Track record across regimes | SCHD / NOBL (tie) | 10+ years live |
| Suitability for long-term core | SCHD | Strong on cost and methodology durability |
FAQ
1. Why does NOBL look so much worse over five years than ten?
The 25-year dividend-increase screen tilts the portfolio toward consumer staples, industrials, and mature healthcare. Those sectors materially lagged the broader market from 2020 through early 2024, when returns concentrated in technology. The 10-year window dilutes that regime effect; the 5-year window is dominated by it.
2. Can I hold SCHD and NOBL together?
You can, but expect meaningful overlap — both screens select for financial strength and dividend durability, and several names appear in both. The marginal value of NOBL on top of SCHD is the Aristocrats screen's specific tenure requirement and equal-weighting. If you want the defensive sector tilt, that overlap is the point; if you just want dividend exposure, the redundancy is a fee tax.
3. Is DIVZ's lower realized volatility reliable going forward?
Five years is not enough data to call a 180-basis-point volatility advantage structural rather than sample-window. Concentration cuts both ways. The hypothesis (quality concentration reduces dispersion) is reasonable; the proof requires another full cycle.
4. How does dividend tax treatment differ across these?
All three pay primarily qualified dividends, taxed at long-term capital gains rates for U.S. investors holding more than 60 days around the ex-dividend date. The qualified-dividend share varies year to year; check the most recent 1099-DIV breakdown from your broker. None of the three is a meaningful source of return of capital.
5. Does the 10-year Treasury at 4.5% change the case for dividend ETFs?
At the margin, yes. A 4.5% risk-free yield raises the bar a dividend fund's total return has to clear to be worth its equity risk. SCHD's 8.2% trailing 5Y CAGR still clears that bar comfortably; NOBL's 4.9% does not, over that specific window. The longer-term comparison reasserts itself when the 10-year CAGR is used, but the framing matters: dividend equity competes with bonds at every rate level, and the gap has narrowed.
Editor's read
If the question is what belongs in a long-horizon core sleeve, the editor leans toward SCHD on the strength of three converging factors: cost (the 59-bp gap to DIVZ compounds without forgiveness), methodology durability (a rules-based screen that has been examined and stress-tested through two regimes), and scale (capacity is not an issue at $91B AUM). NOBL is a defensible defensive-sector tilt at a fair fee, useful in a portfolio that wants explicit resilience exposure but accepts the trailing 5-year drag as a sector artifact. DIVZ is the most interesting of the three to watch over the next decade — a concentrated active book with explicit valuation discipline and, so far, lower realized vol than either index — but as a satellite, not a core. The decision pivots on whether the reader believes "quality dividend" is best implemented as a wide indexed screen, a narrow tenure filter, or an active 30-name book.
The editor does not hold any of DIVZ, SCHD, or NOBL at the time of writing.
Key takeaways
- Three different definitions of "quality dividend" produce three quite different portfolios — SCHD is a wide screen on financial strength, NOBL a narrow filter on dividend tenure, DIVZ a concentrated active book.
- The 5-year CAGR gap between SCHD and NOBL is largely a sector-regime artifact, not a methodology indictment; the 10-year gap is narrower.
- SCHD's combination of 0.06% fee and 14 years of indexed track record sets a high bar for any active dividend alternative.
- DIVZ has delivered lower realized volatility than either index over five years — credible but not yet enough data to call it structural.
- Cost matters most over decades. A 59-basis-point fee gap compounds into roughly $23,000 of foregone terminal value on a $50,000 / 20-year / 7% scenario.
Methodology: price and return data from yfinance, pulled 16 May 2026. Expense ratio, AUM, dividend yield, and inception data cross-checked against issuer fact sheets (Schwab for SCHD, ProShares for NOBL, Polen Capital for DIVZ). Macro reference rates from FRED, latest available as of 16 May 2026. The 5-year window analyzed is May 2021 – May 2026; the 10-year window where shown is May 2016 – May 2026. CAGR figures are total-return (price plus reinvested distributions), annualized.
This article is for educational purposes and does not constitute personalized financial advice. See full Disclaimer.