
Photo by Sarah Dorweiler on Unsplash
The short version
- Across the 5-year window ending Q2 2026, the framework's diversifiers (gold) and growth tilt (QQQM) carried the return, while the bond sleeve (BND) flatlined under the rate regime that began in 2022.
- QQQM's 17.6% 5Y CAGR came with a 35.0% drawdown — the realized return is real, but so is the path. Treat the growth sleeve as a tilt, not the core.
- With the 10Y Treasury at 4.47% and CPI still at 3.9% YoY, the framework's two key questions for Q3 are whether to extend bond duration and whether to trim the gold sleeve after a 19.4% annualized run.
Over the past five years, an investor holding a balanced hybrid ETF framework — broad US and international equity, factor tilts, bonds, and gold — has seen an unusually wide dispersion between sleeves. Gold compounded at 19.4% per year; the US growth tilt at 17.6%; the bond sleeve at roughly zero. The quarterly review is not about predicting what comes next. It is about checking whether each sleeve still earns its place under the rules it was added under, and whether drift has crossed the bands that trigger a rebalance.
This Q2 2026 review applies that lens to a representative seven-ETF framework: VOO and VXUS as the global equity core; QQQM, AVUV, and SCHD as deliberate factor tilts; BND and GLD as diversifiers. All return figures are computed from yfinance daily total-return series through 2026-05-16 unless otherwise noted; macro figures are from FRED, asof dates listed in each citation.
Why this framework exists
The framework is built on three premises that the editor treats as settled, not as topics for re-litigation each quarter:
- Broad equity exposure is the engine. Over 30-year horizons, the cost of being underweight equity has historically been larger than the cost of equity drawdowns. The core is therefore equity-heavy.
- Diversification across sleeves with different drivers is non-negotiable. Not for return enhancement — for behavior in stress. A sleeve earns its place if it behaves differently from the others when the market is unkind, not if it has the highest CAGR in the last cycle.
- Rebalancing is the only systematic edge a retail investor has cheap access to. The framework uses opportunistic drift bands in the spirit of Daryanani (2008) and the Vanguard (2024) rebalancing literature — wider than calendar quarterly, tighter than full neglect.
What the framework deliberately does not try to do: time the cycle, predict the next regime, capture every theme, or maximize trailing return. The earlier piece VOO vs. QQQM vs. SCHD: The Physics of Compounding and the 2026 Core Portfolio Architecture covered the core-sleeve construction logic; Why VOO Is Not Enough covered the factor-tilt rationale. The Q2 review assumes those decisions stand and asks instead whether the current realization fits the design.
Constituent data — Q2 2026 snapshot
The table below summarizes each holding as of 2026-05-16. Expense ratios and AUM are from issuer fact sheets; total return, volatility, and drawdown figures are computed from yfinance adjusted-close series over the trailing five years.
| Ticker | Role | ER | AUM | Yield | 5Y CAGR | 5Y Vol | Max DD (5Y) |
|---|---|---|---|---|---|---|---|
| VOO | US core | 0.03% | $1,600.2B | 1.1% | 13.9% | 16.8% | -24.5% |
| VXUS | Intl core | 0.05% | $629.1B | 2.8% | 8.5% | 16.0% | -29.4% |
| QQQM | US growth tilt | 0.15% | $82.9B | 0.5% | 17.6% | 22.3% | -35.0% |
| AVUV | Small-cap value tilt | 0.25% | $26.2B | 1.3% | 10.8% | 22.8% | -28.8% |
| SCHD | Quality / income tilt | 0.06% | $91.1B | 3.3% | 8.2% | 14.4% | -16.8% |
| BND | Bond diversifier | 0.03% | $389.7B | 3.9% | 0.1% | 6.0% | -17.9% |
| GLD | Real-asset diversifier | 0.40% | $153.5B | 0.0% | 19.4% | 17.9% | -21.0% |
Data sources: issuer fact sheets (ER, AUM, yield, inception); yfinance daily adjusted-close through 2026-05-16 (CAGR, vol, drawdown).
Q2 2026 macro backdrop
Three FRED data points frame the review. The 10Y Treasury yield sits at 4.47% (FRED, asof 2026-05-14). The Fed Funds rate is 3.64% (FRED, asof 2026-04-01) — well off the 2024 peak but still positive in real terms. CPI YoY is 3.95% (FRED, asof 2026-04-01), meaning the real 10Y yield is roughly 0.5% — modestly positive, but well below where bond bulls were assumed to be compensated through the 2010s. VIX is at 17.26 (FRED, asof 2026-05-14), squarely in the middle of its historical range; nothing in the implied-volatility regime suggests panic or complacency.
The point of pulling these numbers up front is not to time anything. It is to make clear that BND's flat 5-year return is not a quirk — it is what a roughly 6-year duration bond fund does when the curve repriced by several hundred basis points over the window. The bond sleeve has not failed at its job; it has been doing its job in an unusually punishing regime for its job.
Sleeve-by-sleeve review: who pulled their weight
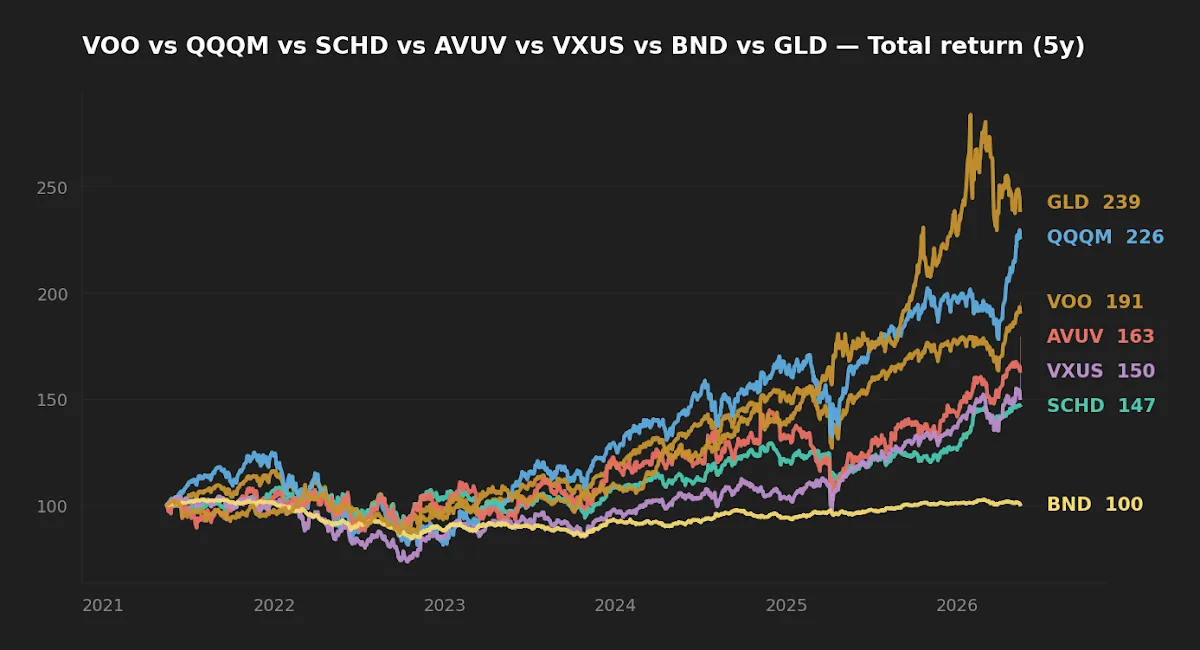
The 5-year total-return chart above tells the headline story, but the more useful question is whether each sleeve behaved consistent with the role it was assigned.
US core (VOO). Compounded at 13.9% annualized with a 24.5% maximum drawdown — close to its long-run profile and exactly what the core is supposed to deliver: broad participation in US public equity at a 0.03% cost floor that compounds almost imperceptibly in the right direction. No action.
International core (VXUS). 8.5% CAGR with a 29.4% drawdown — the relative underperformance versus VOO is now a six-year story, and tempting to act on. The discipline question: was VXUS added because it was expected to outperform US equity, or because its drivers (FX, ex-US monetary policy, ex-US earnings cycle) are genuinely different? If the latter — and it is — then trailing return is not the reason to cut it. The argument for global diversification rests on regimes the last 5 years did not contain.
Growth tilt (QQQM). 17.6% CAGR with a 35.0% drawdown. This is the sleeve that did most of the absolute work, and also the sleeve that asked the most of the holder's stomach. The 0.15% expense ratio is reasonable for index-replication exposure to the Nasdaq-100; the realized vol of 22.3% is the bigger cost. Worth flagging: this 5Y window contains exactly one severe Nasdaq drawdown. Anyone treating QQQM's trailing CAGR as a base-case forward expectation is making a single-regime extrapolation.
Small-cap value tilt (AVUV). 10.8% CAGR with a 28.8% drawdown — modestly disappointing on the surface, but the live-vs-academic gap is what we should expect for a factor that was rich at inception in 2019 and has compressed since. The 0.25% expense ratio is steep relative to broad index, fair relative to the factor exposure being delivered. No action; reassess factor loadings (size and value betas) at year-end.
Quality / income tilt (SCHD). 8.2% CAGR, 16.8% drawdown, 3.3% yield. The lowest realized return of the equity sleeves and also the lowest realized vol — exactly the trade-off the dividend-quality screen is meant to make. The yield-to-10Y gap is now negative (3.3% SCHD vs. 4.47% Treasury), which would have been unimaginable through most of the last decade and is a useful reminder that "dividend yield" is a relative number.
Bond diversifier (BND). 0.1% CAGR over five years. As noted above, this is the regime, not the fund. The forward setup is materially better than the trailing data implies: a 4.47% yield-to-maturity on the underlying is a meaningfully different forward expectation than the 1.5%-area yields the fund carried through 2020-2021.
Real-asset diversifier (GLD). 19.4% CAGR with a 21.0% drawdown — the surprise outperformer of the window. Gold's job in the framework is to behave differently from both equities and bonds in real-rate stress; it did exactly that. The 0.40% expense ratio is the highest in the framework, and worth periodic reconsideration against cheaper alternatives.
Each sleeve is graded against the role it was assigned, not against the sleeve that happened to lead the trailing five years. That is the only way a rebalancing rule stays disciplined when one sleeve has run.
The realized risk picture
The drawdown chart below makes the point that summary CAGR figures bury: at almost every interesting moment in the last five years, the sleeves drew down in noticeably different shapes.
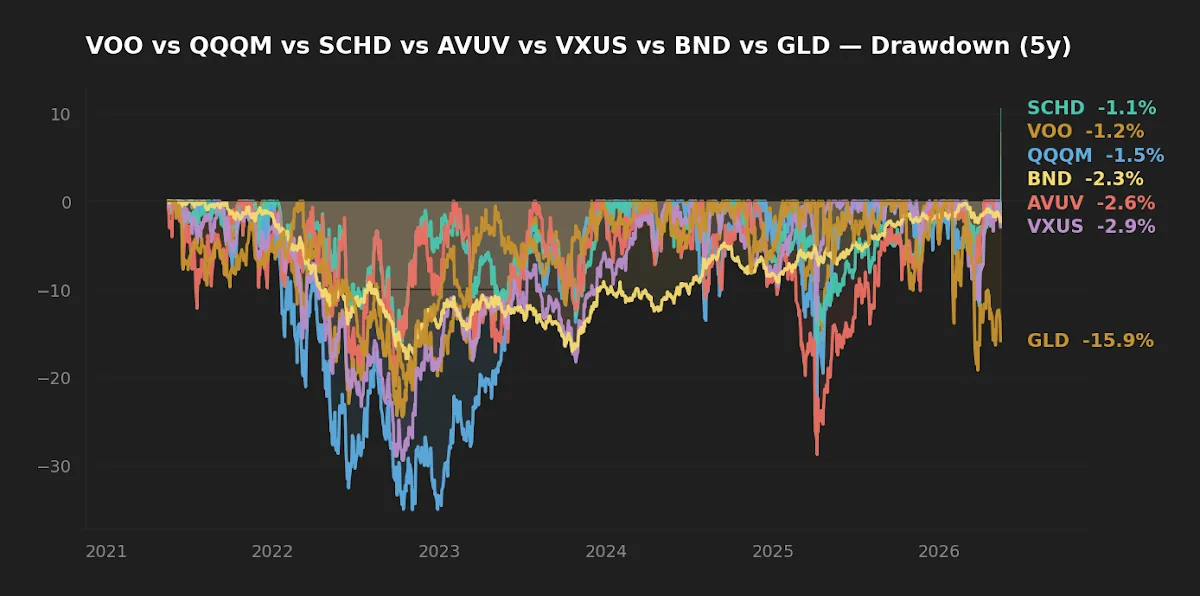
Three observations that matter for forward sizing. First, BND's 17.9% maximum drawdown — historically unusual for a total-bond fund — is the duration repricing of 2022. It is not a stress test of the fund's role in a portfolio; it is a stress test of the assumption that bond and equity correlations are reliably negative. Treat that assumption as conditional. Second, gold drew down 21.0% from a peak inside the same window in which it compounded at 19.4% — the strong total return came with a real path. Third, the equity sleeves' max drawdowns spread from 16.8% (SCHD) to 35.0% (QQQM), and that spread is the single most useful number for sizing the growth tilt: if a 35% drawdown on the tilt sleeve is going to force a behavioral mistake, the tilt sleeve is too large.
Rebalancing discipline against drift
The framework's rebalancing rules are not novel — they follow the broad logic in Daryanani (2008) and the Vanguard (2024) tolerance-band research: rebalance when a sleeve drifts beyond a defined relative band (the editor uses ±15% relative for individual positions, ±25% for sleeve aggregates) rather than on the calendar. The argument is well covered in the academic literature: calendar rebalancing reliably trades, but at the cost of unnecessary turnover; tolerance-band rebalancing trades less but captures the rebalancing premium more efficiently.
The practical Q2 2026 question is whether QQQM's run has pushed it past its band. With a 17.6% sleeve CAGR against a 13.9% portfolio-blended return, the answer is "yes, in a typical sizing." A 10% target weight that has drifted to 13%+ trips the upper band. The corresponding question for GLD is more subtle: the gold sleeve has also stretched, but its role in the framework is to compensate when the equity sleeves draw down — trimming it after a strong run is exactly the rebalancing discipline; trimming it because it feels rich is timing dressed up as discipline.
For investors maintaining their own version of this framework, the readers may find the methodology walk-through in May 2026 Snapshot: Where the Portfolio Stands as the Editor's Portfolio Log Begins useful as a worked example.
What this review explicitly cannot tell you
Five years is a sample, not a generation. The window contains one severe equity drawdown (2022), one historically unusual bond drawdown, a regime-change in real rates, and a gold cycle driven partly by reserve diversification. It does not contain a deflationary credit event, an extended secular bond bull, or a sustained reversal of US-versus-international leadership. Any conclusion that any sleeve has "won" or "failed" on this data is overweighting the regime. The point of the framework is to remain durable across regimes it has not yet seen.
FAQ
Q: Why hold BND at all if it returned essentially zero over five years?
BND is held for its forward behavior in equity drawdowns and for its current 4.47%-area yield-to-maturity, not for its trailing return. Selling a diversifier because the last cycle was unkind to it is the inverse of the discipline the framework is built on.
Q: Should the international sleeve (VXUS) be cut after six years of US outperformance?
If it was added on a return forecast, then yes. If it was added on a diversification argument (different FX, different policy cycle, different earnings drivers), then trailing return is not the right test. The framework treats it as the latter.
Q: Is 0.40% too high for GLD given alternatives?
It is the highest expense ratio in the framework and worth periodic reconsideration against IAUM and GLDM, both of which deliver similar exposure at lower cost. The decision is not urgent but is on the year-end review list.
Q: Why no thematic exposure (AI, energy transition, biotech)?
Thematic exposure is largely already inside VOO and QQQM at market weights. Adding a thematic sleeve on top is a bet that the theme will outperform the rest of the index — a separate bet that the framework does not currently take.
Q: Does the framework hedge currency for international exposure?
No. The framework treats FX as part of the diversification argument for VXUS rather than a risk to be hedged away. Currency hedging adds cost and removes one of the genuine differentiators between US and international equity returns.
Key takeaways
- The 5Y dispersion across sleeves (BND 0.1% to GLD 19.4%) is large enough that drift bands, not the calendar, should drive rebalancing decisions in Q3.
- QQQM's 17.6% CAGR was paid for with a 35.0% drawdown — size the growth tilt to the drawdown an investor will actually tolerate, not to the trailing return.
- BND's flat 5Y return is the rate regime, not a failure of role; the forward yield-to-maturity is materially better than the trailing data implies.
- Gold has done its job; trimming it back to band is rebalancing discipline, not market timing.
- The framework is durable to the extent it survives regimes it has not yet seen. Five-year data is a calibration check, not a verdict.
This article is for educational purposes and does not constitute personalized financial advice. See the Disclaimer.