Photo by Austin Hervias on Unsplash
The short version
- VOO and VTI carry the identical 0.03% expense ratio, so this decision is not about cost — it is about factor exposure.
- The only real difference is VTI's roughly 15% sleeve of small- and mid-cap stocks; over the trailing five and ten years that sleeve added volatility without adding return.
- Bottom line: VOO is a concentrated large-cap bet that recently won; VTI is the more diversified default whose edge depends on a small-cap regime that has not shown up lately.
Most fund comparisons on this blog turn on cost, because over decades basis points compound into real money. This one does not. VOO and VTI both charge 0.03%, both come from Vanguard, and both track the US equity market with near-zero tracking error to their respective benchmarks. The central question is narrower and more interesting: does owning the entire US market through VTI beat owning just its large-cap core through VOO — and what has that choice actually cost, or paid, over the recent record?
Context: what each fund actually holds
VOO tracks the S&P 500 — roughly the 500 largest US companies, weighted by market capitalization. VTI tracks the CRSP US Total Market Index, which holds those same large caps plus several thousand mid-, small-, and micro-cap names. Because both are cap-weighted, the mega-cap top of the market dominates each fund. In practice the two portfolios overlap by something close to 85% of weight. The difference between them is not "large caps versus everything" — it is a marginal tilt of roughly 15% toward smaller companies that VOO simply does not hold.
That framing matters. When you choose VTI over VOO, you are not diversifying away from concentration in any meaningful sense; the largest handful of mega-caps still drives most of your return in both funds. You are making a small, deliberate factor bet on the size premium — the long-documented tendency, going back to Fama and French, for smaller companies to earn higher long-run returns as compensation for higher risk. Whether that bet pays is a question the data can speak to, with caveats.
The numbers, side by side
| Metric | VOO | VTI |
|---|---|---|
| Name | Vanguard S&P 500 ETF | Vanguard Total Stock Market ETF |
| Expense ratio | 0.03% | 0.03% |
| AUM | ~$1,701.5B | ~$2,308.9B |
| Dividend yield | 1.0% | 1.0% |
| 5Y CAGR | 13.6% | 12.3% |
| 10Y CAGR | 15.3% | 14.8% |
| 5Y annualized volatility | 16.8% | 17.4% |
| 5Y max drawdown | -24.5% | -25.4% |
Return and risk figures are computed from yfinance daily price history through 2026-06-08; expense ratio, AUM, and yield are from the Vanguard issuer fact sheets (VOO, VTI). For macro framing, the effective federal funds rate sat at 3.63% and headline CPI ran 3.9% year over year (FRED, asof 2026-05-01 and 2026-04-01 respectively) — a regime where the real cost of holding cash instead of equities has been positive but modest.
The size tilt that didn't pay — at least not lately
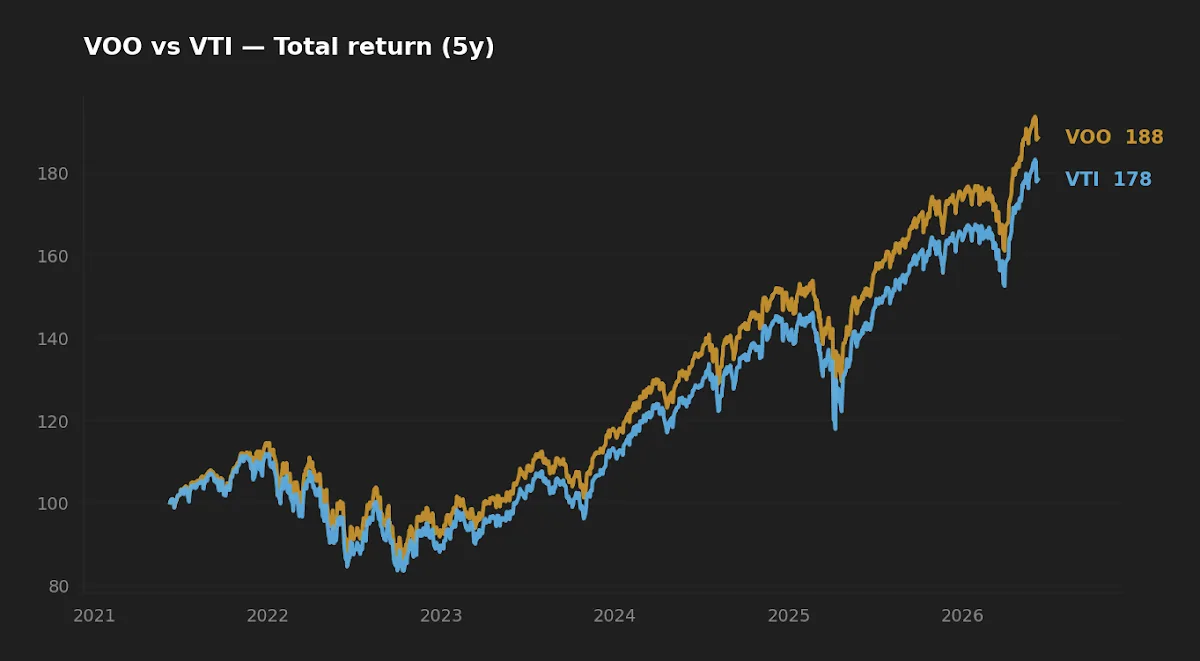
Here is the result that should give a total-market believer pause. Over the trailing five years VOO compounded at 13.6% against VTI's 12.3%, and over ten years 15.3% against 14.8%. The S&P 500 — the narrower, more concentrated fund — beat the total market over both windows. The size tilt that is supposed to be VTI's structural advantage did the opposite of what the textbook predicts.
Initially I expected the gap to run the other way, or at least to wash out. Then the explanation became plain on inspection: this has been a mega-cap-led market. The largest companies, concentrated at the top of both indices but proportionally heavier in VOO, drove returns. VTI's small- and mid-cap sleeve dragged rather than lifted, and it did so while adding risk — 17.4% annualized volatility against VOO's 16.8%, and a slightly deeper 5-year max drawdown of -25.4% versus -24.5%. Over this specific regime, the broader fund delivered marginally less return for marginally more risk. That is the asymmetry the "diversification is always better" heuristic hides.
VTI's extra few thousand holdings are not free diversification — they are a small-cap factor bet, and over the last decade that bet quietly cost return while adding volatility.
The honest caveat is that this is one regime. The size premium is documented over many decades, and it shows up in long, painful waves — absent for years, then arriving all at once. A five- or ten-year window is far too short to declare it dead. What the data can say is that anyone who chose VTI for higher expected return over the recent past did not get it. What it cannot say is whether the next decade rewards the tilt that the last one punished.
Realized risk: how each behaved in the drawdown
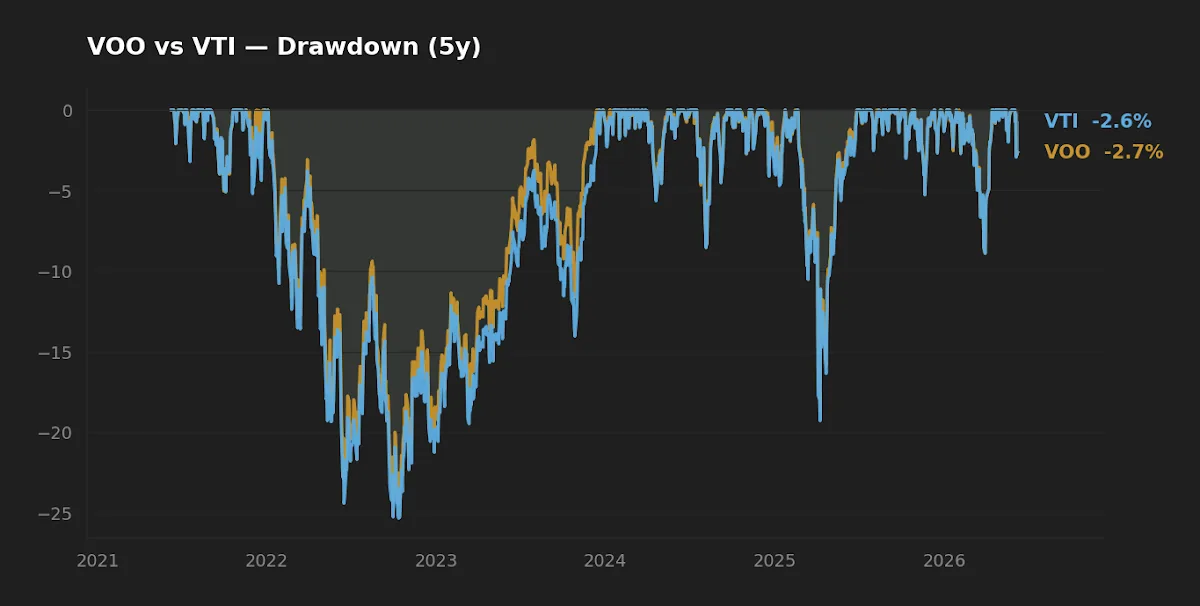
The drawdown profiles are close enough to be almost indistinguishable in stress. Both funds gave back roughly a quarter of their value at the worst point of the last five years, and both recovered on similar timelines. This is unsurprising: when the mega-caps fall, both portfolios fall together, because both are dominated by the same names. VTI's small-cap sleeve made its drawdown slightly deeper, consistent with smaller companies' higher beta in risk-off episodes, but the difference is roughly 90 basis points — not a margin that should drive an allocation decision on its own.
The behavioral point is more useful than the statistical one. Neither fund offers meaningful downside protection relative to the other; both are full-equity exposure that will draw down hard in a real crash. If a 25% paper loss would change your behavior, the fix is an asset-allocation decision — a cash buffer, a bond sleeve, a rebalancing band — not the choice between VOO and VTI. We have written before on the arithmetic of a deep drawdown and what recovery actually requires; that math applies identically to both funds here.
What the gap compounds to — and why I distrust the number
It is tempting to take the 1.3-percentage-point annual gap and extrapolate. Compound $10,000 at 13.6% for 30 years and you reach roughly $459,000; at 12.3%, roughly $324,000 — a difference of about $135,000. That arithmetic is correct and almost certainly misleading. It assumes the recent return gap persists for three decades, which would require a single uninterrupted regime of mega-cap dominance. Single-regime extrapolation is exactly the trap the factor literature warns against: the conditions that produced the gap (data-mined from one favorable window) are the least likely to hold out of sample.
The more defensible reading is that VOO and VTI are close substitutes whose realized difference over any given decade will be modest and regime-dependent. If you already own one, the case for switching and triggering a taxable event is weak. We have covered how taxes erode the after-tax compounding gap — and a realized capital gain to swap between two near-identical funds is a self-inflicted version of exactly that drag.
Scoreboard
| Category | Edge | Why |
|---|---|---|
| Cost | Tie | Both 0.03%, both Vanguard, both deeply liquid. |
| Realized risk (5Y) | VOO (slight) | Lower volatility (16.8% vs 17.4%) and shallower drawdown. |
| Realized return (5Y/10Y) | VOO | 13.6% vs 12.3% and 15.3% vs 14.8%; the size tilt didn't pay. |
| Diversification breadth | VTI | Holds the small/mid-cap sleeve VOO structurally excludes. |
| Suitability as a core | Tie | Either works as a single-fund US equity core. |
FAQ
Are VOO and VTI redundant if I hold both? Largely, yes. They overlap by roughly 85% of weight, so holding both mostly duplicates large-cap exposure while adding a small VTI-only small/mid tilt. Most investors pick one.
Why did the S&P 500 beat the total market if total market is more diversified? The last decade favored mega-caps. VTI's small- and mid-cap holdings underperformed the giants, so broader diversification reached into the weaker-performing part of the market. Diversification reduces dispersion of outcomes; it does not guarantee higher return in every regime.
Does VTI's higher yield or dividend make a difference? No meaningful one — both yield about 1.0%. Neither is a dividend strategy. If income is the goal, that is a different comparison; see our note on dividend yield versus total return.
Should I switch from one to the other? If switching triggers a taxable capital gain, the cost of the switch likely outweighs any expected benefit between two near-identical funds. In a tax-advantaged account the switch is harmless but also largely pointless.
Is one better for a 401(k) versus a taxable account? Both are equally tax-efficient ETFs. The account type does not favor one over the other; your existing holdings and whether a sale realizes gains matter far more.
What this comparison can and can't tell you
It can tell you that, over the trailing five and ten years through June 2026, VOO delivered higher return at slightly lower realized risk than VTI, and that the two funds cost the same. It cannot tell you that this persists. The size premium operates on multi-decade horizons, and a single favorable regime for mega-caps is not evidence it has disappeared. Neither window includes a prolonged small-cap-led bull market, so the dataset is structurally biased against VTI's thesis. Treat the recent gap as a regime observation, not a forecast.
Scenarios where each fund fits
Reader in their 30s, 401(k)-only, wants one US equity fund and never to think about it again → Either works; VTI captures the entire market in a single ticker, which is the cleaner "own everything" default. Reader who already holds VOO in a taxable account → Staying put avoids a needless realized gain; the marginal benefit of switching to VTI does not justify the tax. Reader who specifically wants exposure to the size factor → VTI is the passive way to get a small dose, though a dedicated small-cap value fund expresses that view more deliberately.
Editor's read
If forced to pick one for a long-horizon core, the editor is genuinely indifferent — and that indifference is the point. The fee is identical, the overlap is enormous, and the recent return gap is a regime artifact I would not extrapolate. VTI's "own the whole market" simplicity is the cleaner mental model and the one I lean to marginally; VOO's recent edge is real but explained by a mega-cap regime I cannot promise repeats. The decision that actually matters for an investor here is not VOO versus VTI — it is asset allocation and rebalancing discipline, which dwarf this choice.
The editor holds a Vanguard total-market US equity position; does not hold both VOO and VTI simultaneously at the time of writing.
Key takeaways
- VOO and VTI charge the same 0.03% — cost cannot decide this comparison.
- The only real difference is VTI's ~15% small/mid-cap sleeve, a marginal size-factor bet.
- Over five and ten years that tilt subtracted return (12.3% vs 13.6%; 14.8% vs 15.3%) and added volatility — a regime result, not a verdict on the size premium.
- Drawdowns were nearly identical (~-25%); neither offers downside protection over the other.
- If you already own one, switching in a taxable account likely costs more in realized gains than it could earn.
Methodology. Price, return, volatility, and drawdown figures computed from yfinance daily history through 2026-06-08 (5- and 10-year trailing windows). Expense ratio, AUM, and dividend yield from Vanguard issuer fact sheets. Macro figures from FRED (fed funds asof 2026-05-01; CPI asof 2026-04-01). Data pulled 2026-06-08.
This article is for educational purposes and does not constitute personalized financial advice. See our full Disclaimer.