Photo by Morgan Housel on Unsplash
The short version
- JEPI pays more than twice SCHD's yield (8.5% vs 3.3%), but over the trailing five years SCHD delivered the higher total return (8.4% vs 7.3% CAGR).
- JEPI's smoother ride is not free diversification — its covered-call overlay sells away the right tail of equity returns, which is exactly where long-horizon compounding lives.
- Bottom line: SCHD reads as a long-term core dividend-growth sleeve; JEPI reads as an income tool whose best home is a tax-advantaged account or a decumulation phase, not the growth engine of a 20-year plan.
A high distribution yield is the easiest number for a fund to advertise and the easiest one for an investor to misread. JEPI's 8.5% trailing yield is roughly two and a half times SCHD's 3.3%, and for a reader scanning a brokerage screen that gap looks decisive. The question that actually matters for a long-horizon portfolio is different: which of these two funds builds more wealth per dollar invested over decades, and at what cost in tax friction and forgone upside?
This is a comparison between two genuinely different machines that happen to both print "income" on the label. SCHD is a rules-based dividend-growth equity fund. JEPI is an actively managed equity portfolio wrapped in a systematic covered-call overlay. Treating them as interchangeable yield products is the most common mistake I see, and it is the one this analysis is built to correct.
Context: two different ways to manufacture "income"
SCHD (Schwab U.S. Dividend Equity ETF) tracks the Dow Jones U.S. Dividend 100 Index, screening large-cap U.S. companies on a quality-and-yield composite — dividend consistency, cash-flow-to-debt, return on equity, and dividend growth. It owns roughly 100 stocks and reinvests nothing exotic; the yield comes from ordinary corporate dividends, most of them qualified for the lower long-term capital-gains tax rate.
JEPI (JPMorgan Equity Premium Income ETF) holds a defensive, low-volatility slice of U.S. large-caps and layers on equity-linked notes that replicate writing out-of-the-money S&P 500 call options. The option premium is harvested and distributed monthly. That premium is what produces the headline yield — and critically, most of it is taxed as ordinary income, not as qualified dividends. The two funds are answering different questions: SCHD asks "which companies pay durable, growing dividends?" while JEPI asks "how do I convert near-term market volatility into cash flow?"
The data
| Metric | SCHD | JEPI |
|---|---|---|
| Name | Schwab U.S. Dividend Equity ETF | JPMorgan Equity Premium Income ETF |
| Expense ratio | 0.06% | 0.35% |
| AUM | $94.9B | $44.6B |
| Distribution yield | 3.3% | 8.5% |
| Inception | 2011-10-20 | 2020-05-20 |
| 5Y CAGR | 8.4% | 7.3% |
| 10Y CAGR | 12.8% | n/a (founded 2020) |
| 5Y volatility | 14.4% | 11.0% |
| 5Y max drawdown | -16.8% | -13.7% |
Return and risk figures are computed from yfinance daily price history (total-return basis), pulled 2026-06-08. Expense ratio, AUM, yield, and inception are from the issuer fact sheets: SCHD via Schwab Asset Management and JEPI via J.P. Morgan Asset Management.
The yield illusion: distribution is not return
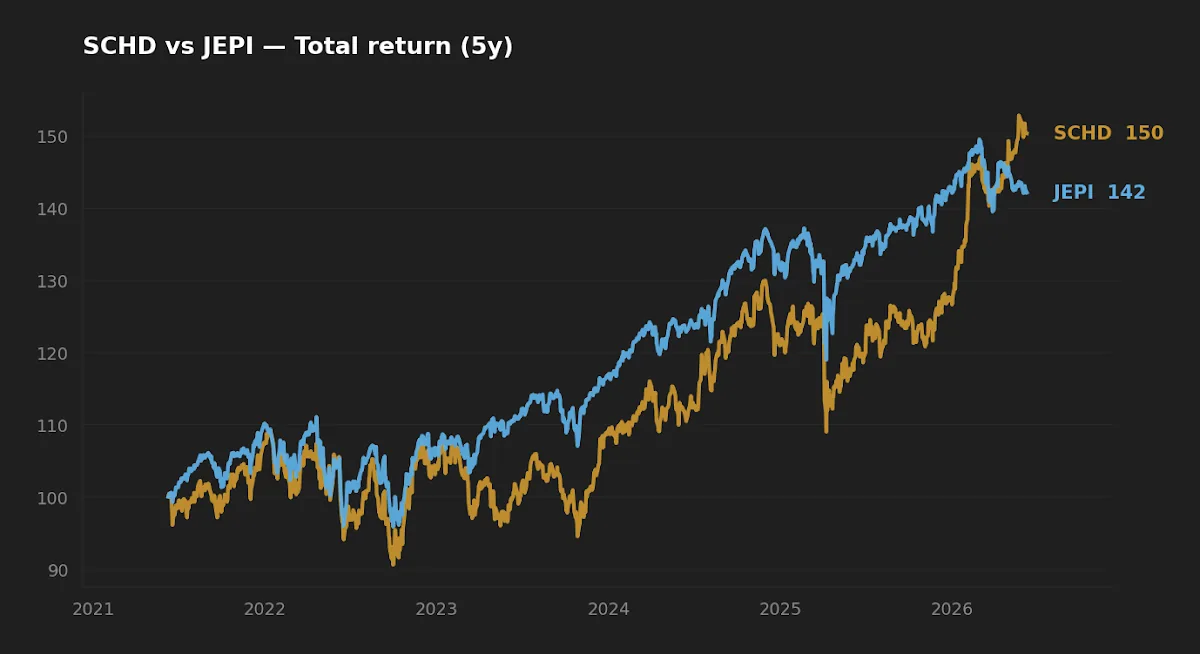
The single most important line in the table is the pair that does not advertise itself: 8.4% versus 7.3% five-year CAGR, in SCHD's favor, despite JEPI distributing more than twice as much cash. A distribution yield tells you how much of your total return arrives as cash you must do something with. It does not tell you how large that total return is.
JEPI's covered-call overlay produces its yield by selling the upper portion of the equity return distribution. In flat or choppy markets, that premium is close to free money — the calls expire worthless and the fund keeps the cash. In strongly rising markets, the calls get exercised against the fund and it forfeits the gains above the strike. Over a full five-year window that included a powerful equity recovery, that forfeited upside is precisely the 1.1-percentage-point CAGR gap. The yield was high; the wealth created was lower.
A covered-call fund's lower volatility is not diversification — it is the sound of the right tail of equity returns being sold for cash, and the right tail is where long-horizon compounding lives.
Realized risk: real, but bought at a price
JEPI's defensive design shows up clearly in the risk numbers. Its five-year volatility of 11.0% is meaningfully below SCHD's 14.4%, and its worst drawdown of -13.7% was shallower than SCHD's -16.8%. For an investor whose primary failure mode is selling in a panic, that smoother path has genuine behavioral value — the fund you can actually hold through a drawdown beats the fund you abandon at the bottom.
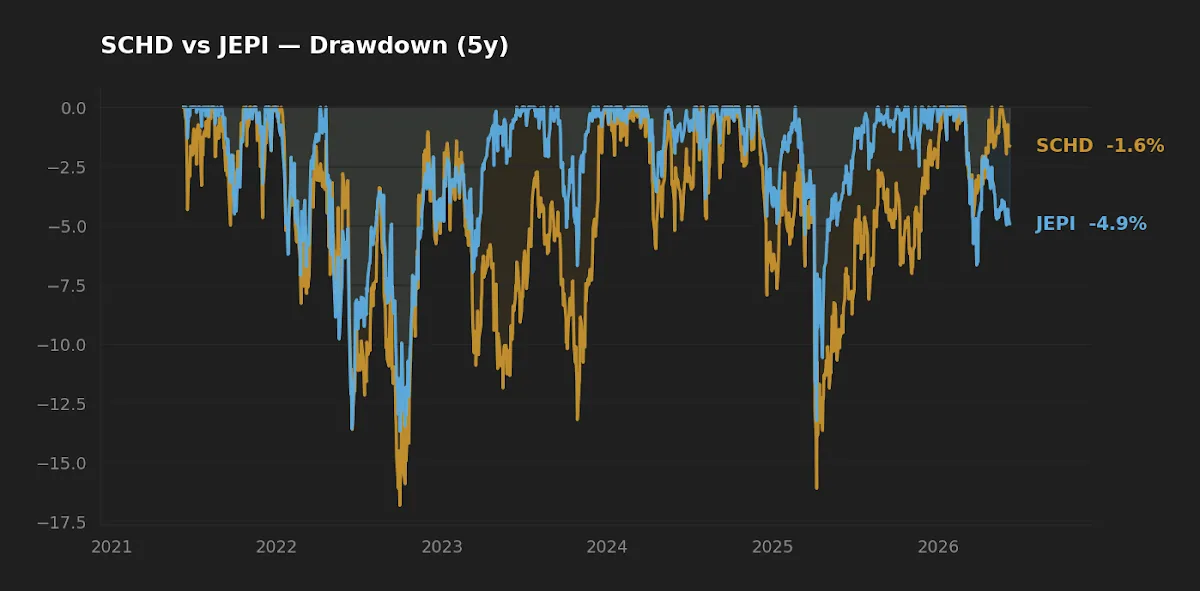
But the source of that calm matters. SCHD's drawdown protection, such as it is, comes from owning profitable, low-leverage companies that fall less in stress. JEPI's comes from a structural cap on gains. Initially I treated JEPI's higher Sharpe-like profile as a clean win on risk-adjusted terms. Then I looked at the shape of the terminal-wealth distribution rather than its standard deviation: capping the upside doesn't just lower volatility symmetrically, it left-shifts the distribution of long-run outcomes. Standard deviation rewards JEPI for giving up gains it would have wanted to keep. That is the asymmetry the volatility number hides.
Tax friction: the second-order cost most screens ignore
SCHD's distributions are overwhelmingly qualified dividends, taxed at long-term capital-gains rates. The bulk of JEPI's distribution is option-premium income flowing through equity-linked notes, taxed as ordinary income at the investor's marginal rate. For a taxable account, that difference can quietly consume a large share of JEPI's apparent yield advantage — the tax-cost ratio on the income is structurally higher.
This has a clean implication that flips the comparison depending on location. In a tax-advantaged account — an IRA or 401(k) — JEPI's tax disadvantage disappears entirely, and its monthly income plus lower volatility becomes far more attractive, especially for someone drawing down rather than accumulating. In a taxable account during the accumulation years, the same fund is working against you twice: lower total return and a higher tax bill on the income you didn't ask to realize. With the fed funds rate at 3.63% and CPI running near 3.9% year-over-year (FRED, as of 2026-05-01 and 2026-04-01 respectively), the real, after-tax value of forced ordinary income is worth scrutinizing rather than celebrating.
Cost and capacity
The expense-ratio gap is 0.29% — 0.35% for JEPI against 0.06% for SCHD. That is the honest price of active management plus an options overlay versus a passive index screen, and it is defensible if the overlay delivers what an investor specifically wants. Over multi-decade horizons, though, basis points compound relentlessly, and a passive fund starts every year 29 bp ahead before a single trade is placed. Both funds are large enough that capacity and bid-ask spread are non-issues: SCHD at $94.9B and JEPI at $44.6B are among the most liquid funds in their categories, so closure risk and trading friction are negligible for a long-term holder.
Scoreboard
| Category | Winner | Why |
|---|---|---|
| Cost | SCHD | 0.06% vs 0.35% — a 0.29% annual head start |
| Realized risk | JEPI | Lower volatility (11.0%) and shallower drawdown (-13.7%) |
| Realized return | SCHD | 8.4% vs 7.3% 5Y CAGR; uncapped upside |
| Suitability (long-term core) | SCHD | Qualified income, lower cost, growth participation |
What this comparison can and can't tell you
The hard limit here is JEPI's track record: founded in May 2020, it has lived its entire life inside one broad regime — a recovery, an inflation shock, and a rate-hiking cycle, but no prolonged grinding bear market of the kind that tests a covered-call strategy's worst case. SCHD has a longer 10-year record (12.8% CAGR) that JEPI simply cannot match in length. Five-year statistics are a single-regime sample; they describe what happened, not the full distribution of what could. Neither fund has been stress-tested through a multi-year sideways market, which is the environment where covered-call income theoretically shines most relative to buy-and-hold — so JEPI's structural case is partly untested in the direction of its own strength.
Scenarios where each fund fits
Reader in their 30s, 401(k)-only, accumulating, no near-term income need → SCHD's profile (lower cost, qualified income, uncapped participation) aligns with a growth-phase dividend sleeve. JEPI's capped upside works against a long compounding runway. This pairs naturally with the logic in the five-ETF long-term core rationale.
Reader near or in retirement, holding in a tax-advantaged account, wants smooth monthly cash flow → JEPI's higher distribution and lower drawdown become genuinely useful, and the ordinary-income tax penalty is neutralized inside the shelter.
Reader building a taxable account for the long haul → JEPI's tax-cost ratio argues for caution; SCHD or a broader dividend-growth approach (see SCHD vs VIG on dividend quality factors) is the more tax-efficient base.
FAQ
Is JEPI's 8.5% yield safe? The distribution varies month to month because it depends on option premium, which rises and falls with market volatility. It is not a fixed coupon; in calm markets the yield typically compresses. "Safe" is the wrong frame — it is variable by design.
Why did SCHD beat JEPI on total return despite a much lower yield? Because total return includes price appreciation, and JEPI's covered-call overlay caps the upside it can capture in rising markets. The high yield is partly a return of the gains the fund agreed to forgo.
Which is more tax-efficient? SCHD, in a taxable account. Its dividends are mostly qualified; JEPI's option-premium income is largely taxed as ordinary income. In a tax-advantaged account the difference is irrelevant.
Can I hold both? Some investors pair them deliberately — SCHD for growth and qualified income, JEPI for monthly cash flow and a smoother path. The relevant question is account location and whether you need the income now or are still accumulating.
How does JEPI compare to other options-overlay income funds? The category is expanding quickly; a structural comparison of premium-income approaches appears in JEPI vs AIPI.
Key takeaways
- A higher distribution yield (JEPI 8.5% vs SCHD 3.3%) did not translate into a higher total return — SCHD led 8.4% to 7.3% over five years.
- JEPI's lower volatility and shallower drawdown are real, but they are purchased by selling the upside tail, which left-shifts long-run outcomes.
- Tax location is decisive: JEPI's ordinary-income distributions favor a tax-advantaged account; SCHD's qualified dividends suit taxable accumulation.
- The 0.29% expense-ratio gap compounds against JEPI every year before any trade is placed.
- JEPI's short, single-regime history is the largest gap in the evidence — its theoretical strength (sideways markets) remains largely untested.
Editor's read
For a long-horizon core sleeve in an accumulation-phase taxable account, the editor leans toward SCHD: it won on realized total return, costs 0.29% less per year, distributes mostly qualified income, and carries a decade-long record across more than one regime. JEPI is a well-built tool for a specific job — smooth monthly income inside a tax shelter, particularly in decumulation — but capping equity upside is the wrong trade for a portfolio whose entire advantage is time.
The editor holds SCHD; does not hold JEPI at the time of writing.
Methodology. Price, total return, volatility, and drawdown figures computed from yfinance daily history pulled 2026-06-08; five-year window. Expense ratio, AUM, distribution yield, and inception from issuer fact sheets (Schwab Asset Management; J.P. Morgan Asset Management). Macro figures from FRED: fed funds rate 3.63% as of 2026-05-01, CPI year-over-year 3.9% as of 2026-04-01.
This article is for educational purposes and does not constitute personalized financial advice. Disclaimer.