
Photo by lonely blue on Unsplash
The short version
- QQQ and QQQM track the identical index (the Nasdaq-100), so their return difference over five years is a rounding error — 17.2% vs 17.3% CAGR.
- The real distinction is structural: QQQ is an older unit investment trust with a 0.18% fee and deep options liquidity; QQQM is a 0.15% open-end fund built for accumulators.
- Bottom line: a long-term holder with no need to trade options gives up almost nothing by choosing the cheaper, lower-priced twin — and a small structural edge favors it.
Invesco sells two products that hold the same 100 stocks in the same proportions and answer to the same benchmark. One has roughly $494B in assets and a two-decade record; the other launched in 2020 and charges three basis points less. The marketing frames this as a simple choice between "the original" and "the value version." That framing misses the part that actually matters.
The interesting question is not which fund returns more — they cannot meaningfully diverge while tracking the same index. It is which wrapper costs a specific investor less in total, and where the wrapper structure itself, not the headline expense ratio, quietly tilts the outcome over decades.
Context: same index, two legal structures
Both funds replicate the Nasdaq-100, a modified-cap-weighted index of the largest non-financial companies listed on the Nasdaq. As of this writing that means a portfolio dominated by a handful of mega-cap technology and communications names — high growth exposure, high concentration, and the volatility profile that comes with both. If you want a broader read on how this "tech beta" stack compares to software-only and cloud-only exposures, that comparison is covered in IGV vs WCLD vs QQQ.
What separates QQQ from QQQM is older than either marketing page admits. QQQ, launched in 1999, is structured as a unit investment trust (UIT). QQQM, launched in October 2020, is a conventional open-end fund (a 1940 Act regulated investment company). That legal distinction is the hinge this entire comparison turns on, and we return to it below.
The data side by side
| Metric | QQQ | QQQM |
|---|---|---|
| Name | Invesco QQQ Trust | Invesco NASDAQ 100 ETF |
| Expense ratio | 0.18% | 0.15% |
| AUM | $494.0B | $96.9B |
| Inception | 1999-03-10 | 2020-10-13 |
| NAV per share | $705.04 | $290.28 |
| Dividend yield | 0.4% | 0.4% |
| 5Y CAGR | 17.2% | 17.3% |
| 10Y CAGR | 21.4% | n/a (post-2020) |
| 5Y volatility (annualized) | 22.5% | 22.3% |
| 5Y max drawdown | -35.1% | -35.0% |
Source: yfinance for price, return, volatility and drawdown (window ending 2026-06-08); Invesco issuer fact sheets for expense ratio, AUM and inception (QQQ fact sheet, QQQM fact sheet). QQQM has no 10-year figure because it did not exist ten years ago — a look-back limit worth keeping in mind throughout.
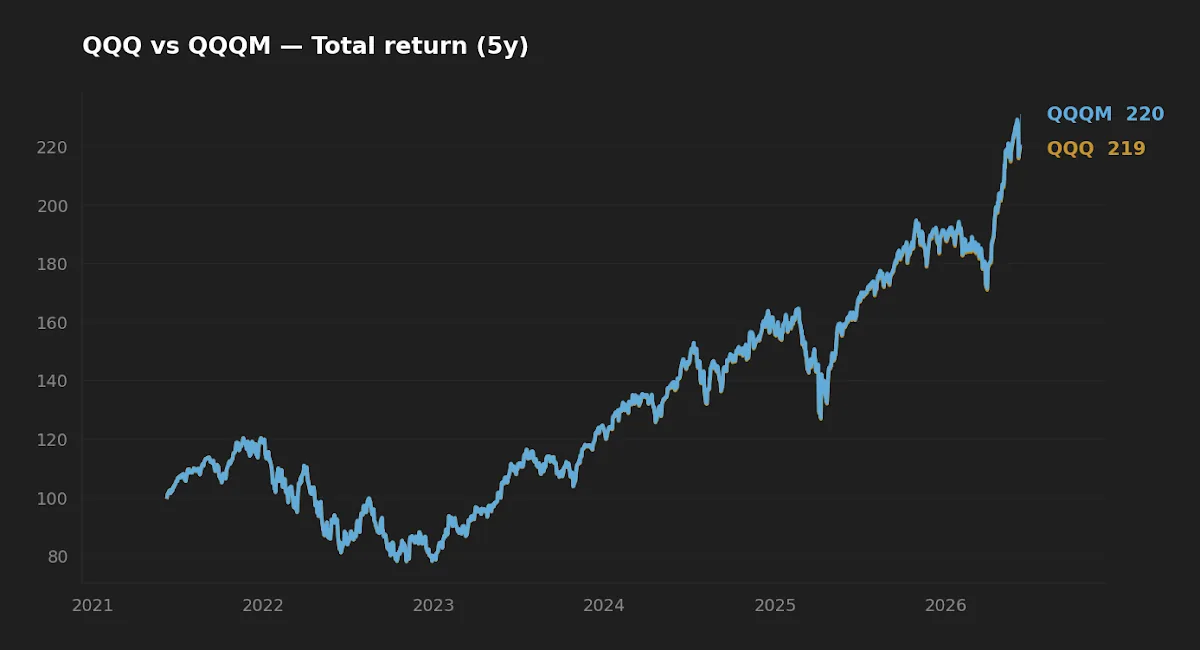
The normalized return chart is almost boring, and that is the point. The two lines sit on top of each other. A 0.1 percentage-point gap in five-year CAGR is well inside the noise created by slightly different securities-lending revenue, cash handling, and the timing of distributions. Neither fund "wins" on return in any statistically defensible sense.
Where the 3 basis points actually go
QQQM costs 0.15% against QQQ's 0.18% — a 3 basis-point gap. On a $10,000 position that is $3 per year. It is tempting to dismiss this as immaterial, and over short horizons it is. But cost compounds the same way returns do. Faithfulness in small things is, in practice, just arithmetic: three basis points held across a multi-decade accumulation, against a balance that grows over time, becomes a non-trivial drag relative to its own size. The principle that small persistent costs deserve attention is the same one explored in The 0.1% Allocation Question.
That said, three basis points is not why a long-term holder should care which one they own. The structural difference matters more.
The headline is a 3 basis-point fee gap. The story is a fund-structure difference that the expense ratio doesn't capture.
The wrapper difference the fee ratio hides
This is the non-obvious part. QQQ's unit-investment-trust structure imposes two constraints that an open-end fund like QQQM does not face. First, a UIT generally cannot reinvest dividends received from its holdings internally — it must hold them as cash until the scheduled distribution. In a rising market, that idle cash is a small performance leak, the classic "cash drag." Second, a UIT cannot lend out its securities. Securities lending generates modest revenue that an open-end fund can use to offset costs.
Neither effect is large. Both are real, and both run in QQQM's favor, layered on top of the 3 basis-point fee advantage. This is the asymmetry the surface data hides: QQQ's structural quirks and QQQM's lower fee push in the same direction, yet the realized return gap is still essentially zero. That tells you how small these effects are in absolute terms — and also that there is no compensating structural advantage flowing back to QQQ for the long-term holder. Initially I assumed the deeper liquidity of QQQ might show up as tighter effective tracking; on the five-year data it doesn't translate into a return edge for a buy-and-hold position.
Realized risk: effectively identical
Five-year annualized volatility is 22.5% for QQQ and 22.3% for QQQM. Maximum drawdown over the same window is -35.1% and -35.0% respectively. These are the same number to within measurement error — which is exactly what you would expect from two funds holding the same basket. The risk you are taking is Nasdaq-100 risk; the wrapper does not change it.
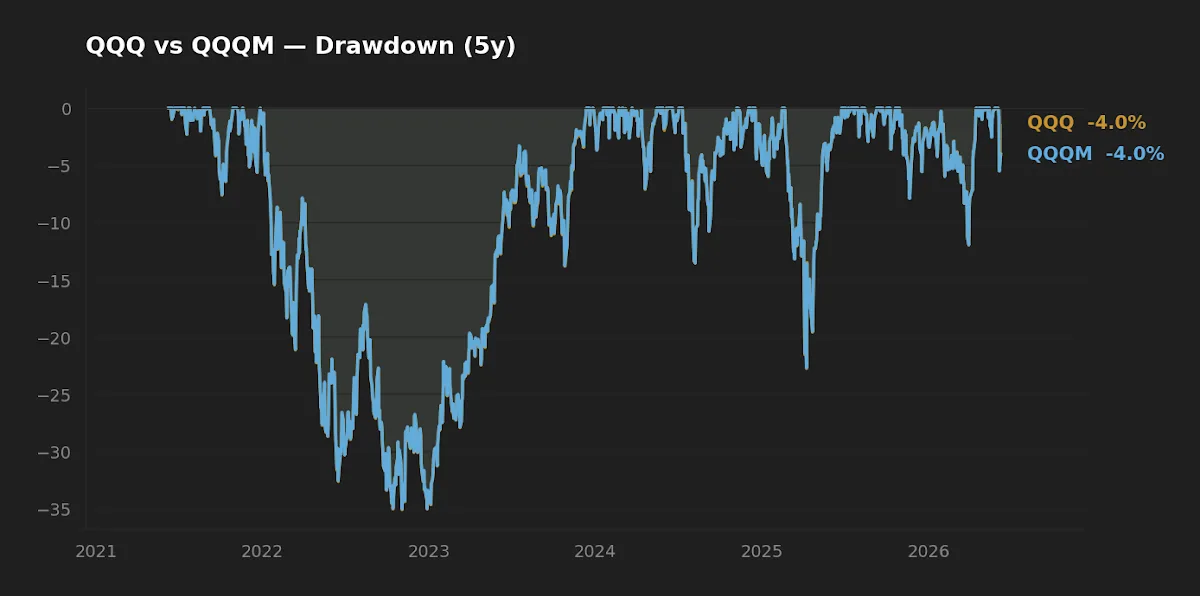
The drawdown chart reinforces the point: the two curves trace the same path into and out of every decline. A roughly -35% peak-to-trough fall is the realized downside both funds delivered in the recent window — a useful reminder that concentrated growth exposure carries concentrated drawdown risk regardless of which ticker holds it. The recovery math behind a drawdown of that magnitude is its own subject, treated in The Arithmetic of a -30% Drawdown.
Where QQQ still earns its keep
Almost everything above favors QQQM, so it is worth stating clearly what QQQ does better. With roughly $494B in assets against QQQM's $96.9B, QQQ is one of the most liquid equity vehicles in the world. It anchors a deep, mature options market. For an investor who trades actively, writes covered calls, or needs to move large size with minimal market impact, that ecosystem is a genuine advantage — and it is the reason QQQ's AUM has not migrated wholesale to its cheaper sibling. QQQM is liquid enough for ordinary accumulation, but it is not the venue for an options strategy.
There is also a quiet behavioral angle in the share price. QQQM trades near $290 versus QQQ's $705. In an account without fractional-share support, the lower price lets a fixed monthly contribution buy a more precise number of shares, leaving less uninvested cash on each purchase. It is a minor point, but for disciplined dollar-cost averaging it is a real one, and it nudges in QQQM's favor for the same accumulator the fee already favors.
Scoreboard: winner by category
| Category | Edge | Why |
|---|---|---|
| Cost | QQQM | 0.15% vs 0.18%, plus structural cash-drag and lending edge |
| Realized risk | Tie | 22.3% vs 22.5% vol; -35.0% vs -35.1% drawdown |
| Realized return | Tie | 17.3% vs 17.2% 5Y CAGR — within noise |
| Suitability (buy-and-hold) | QQQM | Lower fee, lower share price, open-end structure |
| Suitability (trading/options) | QQQ | Deeper liquidity and options market |
FAQ
Do QQQ and QQQM hold different stocks?
No. Both track the Nasdaq-100 and hold the same constituents in the same weights. Any return difference comes from fees, cash handling, and distribution timing — not from the holdings.
Why does QQQ still have far more assets if QQQM is cheaper?
QQQ launched in 1999 and accumulated two decades of assets and an entrenched options market before QQQM existed. Traders and institutions value that liquidity, so they stay. QQQM is aimed at long-term holders who do not need it.
Is the 0.03% fee difference worth switching for in a taxable account?
Possibly not. Selling QQQ to buy QQQM in a taxable account can realize capital gains, and the tax bill can dwarf decades of the 3 basis-point saving. In a tax-advantaged account the switch is frictionless; in a taxable one, the math depends on your embedded gain.
Does QQQM's shorter history make it riskier?
The fund is younger, but it tracks the same index as a long-established benchmark, so the underlying exposure is not new. The practical limitation is analytical: there is no 10-year track record to study for QQQM specifically.
Should either of these be a complete portfolio?
Neither is diversified — both are concentrated bets on large-cap Nasdaq growth. The Nasdaq-100 is typically one sleeve of a broader allocation, not the whole thing; one example of how it fits into a multi-fund core appears in The Rationale Behind a Five-ETF Long-Term Core.
What this comparison can and can't tell you
The return and risk figures here cover a single five-year window ending June 2026 — a period dominated by a strong large-cap growth regime, with QQQM having no data before October 2020. That is one regime, not a representative sample of market history. It cannot tell you how the wrapper differences behave through a prolonged sideways or value-led market, and it does not stress-test either fund through a multi-year bear market in their overlapping lifetimes. The structural points (UIT cash drag, no securities lending) are documented features of the fund structures, but their realized magnitude is small enough that it is hard to isolate cleanly in noisy return data. Treat the conclusion as "cost and structure modestly favor QQQM for holders," not as a precise forecast of future spread.
Scenarios where each fund fits
Reader in their 30s, contributing monthly to a 401(k) or IRA, no options activity → QQQM is the cleaner fit: lower fee, lower share price for precise contributions, and an open-end structure, with no tax cost to choosing it from the start.
Reader who already holds a large QQQ position in a taxable account → Switching may not be worth the realized capital-gains tax. Holding QQQ and directing new contributions to QQQM is often the lower-friction path.
Reader who writes covered calls or trades around a core position → QQQ's liquidity and options market are the deciding factor; the 3 basis points are irrelevant next to execution quality.
Editor's read
For a long-term core sleeve with no options overlay, the editor leans toward QQQM. The 3 basis-point fee gap is small but unforgiving over decades, and the open-end structure avoids the unit-investment-trust cash drag that quietly works against QQQ — both effects pushing the same way. QQQ remains the right tool for anyone who actually uses its liquidity and options market; for a buy-and-hold accumulator, that advantage is paying for capability they will never use.
Disclosure: the editor holds QQQM as part of a long-term core allocation and does not hold QQQ at the time of writing.
Methodology: Price, total-return, volatility and drawdown figures from yfinance, five-year window ending 2026-06-08 (data pulled 2026-06-09). Expense ratio, AUM, and inception dates from Invesco issuer fact sheets. Macro reference: U.S. CPI 3.9% year-over-year (FRED, asof 2026-04-01) and the federal funds rate at 3.63% (FRED, asof 2026-05-01), included only to frame the prevailing rate and inflation backdrop. CAGR, yield, and drawdown are reported as percentages to one decimal; AUM in U.S. dollars.
This article is for educational purposes and does not constitute personalized financial advice. See our full Disclaimer.