Photo by Daniel Brzdęk on Unsplash
The short version
- VGT is a pure GICS Information Technology sector fund; QQQ is the Nasdaq-100, a multi-sector index that excludes some of the names most people assume are "tech." The labels overlap less than the holdings suggest.
- Over the trailing five years VGT compounded faster (21.1% vs 17.2%) with more volatility (25.3% vs 22.5%), yet both funds bottomed at almost exactly the same drawdown near −35%.
- Bottom line: VGT is a concentrated sector bet that leans harder into hardware, semiconductors and payments; QQQ is a broader large-cap growth proxy. They are not substitutes for the same sleeve.
The question that brings most readers here is simple: if I already own one of these, am I paying for diversification I don't need by owning the other? VGT and QQQ are routinely listed side by side as "the two tech ETFs," and the assumption is that they are close enough to be interchangeable. They are not — and the reasons matter more for how a portfolio behaves in stress than for the headline return number.
The distinction is structural, not cosmetic. One fund is built from a sector definition; the other is built from a listing exchange. That single difference in construction drives almost everything else: which names are in, which are conspicuously absent, how concentrated the top of the book is, and how each fund responds when the growth trade reverses.
Context: a sector fund and an index fund are not the same animal
VGT — the Vanguard Information Technology Index Fund ETF — tracks the stocks classified as Information Technology under the Global Industry Classification Standard (GICS). That is a sector definition. It includes Apple, Microsoft, Nvidia, Broadcom and the semiconductor complex, plus a large slug of payment networks like Visa and Mastercard, which GICS files under tech rather than financials.
QQQ — the Invesco QQQ Trust — tracks the Nasdaq-100, the 100 largest non-financial companies listed on the Nasdaq exchange. That is an exchange-and-size rule, not a sector rule. Crucially, GICS does not classify several of the most familiar "tech" names as Information Technology: Alphabet and Meta sit in Communication Services; Amazon and Tesla sit in Consumer Discretionary. All four are in QQQ. None of them are in VGT.
So the intuitive picture — VGT as "concentrated tech," QQQ as "broad tech" — is backwards in one important way. QQQ holds a wider set of sectors, but VGT holds a more concentrated slice of the actual technology supply chain. The funds are different cuts, not different magnifications of the same cut.
The data, side by side
The table below uses price and return data pulled from yfinance on 2026-06-08, with expense ratio, AUM and inception taken from each issuer's fact sheet (Vanguard VGT, Invesco QQQ). CAGR, volatility and drawdown are realized over the trailing five and ten years.
| Metric | VGT | QQQ |
|---|---|---|
| Fund | Vanguard Information Technology ETF | Invesco QQQ Trust |
| Index | GICS Information Technology sector | Nasdaq-100 |
| Expense ratio | 0.09% | 0.18% |
| AUM | $170.1B | $494.0B |
| Inception | 2004-03-25 | 1999-03-10 |
| Dividend yield | 0.3% | 0.4% |
| 5Y CAGR | 21.1% | 17.2% |
| 10Y CAGR | 25.0% | 21.4% |
| 5Y volatility (annualized) | 25.3% | 22.5% |
| 5Y max drawdown | −35.1% | −35.1% |
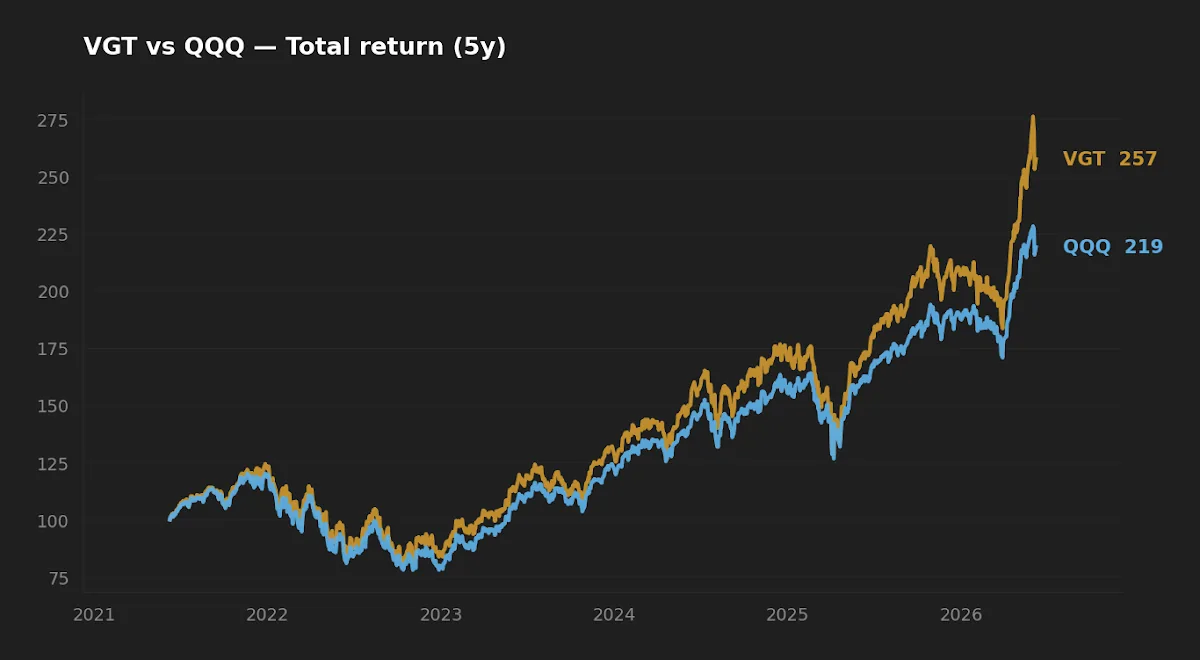
The return gap is real and persistent across both the five- and ten-year windows. But before reading it as "VGT wins," it is worth being precise about what produced it — because the same construction choice that lifted VGT's return over this window is the one that exposes it most in a different regime.
Why VGT outran QQQ — and the exposure that explains it
VGT's edge over this period traces to two structural tilts. First, it carries no Alphabet, Meta, Amazon or Tesla — and over the trailing five years the semiconductor and hardware names that are in VGT, led by Nvidia and Broadcom, outperformed that excluded group. Second, VGT's top-of-book concentration is heavier: a sector fund weighted by market cap pushes a larger share into the two or three biggest names, so when those names lead, VGT compounds faster than a 100-stock index can.
That is the asymmetry the headline CAGR hides. VGT did not beat QQQ because it is "more tech." It beat QQQ because, over this specific window, the part of tech it concentrates in — semiconductors, hardware, payments — led the part QQQ dilutes with consumer and communication names. In a regime where megacap platform advertising or consumer discretionary leads instead, the same concentration cuts the other way. This is single-regime risk, and five years of data cannot resolve it.
It is also why factor exposure, not sector label, is the more honest lens. Readers tracking how these tilts move over time may find the discussion in how factor loadings drift across MTUM, QUAL and SIZE useful — concentration and momentum loadings are not static, and a fund that looks like a quality-growth holding in one window can read as a high-beta momentum holding in the next.
VGT did not beat QQQ because it is "more tech." It beat QQQ because the slice of tech it concentrates in led the slice QQQ dilutes — and that leadership is a regime, not a law.
Realized risk: more volatility, the same hole
Here is the result that most rewards a second look. VGT ran meaningfully hotter on volatility — 25.3% annualized against QQQ's 22.5% — yet the two funds' worst five-year drawdowns are effectively identical: −35.1% for VGT, −35.1% for QQQ. Higher path volatility did not translate into a deeper hole at the bottom.
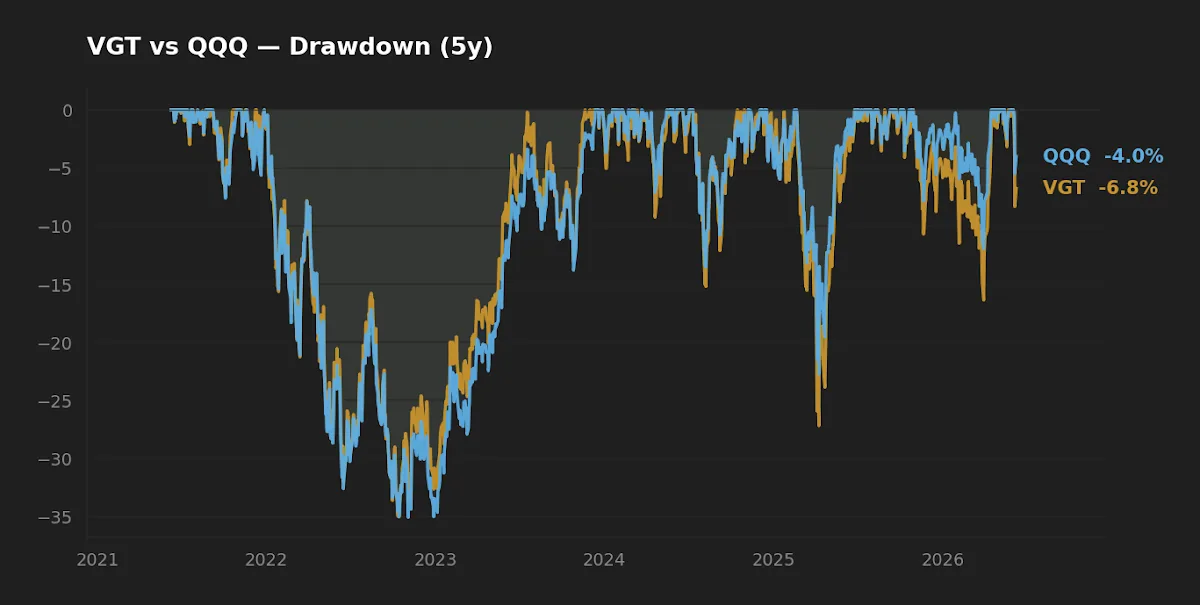
The explanation is correlation, not coincidence. In a broad growth selloff, the megacap names that dominate both funds fall together; the marginal diversification QQQ gets from holding Amazon and Alphabet does little when those stocks are selling off alongside Apple and Nvidia. Sector concentration and index breadth converge in the tail because the same dozen companies drive the bulk of both portfolios. The diversification QQQ appears to offer on paper is largely within the same correlated growth complex — which is exactly when you would want it to pay off, and exactly when it does not.
The practical reading: choosing QQQ over VGT for downside protection is not supported by the realized data. Both funds expose the holder to a roughly one-third peak-to-trough decline in a bad year. The macro backdrop reinforces the point — with the federal funds rate at 3.63% (FRED, asof 2026-05-01) and CPI still running at 3.9% year over year (FRED, asof 2026-04-01), long-duration growth equities remain sensitive to the path of rates, and neither fund offers shelter from that sensitivity.
Cost, scale and the implementation details that compound
VGT's 0.09% expense ratio is half of QQQ's 0.18%. On a long horizon that 9-basis-point gap is not trivial — cost compounds in the same direction every year, with none of the regime dependence that return leadership has. This is the one variable in the comparison you can actually control.
There is a wrinkle worth naming, though: QQQ's fee is a deliberate artifact of its role. Invesco keeps QQQ at the higher fee because it anchors a deep options and liquidity ecosystem; the firm's own QQQM share class tracks the identical index at a lower expense ratio for buy-and-hold investors who do not need that trading infrastructure. If the goal is a long-term core holding rather than a trading vehicle, the relevant cost comparison may not even be VGT versus QQQ — a point developed further in the look at QQQM versus QRFT. Both funds are large enough — $170B and $494B — that bid-ask spread and closure risk are non-issues; the friction here lives in the expense line, not in liquidity.
For readers thinking about where either fund sits relative to the broader software-and-platform stack, the breakdown of IGV, WCLD and QQQ is a useful companion, and the question of how much of any portfolio should carry this kind of correlated growth exposure is the subject of asset allocation in practice.
Scoreboard
| Category | Edge | Why |
|---|---|---|
| Cost | VGT | 0.09% vs 0.18% — half the fee, compounding in one direction |
| Realized risk | Tie | Near-identical −35.1% max drawdown despite VGT's higher volatility |
| Realized return | VGT (this window) | 21.1% vs 17.2% 5Y CAGR — driven by semis/hardware tilt, regime-dependent |
| Suitability | Depends | VGT = concentrated sector tilt; QQQ = broad large-cap growth proxy |
FAQ
Are VGT and QQQ redundant if I hold both? There is meaningful overlap in the megacap names that dominate both, so holding both does concentrate rather than diversify. But they are not identical: VGT excludes Alphabet, Meta, Amazon and Tesla, while QQQ includes them and adds consumer and communication exposure. Owning both is a deliberate double-weight on shared megacaps, not a diversification move.
Is QQQ actually a technology fund? Not in the GICS sense. It is the Nasdaq-100 — the largest non-financial Nasdaq listings regardless of sector. A large share is technology, but it also carries consumer discretionary and communication services names that a pure sector fund like VGT excludes.
Why did VGT outperform QQQ over five years? Over this specific window the semiconductor, hardware and payments names concentrated in VGT outperformed the consumer and communication names that QQQ adds, and VGT's heavier top-of-book concentration amplified that. This is regime-specific and should not be extrapolated as a permanent edge.
Which one is safer in a downturn? Neither, on the realized data. Both posted essentially the same −35.1% five-year max drawdown. The shared megacap exposure means they fall together in a broad growth selloff.
Should cost be the deciding factor? Cost is the most predictable variable — VGT's lower fee is a known, compounding advantage. But if you want Nasdaq-100 exposure specifically, comparing VGT to a cheaper Nasdaq-100 share class rather than to QQQ itself is the more honest cost comparison.
What this comparison can and can't tell you
The return and risk figures here are realized over a single five- to ten-year window that was, for most of its length, favorable to large-cap growth and especially to semiconductors. That is one regime. It does not include a prolonged value rotation, a sustained high-rate environment, or a semiconductor-specific drawdown — any of which would likely flip the relative ranking. Volatility and CAGR are backward-looking; they describe what happened, not what the funds will do. Treat the −35.1% drawdown figure as a lower bound on plausible pain, not a ceiling.
Scenarios where each fund fits
Reader in their 30s, 401(k)-only, already holds a total-market index fund and wants a satellite growth tilt: VGT expresses a cleaner, lower-cost bet on the technology supply chain — but it is a concentrated tilt, not a diversifier. Reader who wants a single large-cap growth proxy and values the deep options/liquidity ecosystem around it: QQQ fits, though a buy-and-hold investor with no trading needs should weigh the cheaper Nasdaq-100 share class. Reader trying to reduce downside: neither fund addresses that goal; the realized drawdowns are equivalent and both move with the same megacaps.
Editor's read
If the job is a long-term core technology sleeve, the editor leans toward VGT — the 9-basis-point fee advantage is unforgiving over decades, and the sector definition is at least internally coherent. But the honest caveat is that VGT's recent edge rests on a semiconductor-led regime that five years of data cannot certify as durable, and its near-identical drawdown to QQQ means it offers no protection for the extra volatility. For an investor who specifically wants Nasdaq-100 breadth, the real comparison is not against QQQ's 0.18% fee but against the cheaper share class of the same index.
The editor holds neither VGT nor QQQ at the time of writing.
Methodology: Price, return, volatility and drawdown data from yfinance, pulled 2026-06-08; five- and ten-year windows ending that date. Expense ratio, AUM, inception and dividend yield from issuer fact sheets (Vanguard, Invesco). Macro figures from FRED: federal funds rate asof 2026-05-01, CPI year-over-year asof 2026-04-01.
This article is for educational purposes and does not constitute personalized financial advice. See our full Disclaimer.