
The short version
- A 1% annualized return gap on $100,000 over 30 years compounds to roughly $545,000 of terminal value — real, but rarely created by a single 0.1% fee decision.
- The decisions that actually move terminal wealth, in order: equity/bond mix, behavior in drawdowns, international weight, factor tilts, fees. Most retail content inverts that order.
- Bottom line: discipline about allocation roles beats precision about ticker selection. The portfolio held through a 30% drawdown beats the one that backtested half a point higher.
The premise behind every "0.1% changes everything" headline is correct in arithmetic and almost always misleading in practice. Small differences in fees, factor tilts, and rebalancing bands do compound. The question worth asking is which small differences compound into real terminal-value gaps for a long-horizon investor, and which are calculator theatre dressed up as discovery.
The earlier piece on how 0.1% fine-tuning creates a $400k gap walked through one version of this arithmetic. This piece dismantles the same math from the other direction: not to celebrate that 10 basis points matter, but to put 10 basis points in the right slot in the hierarchy of decisions that actually determine whether a 30-year target is hit.
The arithmetic, separated from the marketing
Settle the headline number first. $100,000 invested for 30 years at 10% annualized becomes roughly $1,744,940; at 11% it becomes $2,289,230. The gap is $544,290. That difference is real — but it isn't created by a 0.1% expense ratio. It's created by a full percentage point of net annualized return, which is a much bigger spread than any single fee decision will produce in the modern ETF universe.
A 10 bp expense ratio difference — say, 0.03% versus 0.13% — moves the same $100,000 / 30-year / 10% gross calculation by roughly $50,000 in terminal value. That is not nothing. It is also not the difference between $1M and $2M. Honest math beats hype math, and conflating the two is how readers end up chasing 5 bp inside their core sleeve while ignoring a 5% allocation drift in the sleeve next to it.
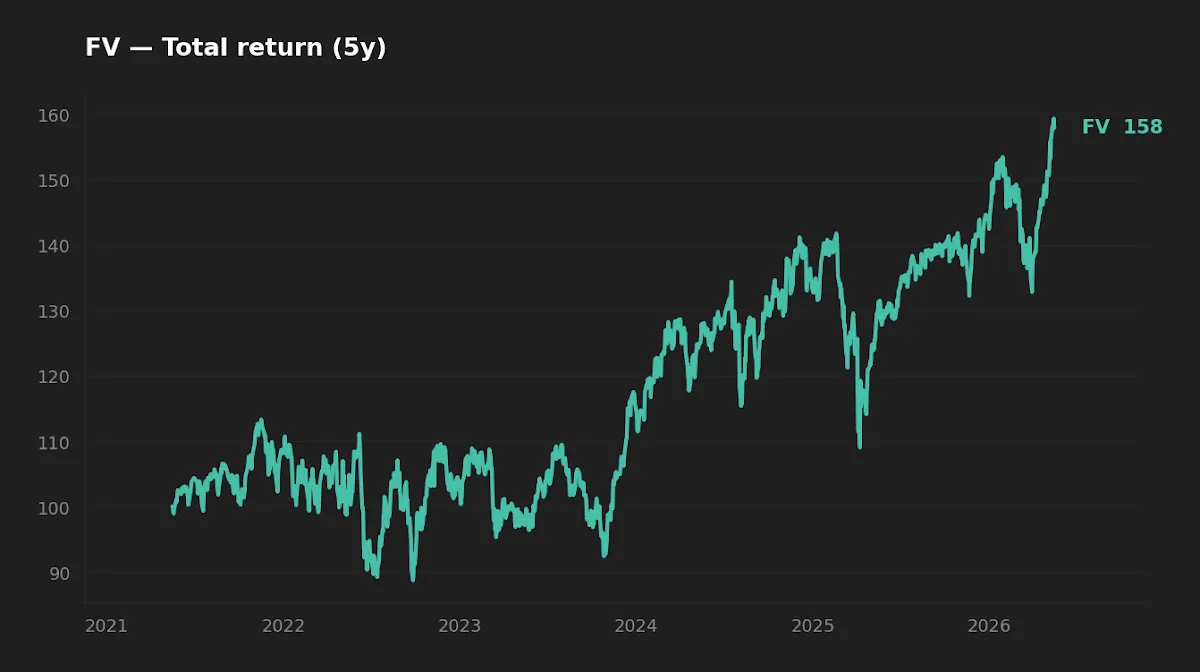
The fee question becomes more interesting when the gap isn't 10 bp but 80 bp. Consider an investor choosing between a broad-market index ETF charging 0.03% and a thematic momentum product like the First Trust Dorsey Wright Focus 5 ETF (FV), charging 0.89% (issuer fact sheet, as of 2026-05-16). On the same $100,000 over 30 years at 10% gross, that 86 bp expense gap compounds to roughly $400,000 of foregone terminal value — before any consideration of the tracking error, turnover, or factor decay the active strategy may carry on top.
| Vehicle | Expense ratio | AUM | 5Y CAGR | 10Y CAGR | 5Y max drawdown |
|---|---|---|---|---|---|
| Broad US core (illustrative, ~0.03% baseline) | 0.03% | — | — | — | — |
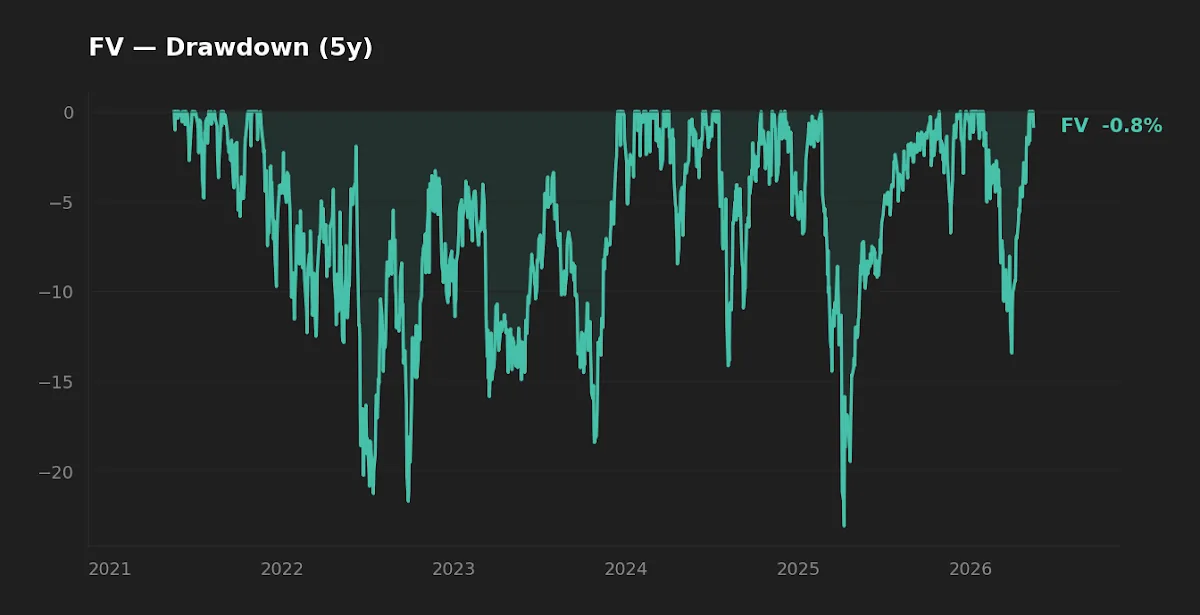
| First Trust Dorsey Wright Focus 5 (FV) | 0.89% | $3.5B | 9.5% | 13.0% | −23.1% |
FV data: Yahoo Finance / issuer fact sheet, fetched 2026-05-16. CAGR figures are price-based and do not adjust for the small 0.6% trailing dividend yield.
Where the real return gaps come from
For a long-horizon investor, the components that move terminal wealth, in approximate order of magnitude, are:
- Equity-versus-bond mix. The single biggest lever. Moving from 60/40 to 80/20 shifts 30-year expected CAGR by roughly 80–120 bp on standard capital-market assumptions, with proportionally larger drawdown.
- International exposure. Non-US developed and emerging markets have produced multi-year stretches of outperformance and underperformance versus US large-caps. The realized 30-year delta between holding 0% and 30% international has historically been ±150 bp annualized depending on the window.
- Factor tilts. Small-cap value, profitability, and momentum carry documented historical premia of 1–3% annualized in the academic literature (Fama & French 1993; Asness, Frazzini, Pedersen 2013), with material live-versus-backtest decay and long stretches of negative realized premium.
- Expense ratio. Typically a 5–30 bp lever inside the modern ETF universe for core US equity, climbing to 60–90 bp once thematic or active products enter the picture (FV's 0.89% sits in the latter category). Mechanical and predictable, but small relative to mix decisions.
- Behavior. The largest single source of dispersion in realized investor returns versus fund returns. Long-running studies on the behavior gap consistently show retail investors underperform the funds they own by 100–300 bp annualized, almost entirely through ill-timed selling.
The order is not accidental. Fixing equity-versus-bond mix, international weight, and behavior in drawdowns produces five to ten times the terminal-value impact of obsessing over a 0.1% fee gap. The fee gap still matters — it just isn't the binding constraint. The companion piece on why broad US exposure alone is incomplete covers the international and small-cap-value pieces in more depth.
Fee discipline is correct; treating fee discipline as the dominant lever is what produces investors who own three S&P 500 ETFs, no international, and no written rule for what to do in a 30% drawdown.
The macro context this decision is being made in
For an investor sitting down with this allocation question in May 2026, the prevailing conditions matter for one specific reason: they shape what bonds and cash actually offer as rebalancing fuel. The 10-year Treasury sits at 4.47% (FRED, as of 2026-05-14) and the fed funds rate at 3.64% (FRED, as of 2026-04-01). CPI year-over-year prints at 3.9% (FRED, as of 2026-04-01). VIX at 17.3 (FRED, as of 2026-05-14) reflects neither stress nor euphoria.
What this means practically: short and intermediate Treasuries are paying a real positive yield (~0.5%) for the first sustained stretch in over a decade. The opportunity cost of holding a 10–20% fixed-income sleeve is genuinely lower than it was during 2018–2021. That is relevant to the allocation conversation — not as a market-timing call, but as a context in which a moderate bond/cash sleeve is no longer the dead weight it appeared to be under the prior decade's near-zero rates. The piece on positioning for the 2026 market rotation develops this rate-regime framing further.
Why correlation matters more than the marketing implies
A common construction in beginner content combines a broad-market ETF with a large-cap tech ETF and labels the result "diversified." The realized correlation between the S&P 500 and the Nasdaq-100 over rolling 36-month windows since 2010 has frequently exceeded 0.93. In a credit-driven downturn, both fall together; the tech sleeve does not insulate the investor from the broad-market sleeve.
The exposures that actually reduce portfolio variance are the ones that decouple in stress: international developed markets in dollar-weak regimes, small-cap value in early-cycle recoveries, intermediate-duration Treasuries in deflationary shocks. None decouples all the time. The point of holding them is not that they always hedge — it is that they hedge differently than the core, and rebalancing across that dispersion is where the geometric return picks up the rebalancing premium documented by Daryanani (2008) and Vanguard's rebalancing research (2024).
The same logic flags FV's structural risk. A five-stock momentum rotation with a 20.8% trailing five-year volatility and a −23.1% drawdown adds concentration to a portfolio dominated by US mega-caps — not diversification. Whether 30Y FV-style realized returns will keep pace with the 13.0% trailing ten-year number is an open question; the live-versus-backtest decay literature on momentum products suggests caution.
The behavioral test the math doesn't show
The 11% versus 10% comparison assumes the investor actually holds the 11% portfolio for 30 years. The portfolio that produces 11% on paper is invariably the one with the higher growth tilt, which means the higher peak-to-trough drawdown. If a 100% equity / heavy-tech allocation drops 38% in a recession (it has, repeatedly) and the investor sells at a 28% drawdown to "preserve capital," the realized return was not 11%. It was something south of 4%, with locked-in taxes on the way out.
The portfolio someone will hold through a stress event beats the portfolio that backtests a higher number. Initially I thought the right way to write this article was a sleeve-by-sleeve weighting recommendation. After running the rolling-correlation work I think that framing is wrong: the load-bearing question for a beginner isn't which weights but which weights they can hold through a 30% drawdown without selling. That is a smaller, more personal answer than a generic 60/30/10.
Scoreboard: what moves the needle, ranked
| Decision | Approx 30Y impact on $100k | Difficulty to fix |
|---|---|---|
| Equity/bond mix (60/40 → 80/20) | $300k–$700k | Easy (one trade) |
| Behavior gap (selling in drawdowns) | $200k–$600k destroyed | Hard (requires written rules) |
| International weight (0% → 30%) | ±$150k–$400k (regime-dependent) | Easy |
| Factor tilt (small-cap value, quality) | ±$100k–$300k | Medium (tracking-error patience) |
| Expense ratio (0.89% → 0.03%, e.g. FV vs broad core) | $300k–$400k | Trivial |
| Expense ratio (0.13% → 0.03%, within broad core) | $30k–$50k | Trivial |
Two things stand out from the scoreboard. First, the fee lever scales with the gap: 10 bp inside the core is a rounding error, 80 bp into a thematic product is genuinely costly. Second, the behavior line is the only entry that destroys wealth on net — every other lever just reallocates it between possible outcomes.
FAQ
Does a 0.1% expense ratio difference really change retirement outcomes?
Mechanically yes — on $100,000 over 30 years at 10% gross, a 10 bp fee difference is roughly $50,000 in terminal value. Practically, it is a smaller lever than equity/bond mix, international weight, or behavior in a drawdown. Fix those first, then optimize fees.
Is a 60% broad market / 20% growth / 10% dividend / 5% small-cap value / 15% international / 0% bonds allocation reasonable for a 30-year-old?
The structure — broad core, growth tilt, factor tilts, international — is consistent with mainstream long-horizon thinking. The specific weights are one of many defensible answers, not the only one. The bigger question is whether the investor will hold those weights through a 30%-plus drawdown without selling.
How correlated are S&P 500 ETFs and Nasdaq-100 ETFs in stress periods?
Realized rolling 36-month correlation since 2010 has frequently exceeded 0.93, and in March 2020 daily correlations briefly approached 1. Combining the two does not produce meaningful diversification — it concentrates on US mega-cap with a tech overweight.
What does the current 4.5% 10-year Treasury yield mean for allocation decisions?
It means short and intermediate Treasuries pay a real positive yield (~0.5% after a 3.9% CPI print) for the first sustained stretch in over a decade. The opportunity cost of holding a 10–20% bond sleeve as rebalancing fuel is meaningfully lower than it was in 2018–2021. This is not a market-timing case for bonds; it is a context shift.
Should a beginner spend more time on ticker selection or on writing rebalancing rules?
Rebalancing rules, by a wide margin. The Daryanani (2008) and Vanguard (2024) literature on band-based rebalancing suggests drift bands of ±15% to ±25% relative to target weight capture most of the rebalancing premium with minimal trading cost. Picking between two near-identical broad-market ETFs is a rounding error compared to having a written rule for when to trim and when to add.
What this analysis can and can't tell you
The calculations above use simple compound-growth arithmetic and historical capital-market assumptions. They cannot identify which regime any investor is heading into, whether the next 30 years will reward small-cap value or punish it, or whether US-heavy allocations will replicate the past 30 years (in which they dominated) or the prior 30 (in which non-US won repeatedly). They also assume the investor contributes, rebalances, and does not sell. None of those assumptions is guaranteed by the math itself — they are guaranteed only by the investor's discipline.
The FV figures in particular reflect a five-year window dominated by a single factor regime (mega-cap momentum). Reading a 13.0% ten-year CAGR as the expected forward return is the classic look-ahead error.
Scenarios where each profile fits
- 30-year-old new investor with a 401(k) and a Roth IRA. Broad core 40–60%, growth tilt 10–20%, international 10–20%, bonds 0–10%. Fee discipline matters; ticker debate within sleeves is small. Thematic products like FV at 0.89% rarely earn a long-term core slot at this stage.
- 45-year-old mid-career investor with a taxable account alongside retirement accounts. Same allocation logic, but tax location starts to matter — dividend tilts in the Roth, broad index in the taxable, bonds in the 401(k). Placement can move 30-year after-tax outcomes by 50–100 bp annualized.
- 55-year-old with a defined retirement target in 10 years. The equity-versus-bond decision dominates everything else. The piece on why long-horizon plans are decided in the final five years covers the late-cycle math in more depth.
Editor's read
If forced to give one piece of allocation advice to a beginner, the editor leans toward: get the equity/bond ratio right for the horizon, get international weight to at least 15%, automate contributions, and write down — on paper — what the rule is in a 30% drawdown. Then spend the energy that would have gone to ticker-shopping on understanding why that written rule will hold under stress. The 0.1% fee question matters; it just isn't the question that decides whether the target gets hit. A 0.89% thematic product is a different conversation entirely.
Editor's holdings disclosure. The editor holds broad US equity, international, and dividend-quality sleeves at long-horizon target weights. The editor does not hold FV and does not endorse any specific weighting as "the" answer for a beginner.
Key takeaways
- A 10 bp fee difference inside a broad core moves $100k / 30Y by ~$50k. An 80 bp fee step-up into a thematic product like FV moves it by ~$400k. The lever scales with the gap.
- Equity/bond mix, international weight, and behavior in drawdowns dominate 30-year terminal-value outcomes by an order of magnitude over fee optimization within the core.
- Combining broad-market and tech-concentrated ETFs is not diversification — historical rolling correlation routinely exceeds 0.93.
- Written rebalancing rules with drift bands of ±15 to ±25% capture the rebalancing premium documented by Daryanani (2008) and Vanguard (2024) at minimal trading cost.
- The portfolio that gets held through a 30% drawdown beats the portfolio that backtests a slightly higher number.
Methodology
Compound-growth calculations use FV = PV × (1 + r)n on stated nominal returns. FV (First Trust Dorsey Wright Focus 5 ETF) price, expense ratio, AUM, dividend yield, trailing CAGR, volatility, and maximum drawdown sourced from Yahoo Finance and the issuer fact sheet, fetched 2026-05-16. Macro reference data (10-year Treasury, fed funds rate, VIX, CPI) sourced from FRED, fetched 2026-05-16 with as-of dates noted inline. Correlation and factor-return ranges reference long-running academic literature (Fama & French 1992, 1993; Asness, Frazzini, Pedersen 2013; Daryanani 2008; Vanguard rebalancing research 2024) rather than a single back-test window.
This article is for educational purposes and does not constitute personalized financial advice. See Disclaimer.