
Photo by Vitaliy Shevchenko on Unsplash
The short version
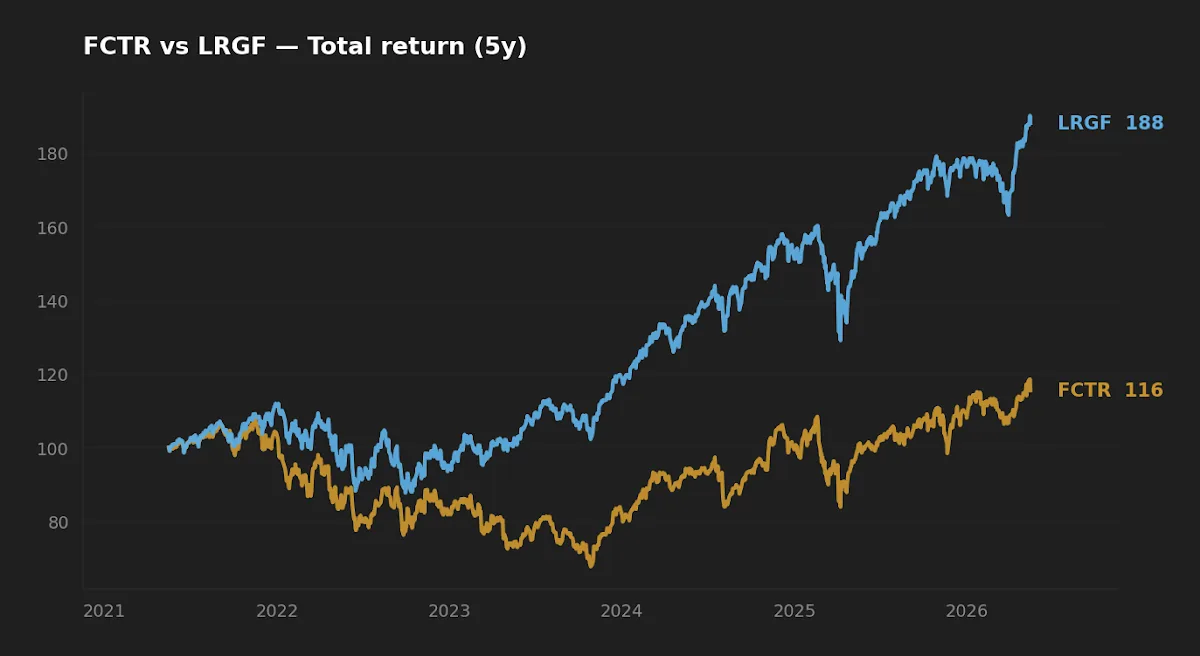
- LRGF has returned 13.5% annualized over the past five years; FCTR has returned 3.0%. A 10.5-percentage-point gap that wide is structural, not noise.
- FCTR's premise — rotate between factor exposures based on relative-strength signals — sounds intuitive, but factor timing has consistently underperformed static factor diversification in both academic and live data.
- For a long-horizon investor wanting multi-factor U.S. equity exposure, LRGF's static blend at 0.08% is the cleaner default. FCTR's 0.65% fee on a tactical rotation that hasn't shown edge is hard to justify on the evidence in hand.
Two funds, both marketed around multi-factor U.S. equity exposure. Over the past five years one annualized 13.5% and the other annualized 3.0%. A cumulative-return gap that large isn't a regime quirk to be explained away — it points at construction. The interesting question is whether FCTR's tactical rotation premise, often grouped with the broader "AI / rules-based factor timing" basket, has any path to closing that gap, or whether the 0.57% fee differential is paying for a structural drag.
Context: what these funds are actually doing
FCTR (First Trust Lunt U.S. Factor Rotation ETF) launched in July 2018. It tracks an index built by Lunt Capital Management that rotates between factor exposures — pairings like high-beta vs low-volatility, or value vs growth — using Point & Figure relative-strength signals. Despite how the category sometimes gets pitched, the rotation rule itself is technical and rules-based, not machine-learned. The construction philosophy is: factors take turns leading, so try to be in the leading factor.
LRGF (iShares U.S. Equity Factor ETF) launched in April 2015. It targets a static blend of four factors — quality, value, momentum, and low size — drawn from MSCI's methodology, with no timing component. The construction philosophy is the opposite of FCTR's: you can't reliably know which factor will lead next year, so hold them all and let the diversification do the work.
Same goal — capture the factor premia documented in the Fama-French and successor literature. Opposite implementation philosophy.
The data
| Metric | FCTR | LRGF |
|---|---|---|
| Expense ratio | 0.65% | 0.08% |
| AUM | $53M | $3.26B |
| Inception | 2018-07-25 | 2015-04-28 |
| Distribution yield (TTM) | 0.4% | 1.1% |
| 5Y CAGR | 3.0% | 13.5% |
| 10Y CAGR | n/a (post-2018) | 13.8% |
| 5Y annualized volatility | 19.5% | 17.1% |
| 5Y max drawdown | −37.1% | −21.6% |
Sources: yfinance for price and total-return series (pulled 2026-05-16); First Trust FCTR fact sheet; iShares LRGF fact sheet. CAGR and volatility computed from daily total returns ending 2026-05-15.
Construction: rotation vs static blend
The clean way to think about the difference is whether the fund is timing factors or diversifying across factors.
FCTR's index rotates among Lunt's factor sub-portfolios based on relative-strength signals. In practical terms, the fund is at any given time mostly exposed to one or two factors that have been outperforming recently — momentum-of-factors, essentially. The implicit bet is that factor leadership trends persist long enough to be captured net of trading costs and signal lag.
LRGF makes no such bet. Its index targets constant exposure to quality, value, momentum, and low size simultaneously, rebalancing back toward those targets. When one factor goes through a drawdown, the others are sized to cushion it; when one rips, the fund takes profits via rebalancing rather than chasing.
The academic literature on factor timing is unkind to the FCTR premise. Asness, Ilmanen and Maloney (2017) — and a string of follow-up work — repeatedly find that ex-ante factor timing, especially via recent-performance or relative-strength signals, produces no reliable improvement over static multi-factor exposure once costs and signal lag are included. The reason isn't subtle: factor leadership reverses at unpredictable horizons, and trend-following signals are typically too slow to ride the trend without buying the top of it.
The 5Y return gap: regime, timing, or selection?
A 10.5-percentage-point annualized gap is enormous. Compounded over five years, $10,000 in LRGF became roughly $18,800; the same $10,000 in FCTR became roughly $11,600. That is a 62-percentage-point cumulative spread.
A 62-percentage-point cumulative gap over five years is too large to attribute to bad luck; it has to be construction.
The gap decomposes, very roughly, like this. About 0.6pp/yr is the headline fee differential. Another ~0.7pp/yr is distribution-yield differential, because LRGF holds a more income-generating book. The remaining ~9pp/yr is structural attribution: position. The most plausible reading is that FCTR's rotation rule was in low-volatility / high-quality factors during parts of the 2020-2021 growth rally, missed the rotation back to value in 2022, and never consistently positioned for the post-2022 quality-and-momentum regime that LRGF's static blend captured by default.
This is the live-data version of an old academic point: factor-timing models often look great in backtest because they have hindsight on regime breaks. In live trading, the regime change announces itself only after the rotation rule has already taken the wrong side.
Realized risk and drawdown profile
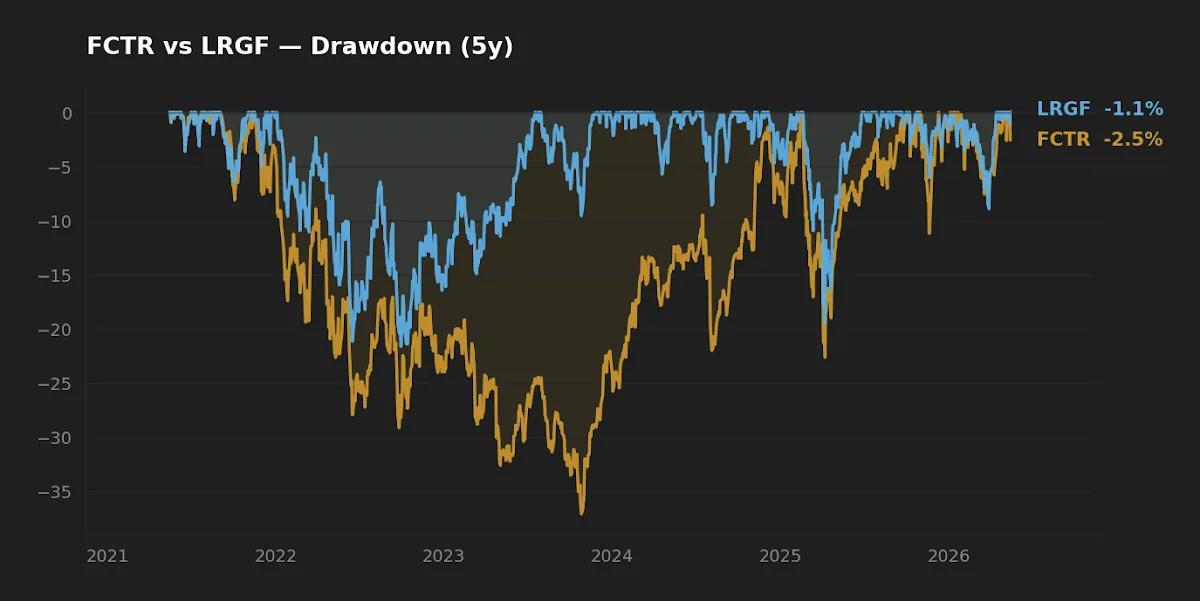
The risk side is no kinder to FCTR. Its 5Y annualized volatility (19.5%) is meaningfully higher than LRGF's (17.1%), and its max drawdown (−37.1%) was about 15 percentage points deeper than LRGF's (−21.6%). A fund taking concentrated tactical bets should show higher dispersion than a diversified blend — that's the trade. But the deal an investor implicitly accepts when paying 0.65% for tactical rotation is that the higher volatility produces a return premium. Over this 5-year window it produced the opposite: more risk, less return.
The drawdown shape is also instructive. LRGF's worst drawdown clusters around the 2022 broad-market repricing — the kind of macro-driven drawdown every diversified U.S. equity fund took. FCTR's deeper drawdown adds a second layer on top: the loss from being on the wrong side of factor rotation during a regime change, compounded with the market drawdown.
Cost, capacity, and what the AUM gap signals
FCTR's $53M AUM versus LRGF's $3.26B is not just a vanity metric. A few practical concerns follow from the size gap:
- Closure risk. Sub-$100M factor ETFs that haven't gathered assets after roughly seven years of live track record sometimes get rationalized away by the issuer. It doesn't mean FCTR will close, but it is a real consideration for a buy-and-hold sleeve where forced liquidation would create unwanted tax events.
- Bid-ask spread. Lower-AUM ETFs typically carry wider intraday spreads. For a long-horizon investor making infrequent trades this isn't the primary concern, but it raises the all-in cost beyond the headline expense ratio.
- Fee asymmetry. Paying 0.65%/yr for a tactical premise that hasn't demonstrated edge against a 0.08% static alternative is hard to justify on prior-evidence grounds. The burden of proof sits with the more expensive product.
For comparison context, related multi-factor or AI-labeled ETFs covered elsewhere include QRFT and AMOM — different construction stories, same question about whether an algorithmic or rotation overlay produces real edge net of the fee it charges.
At-a-glance scoreboard
| Category | Winner | Margin |
|---|---|---|
| Cost | LRGF | Material — 57 bp |
| Realized risk (5Y vol & DD) | LRGF | Material |
| Realized return (5Y CAGR) | LRGF | Large — 10.5pp/yr |
| Track-record length | LRGF | ~3 years |
| Scale / closure risk | LRGF | Material |
| Suitability for long-term core | LRGF | Strong |
FAQ
Is FCTR an "AI" ETF?
FCTR is sometimes grouped with rules-based factor-rotation products in lists labeled "AI" or "smart beta." The underlying index uses Point & Figure relative-strength signals — a technical, rules-based methodology rather than a machine-learning model. Treat the AI labeling as marketing positioning, not a description of the construction.
Has factor timing ever worked in live data?
The academic record on factor timing is unkind. Asness, Ilmanen and Maloney (2017) and follow-ups generally find that ex-ante factor timing produces little to no improvement over static multi-factor exposure once trading costs and signal lag are included. There are individual managers with positive records, but the base rate for rules-based rotation outperforming static blends is poor.
Why is LRGF's expense ratio so much lower?
LRGF runs a static multi-factor index from MSCI with relatively low turnover. FCTR runs a tactical rotation index with higher turnover and a more bespoke construction methodology. The fee differential reflects both the complexity premium that issuers charge for active-flavored products and iShares' scale advantage. Whether the complexity is worth paying for is the question the live track record has been answering.
Could FCTR's regime simply have been unfavorable?
Partially, yes. A rotation rule will struggle when factor leadership flips faster than the signal can adapt. But the live window includes growth-led (2020-2021), value-led (2022), and quality/momentum-led (2023-2025) regimes — most rotation rules should have caught at least one of those cleanly. FCTR didn't.
What would change a long-term investor's mind about FCTR?
A multi-year stretch in which FCTR's rotation rule cleanly anticipated a factor regime change ahead of the index — exiting growth-quality before the 2022 repricing, for instance, or pivoting into momentum in time for the 2023 rally — and produced a return that justified the fee. Five years of live data showing the opposite is a meaningful prior; reversing it requires comparable evidence.
What this comparison can and can't tell you
The 5-year window covers the COVID growth rally, the 2022 rate-driven repricing, and the 2023-2025 AI / quality regime. That is a reasonable spread of factor environments — but it is still one window, drawn from one macro cycle. We don't have FCTR live data through a sustained value-led regime like 2000-2007, and we don't have either fund through a credit-driven recession. The current macro backdrop (10Y Treasury at 4.5%, VIX around 17, CPI YoY near 3.9% — FRED, asof 2026-05-14) is itself not regime-neutral; a different rate path could change factor leadership again.
What the data can't tell us: whether FCTR's rotation rule could be improved by a different signal, whether a future regime change will favor it, or whether LRGF's static blend will continue to capture factor premia at current levels. Live-versus-backtest performance for factor products has historically degraded, and that risk applies to LRGF too — just at a much lower fee.
Scenarios where each fund fits
- Long-horizon investor wanting a multi-factor U.S. equity sleeve at low cost: LRGF is the cleaner default. Static blend, 0.08% fee, 11 years of live data including the 2022 stress test, and scale that mitigates closure risk.
- Investor specifically wanting to express a tactical-rotation thesis: FCTR is one of the few ETFs that wraps it in a rules-based single fund. But the burden of proof for paying 0.65% on a thesis the live data hasn't validated sits with the investor, not the fund.
- Investor already holding a broad market index (VOO, VTI, ITOT): Adding LRGF as a satellite factor tilt is more defensible than adding FCTR. The marginal information from the factor blend is additive; the marginal information from a tactical rotation overlay has not shown itself.
- Investor in a taxable account: LRGF's lower turnover and lower expense ratio also tend to produce lower tax drag than a higher-turnover rotation product. Both are reasonably efficient compared to active mutual funds, but the static blend is the easier defense at year-end.
Editor's read
The interesting thing about this comparison is how clean it is. Most ETF head-to-heads end with "it depends on your situation." This one mostly doesn't. LRGF wins on cost, return, risk, scale, and track-record length — and its construction is consistent with the published evidence that factor diversification has reliably outperformed factor timing. If forced to pick one for a long-term factor sleeve, the editor leans firmly toward LRGF. The case for FCTR exists only if an investor has strong prior conviction that the next regime will be unusually friendly to relative-strength rotation — and at that point the harder question is why pay 0.65% to express that view rather than rotating sleeves directly.
Key takeaways
- FCTR and LRGF share a goal (multi-factor U.S. equity) and disagree on method (rotation vs static blend). The method matters more than the marketing.
- Over five years LRGF has beaten FCTR by 10.5pp/yr with lower volatility and a 15pp-shallower drawdown. The gap is too large to be regime noise.
- The academic literature on factor timing is consistent with the live result: static factor diversification has historically beaten ex-ante factor rotation net of costs.
- FCTR's $53M AUM, six-year live history, and 0.65% fee combine into a meaningful asymmetric risk — fee-and-closure risk on one side, no demonstrated alpha on the other.
- For a long-term core multi-factor sleeve, the evidence currently points to LRGF as the more defensible default.
The editor does not hold either fund at the time of writing.
Methodology
Total return, volatility, and drawdown computed from daily adjusted-close data via yfinance, pulled 2026-05-16 for the window ending 2026-05-15. CAGR uses geometric annualization on daily total-return series; volatility is the annualized standard deviation of daily log returns; max drawdown is peak-to-trough on the cumulative total-return curve. Expense ratios, AUM, distribution yield, and inception dates were cross-checked against the First Trust FCTR and iShares LRGF fact sheets. Macro context (10Y Treasury, VIX, CPI YoY) from FRED, asof 2026-04-01 / 2026-05-14. The 5-year window covers a meaningful spread of factor regimes but represents one macro cycle; longer-horizon comparison would require LRGF's pre-2020 history alone, since FCTR has roughly six years of live data.
This article is for educational purposes and does not constitute personalized financial advice. See full Disclaimer.