
Photo by Fontis AG on Unsplash
The short version
- Over the trailing five years, VTI did the heavy lifting (12.3% CAGR), VXUS lagged (7.9%), and BND delivered almost nothing (0.1%) — yet that spread is the point of the structure, not a flaw in it.
- BND's near-zero five-year return makes the bond sleeve look like dead weight on a return basis, but its 6.0% volatility against equity's ~17% is exactly the job it was hired to do.
- Bottom line: the three-fund portfolio is a decision about behavior under stress and cost discipline, not a bet on which sleeve wins a given five years.
The three-fund portfolio — total US market, total international market, total bond market — is the most widely recommended self-directed allocation in existence, and also one of the least scrutinized after the fact. The recommendation gets repeated; the realized numbers rarely get checked. This article does the second part. Using price and distribution data pulled from yfinance on 2026-06-08, with expense ratios and AUM taken from Vanguard issuer fact sheets, it asks a narrow question: over the trailing five and ten years, what did VTI, VXUS, and BND actually deliver, and what does that tell a long-horizon investor about why the structure is built the way it is?
Context: what the three funds are supposed to do
The logic of a three-fund portfolio is division of labor, not three independent return bets. VTI holds essentially the entire US equity market, roughly 3,600 names, and is meant to be the primary growth engine of the portfolio. VXUS holds developed and emerging markets outside the US and exists to diversify the single-country risk that a US-only equity sleeve quietly concentrates. BND holds investment-grade US bonds and is there to dampen volatility and shorten drawdown recovery, not to compound aggressively.
That framing matters because the three sleeves are graded on different exams. Judging BND by its return is like judging a seatbelt by how fast it makes the car. The numbers below only mean something once you hold each fund to its own job.
The data: five and ten years, as realized
| Fund | Expense ratio | AUM | Yield | 5Y CAGR | 10Y CAGR | 5Y volatility | 5Y max drawdown |
|---|---|---|---|---|---|---|---|
| VTI | 0.03% | $2,308.9B | 1.0% | 12.3% | 14.8% | 17.4% | -25.4% |
| VXUS | 0.05% | $652.3B | 2.7% | 7.9% | 9.6% | 16.1% | -29.4% |
| BND | 0.03% | $394.4B | 3.9% | 0.1% | 1.7% | 6.0% | -17.9% |
Source: yfinance price and distribution data, fetched 2026-06-08; expense ratio, AUM, and inception from Vanguard fund fact sheets (VTI inception 2000-11-13, VXUS 2011-01-26 as the ETF share class, BND 2007-04-03). CAGR, volatility, and drawdown are computed from total-return price series over the trailing windows ending June 2026.
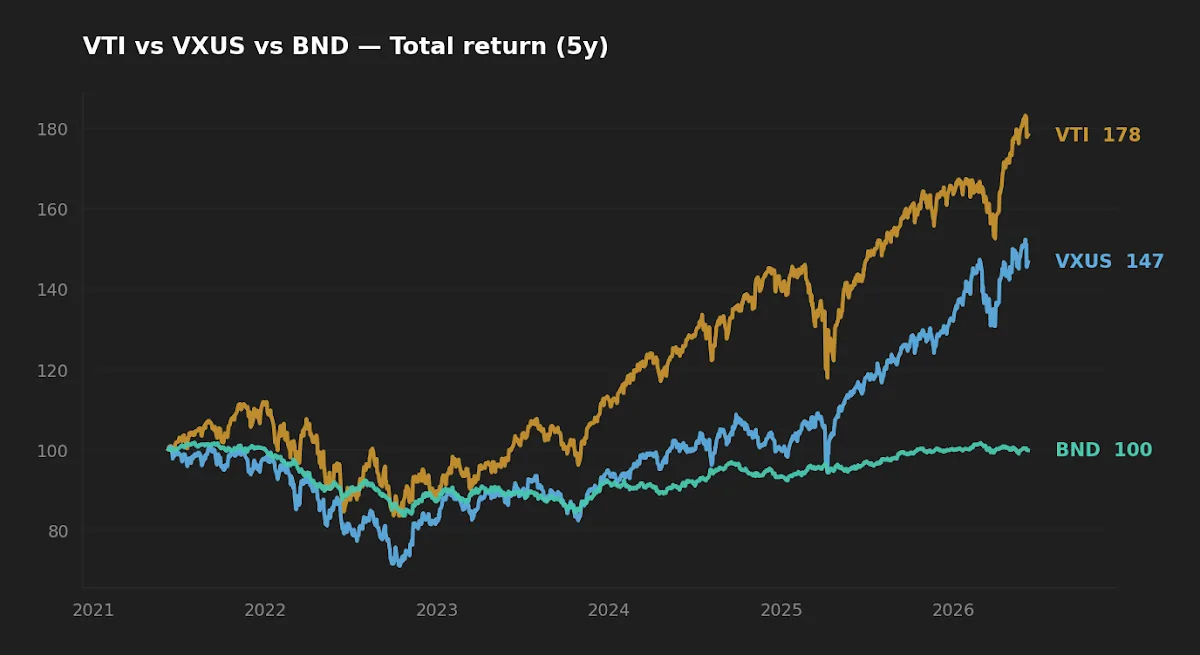
The normalized chart above makes the dispersion plain: a dollar in VTI compounded faster than the same dollar in VXUS, and a dollar in BND barely moved. The instinct is to read that as "VTI won." The more useful reading is that the three lines did not move together — and non-correlation, not any single line's slope, is what a multi-asset structure is buying.
Why BND's flat line is the feature, not the bug
BND returned 0.1% annualized over five years and 1.7% over ten. In isolation that is a poor result, and it has an obvious cause: the five-year window opened near the end of a zero-rate era and ran straight through the fastest hiking cycle in four decades. Bond prices fall when yields rise, and BND's -17.9% drawdown is the visible scar of that repricing. The Federal Reserve's policy rate sat at 3.63% as of 2026-05-01 (FRED), a different world from where the window began.
Here is the non-obvious part. The same repricing that gutted BND's trailing return also reset its forward role. A bond fund yielding 3.9% today carries a coupon cushion that a 1.5%-yielding BND in 2021 simply did not have — meaning the asset most investors are tempted to abandon after five flat years is structurally better positioned to do its dampening job than it was when everyone was happy to hold it. The trailing CAGR describes the regime that just ended; the current yield describes the one starting. Performance-chasing reads the first number and acts as if it were the second.
And the dampening itself shows up clearly in the dispersion of risk: BND's 6.0% volatility is roughly a third of VTI's 17.4%. In a blended portfolio, that low-volatility sleeve is what lets a disciplined investor hold the equity sleeves through a drawdown instead of selling at the bottom. The return you never see in BND's CAGR is the behavioral return it enables elsewhere.
The asset most investors are tempted to abandon after five flat years is structurally better positioned to do its dampening job than it was when everyone was happy to hold it.
The realized-risk picture across all three sleeves
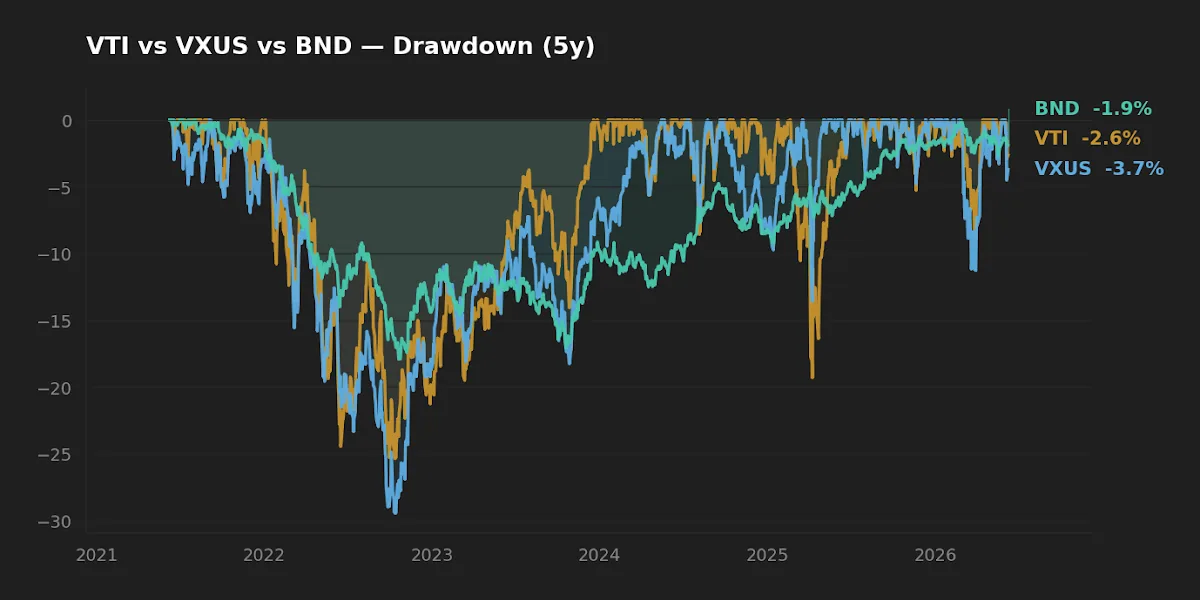
Drawdown depth tells one story; drawdown duration tells a quieter one. VTI's worst five-year drawdown was -25.4%, VXUS's was -29.4%, and BND's was -17.9%. On depth alone the ranking is unsurprising — international equity carried both currency and concentration risk into its worst stretch. But notice that BND, the "safe" asset, still drew down 17.9%. Investment-grade bonds are not riskless; they are differently risky, exposed to duration rather than to corporate earnings. An investor who held BND expecting it to be flat-to-up in all conditions met the 2022–2023 rate shock unprepared. That is exactly the kind of single-regime assumption the academic literature on diversification warns against: the correlation between stocks and bonds is not a constant, and in an inflation shock it can flip positive, so both sleeves fall together.
VXUS deserves a second look here too. Its 2.7% yield is roughly double VTI's 1.0%, and the temptation is to read that as international equity being "more generous." It is mostly composition. International indices carry heavier weightings in value-oriented, dividend-paying sectors — banks, energy, industrials — than the US market, which is tilted toward lower-payout technology. The higher yield is a factor-exposure artifact, and it comes with a tax wrinkle: foreign dividends are more often non-qualified and taxed at ordinary rates, partially offset by the foreign tax credit when VXUS is held in a taxable account. The headline yield is not free money; it is a different tax and factor profile wearing a friendly number. I had initially filed VXUS's yield under "income advantage" until the qualified-versus-ordinary split made clear it was closer to a wash after tax.
What this means for weighting the three sleeves
None of this argues for a particular split. It argues for choosing the split on purpose. A reader whose entire portfolio is VTI is holding a 100% equity, single-country position — the five-year return was excellent, but the -25.4% drawdown is the price of admission, and there is no dampening sleeve to make holding through it easier. Adding BND lowers expected return and lowers volatility; adding VXUS trades some US concentration for currency and single-region exposure. These are deliberate trades, and the right ones depend on horizon, cash-flow needs, and — most of all — how a given investor actually behaves when an account is down a quarter of its value. For readers weighing the international sleeve specifically, the trade-offs are worth examining on their own terms, as is the recovery math behind a deep drawdown before sizing the equity exposure.
Rebalancing is where the structure earns its keep. When the sleeves diverge as sharply as they did over this window, periodic rebalancing within tolerance bands mechanically trims the winner and adds to the laggard — selling some VTI to buy BND near its low. That is uncomfortable precisely because it runs against the recent return ranking, which is the behavioral reason it tends to work.
FAQ
Is the three-fund portfolio still relevant in 2026? The realized data doesn't argue against it. The structure's purpose — broad ownership at minimal cost with a volatility-dampening sleeve — is unchanged by any single five-year regime. What changed is the starting yield on the bond sleeve, which is higher now than at the window's open.
Why did BND do so badly, and should I drop it? BND's near-zero five-year return reflects the 2022–2023 rate-hiking cycle repricing bonds downward. Dropping an asset after its worst regime, when its forward yield is at a multi-year high, is the classic performance-chasing error. Whether you hold it depends on your need for volatility reduction, not on its trailing CAGR.
Do I need VXUS if VTI already returned more? "Returned more over this window" is a look-ahead framing — you didn't know that five years ago. VXUS exists to diversify the single-country risk embedded in a US-only equity sleeve. Whether that diversification is worth the realized return gap is a judgment about how confident you are in continued US outperformance, which the data cannot settle.
What weights should I use? This article deliberately doesn't prescribe weights, because the right split depends on your horizon, income needs, and behavior under drawdown. The data here is meant to inform that choice, not make it.
Is VXUS's higher yield a reason to prefer it for income? Mostly no. The 2.7% yield is largely a composition effect — international indices tilt toward value and dividend-paying sectors. A meaningful share of those dividends are non-qualified and taxed at ordinary rates, so the after-tax advantage is smaller than the headline suggests.
Key takeaways
- Over the trailing five years VTI returned 12.3%, VXUS 7.9%, and BND 0.1% annualized — wide dispersion that reflects three different jobs, not three competing bets (yfinance, fetched 2026-06-08).
- BND's flat return is regime-specific; its current 3.9% yield and 6.0% volatility make it better-positioned for its dampening role now than at the window's start.
- BND's -17.9% drawdown is a reminder that investment-grade bonds carry duration risk, and stock-bond correlation can turn positive in an inflation shock.
- VXUS's higher yield is mostly a value-tilt composition artifact with an ordinary-income tax profile, not a free income premium.
- The structure's payoff is non-correlation plus rebalancing discipline — choosing weights deliberately matters more than which sleeve led any given five years.
This article is for educational purposes and does not constitute personalized financial advice. See the full Disclaimer.
Methodology: price, total return, yield, volatility, and drawdown computed from yfinance data fetched 2026-06-08; expense ratio, AUM, and inception from Vanguard issuer fact sheets; policy rate and CPI from FRED (Fed funds 3.63% asof 2026-05-01; CPI 3.9% YoY asof 2026-04-01). Windows analyzed: trailing 5Y and 10Y ending June 2026.