
Photo by Towfiqu barbhuiya on Unsplash
The short version
- VYM and SCHD both market themselves as dividend funds, but they are built on different screens — VYM ranks the broad market by forward yield; SCHD filters for balance-sheet quality and dividend-growth consistency first.
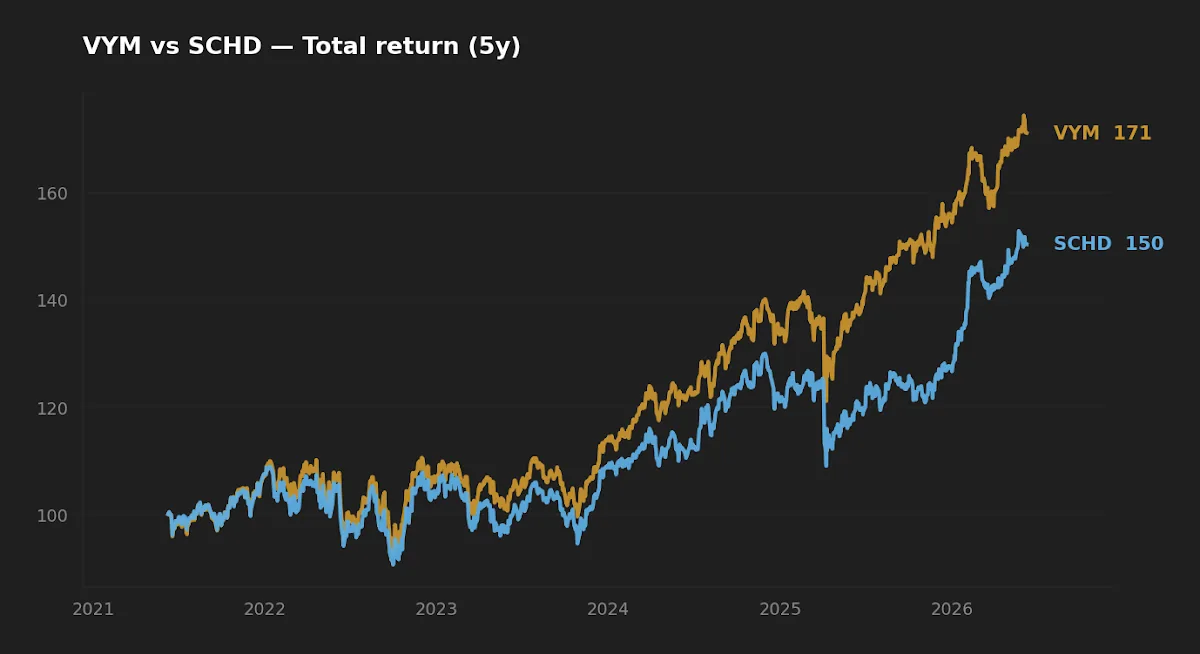
- Over the trailing five years VYM outpaced SCHD on total return (11.3% vs 8.4% CAGR), yet over ten years SCHD edges ahead (12.8% vs 11.8%) — a clean example of single-regime risk in the data.
- Bottom line: VYM is the broader, cheaper, more market-like high-yield basket; SCHD is a narrower quality-tilt bet whose recent lag reflects style headwinds, not a broken methodology.
The question underneath "VYM vs SCHD" is not which fund pays more income today — it is which definition of "dividend investing" you actually want to own for the next two decades. One ranks the U.S. market by how much it currently yields. The other screens for the financial health and consistency that tend to keep dividends growing. Those are two different bets, and the trailing data tells two different stories depending on the window you pick.
Context: two screens that share a label
The Vanguard High Dividend Yield ETF (VYM) tracks the FTSE High Dividend Yield Index. The construction is almost mechanical: take U.S. dividend-paying stocks, rank them by forecast dividend yield, take roughly the higher-yielding half, and weight by market cap. The result is broad — several hundred holdings — and tilts toward sectors that structurally carry higher yields: financials, consumer staples, energy, healthcare.
The Schwab U.S. Dividend Equity ETF (SCHD) tracks the Dow Jones U.S. Dividend 100 Index. Yield is a screen, not the screen. A company first has to clear a minimum dividend-payment history, then pass quality filters — cash-flow-to-debt, return on equity, dividend growth rate, and yield — before roughly 100 names make the cut. The basket is narrower and more concentrated by design, and the methodology rebalances annually to re-impose those quality gates.
So the labels collide but the engines differ. VYM asks "who pays a lot relative to price?" SCHD asks "who has paid reliably, can keep paying, and yields reasonably while doing it?" Everything downstream — sector exposure, drawdown behavior, how each fund handles a regime shift — flows from that distinction.
The data side by side
All return, volatility, and drawdown figures below are computed from adjusted daily prices via yfinance (fetched 2026-06-08). Expense ratio, AUM, and inception come from each issuer's fact sheet (Vanguard VYM profile; Schwab SCHD profile).
| Metric | VYM | SCHD |
|---|---|---|
| Expense ratio | 0.04% | 0.06% |
| AUM | $96.1B | $94.9B |
| Distribution yield | 2.2% | 3.3% |
| Inception (fund) | 2006 | 2011 |
| NAV (2026-06-08) | $158.16 | $32.29 |
| 5Y CAGR | 11.3% | 8.4% |
| 10Y CAGR | 11.8% | 12.8% |
| 5Y volatility (annualized) | 14.0% | 14.4% |
| Max drawdown (5Y) | -15.8% | -16.8% |
Yield is not return — and right now both lag cash
The first thing the table contradicts is the intuition that the higher-yielding fund delivers the higher payoff. SCHD yields more than a full point above VYM (3.3% vs 2.2%), yet VYM delivered the higher five-year total return by a wide margin. Distribution yield tells you how the return is packaged, not how large it is. A 3.3% yield with 8.4% total return means roughly 5 points came from price appreciation; a 2.2% yield with 11.3% total return means roughly 9 points did.
There is also a macro frame worth sitting with. The federal funds rate stood at 3.63% (FRED, asof 2026-05-01) and CPI ran at 3.9% year over year (FRED, asof 2026-04-01). Both dividend funds currently yield below the cash rate. That does not make them inferior — their case rests on total return and dividend growth over a long horizon, not on out-yielding a T-bill this quarter — but it does reframe the income pitch. An investor buying either fund purely for "income above cash" is not getting it today; what they are buying is a growing claim on corporate cash flows that, historically, compounds well across cycles. On a pure-yield basis, with inflation near 3.9%, the real income from either fund is slim. The work is in the total-return column.
SCHD yields more than a full point above VYM yet trailed it badly over five years — the cleanest reminder available that distribution yield describes the wrapper, not the size of the gift.
The five-year vs ten-year split is the whole story
Here is the non-obvious part. Flip between windows and the "winner" flips with it. Over five years VYM leads SCHD by nearly three points of annualized return; over ten years SCHD leads VYM by a point. Same two funds, opposite conclusions.
The explanation is regime, not skill. SCHD's quality-and-value screen tilts it away from the highest-multiple megacaps that drove much of the last five years' market return. When the market is led from the top by a handful of large-growth names, a value-leaning dividend-quality fund structurally lags — that is the screen working as designed, not failing. VYM, weighted by market cap across a broader high-yield universe, carried more of that drift. Extend the window to ten years, which includes a stretch where quality and value were better rewarded, and SCHD's methodology reasserts itself.
Initially I read SCHD's five-year lag as a warning sign. Then I lined the two CAGR windows up against each other and the story changed: this is single-regime risk showing through a short sample, not a deterioration in the underlying rules. Whichever fund you prefer, the honest takeaway is that five years is too short a window to crown a methodology. Readers who want the longer-horizon framing of this same tension may find the yield-vs-growth question piece useful, and the SCHD vs VOO total-return analysis sharpens the same point against the broad market.
Realized risk: nearly identical, slightly in VYM's favor
For two funds with different construction philosophies, the realized risk profiles are strikingly close. Five-year annualized volatility was 14.0% for VYM and 14.4% for SCHD; maximum drawdown over the same window was -15.8% for VYM and -16.8% for SCHD. SCHD's heavier concentration (roughly 100 names vs several hundred) shows up as marginally deeper drawdown and slightly higher volatility, but the gap is small enough that neither fund can be called the "defensive" choice on this evidence alone.
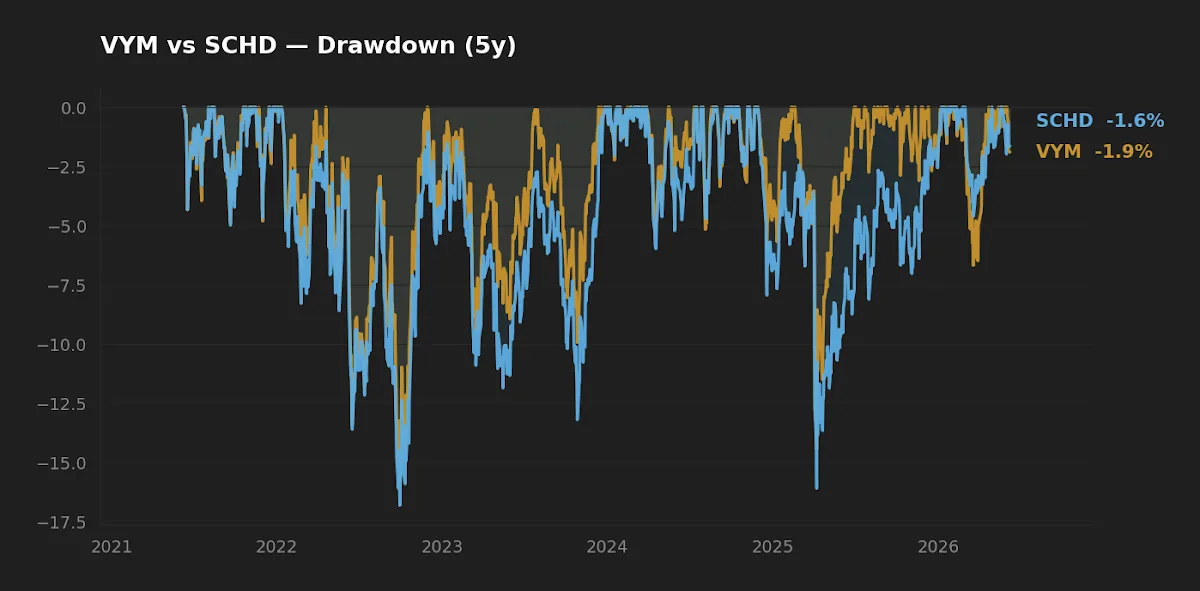
What the drawdown chart shows that the single max-drawdown number hides is the shape of recovery — how long each fund spent underwater, not just how deep it went. That duration matters more than depth for an investor who may need to sell during a stress window. Both funds recovered, but the path is the part of risk that a single statistic flattens.
Cost, scale, and the friction that compounds
On headline cost the funds are close: VYM at 0.04% and SCHD at 0.06%, a 0.02% gap. Over decades that 2-basis-point difference is real but small — far smaller than the style-driven return gaps above, which is the right way to keep it in perspective. Both funds are enormous (VYM $96.1B, SCHD $94.9B), so bid-ask spreads are tight, closure risk is negligible, and capacity is not a concern for any individual investor.
The friction that deserves more attention is tax. Both funds distribute meaningful income, and that income lands in a taxable account every quarter whether or not you want it. SCHD's higher yield means a larger taxable distribution for the same dollar invested — relevant if either fund sits outside a tax-advantaged account. The qualified-vs-ordinary split on those distributions affects the after-tax result, and on that axis the higher-yielding fund carries the higher annual tax drag in a taxable sleeve. For a tax-deferred account the point is moot. For investors weighing quality-tilt alternatives, the SCHD vs VIG factor analysis and the DIVZ vs SCHD vs NOBL comparison extend the same quality-dividend question across more funds.
Scoreboard: winner by category
| Category | Edge | Why |
|---|---|---|
| Cost | VYM (slight) | 0.04% vs 0.06% — a 0.02% gap, marginal over decades |
| Realized risk (5Y) | VYM (slight) | Lower volatility (14.0% vs 14.4%) and shallower max drawdown |
| Realized return | Window-dependent | VYM wins 5Y (11.3% vs 8.4%); SCHD wins 10Y (12.8% vs 11.8%) |
| Current income | SCHD | 3.3% vs 2.2% distribution yield |
| Suitability | Depends on goal | VYM for broad market-like exposure; SCHD for a deliberate quality tilt |
FAQ
Is SCHD better than VYM? The data does not support a single answer. SCHD led on ten-year total return and current yield; VYM led on five-year return, cost, and realized risk. "Better" depends on which window and which objective you weight.
Why did SCHD underperform VYM over five years if it screens for quality? SCHD's value-and-quality tilt steered it away from the large-growth names that drove much of the recent market return. That is the screen behaving as designed during a growth-led regime, not the methodology failing. Over ten years, which includes a more quality-friendly stretch, SCHD pulled ahead.
Which fund pays more income? SCHD, at a 3.3% distribution yield versus VYM's 2.2% (yfinance, 2026-06-08). Note both currently yield below the 3.63% federal funds rate (FRED, 2026-05-01).
Can I hold both VYM and SCHD? They overlap meaningfully in large-cap dividend payers, so owning both adds less diversification than the different labels suggest. The overlap is in the names both screens select; combining them mostly dilutes whichever tilt you were trying to express.
Are these funds tax-efficient? Both distribute taxable income quarterly. In a taxable account, SCHD's higher yield produces a larger annual distribution and therefore higher tax drag for the same investment; in a tax-advantaged account the distinction disappears.
What this comparison can and can't tell you
The return figures rest on five- and ten-year trailing windows. Five years is a single market regime — growth-led, low-rate for much of it — and is too short to validate any factor strategy. Ten years captures more, but still excludes the deeper, longer bear markets that test dividend durability. Neither window stress-tests the funds across a full rate cycle or a prolonged recession with dividend cuts. These are realized, backward-looking numbers; they carry the usual look-ahead and single-regime caveats and say nothing certain about forward returns.
Scenarios where each fund fits
Reader in their 30s, 401(k)-only, wants one broad dividend sleeve without a strong style view: VYM's wider, cheaper, more market-like basket is the simpler default. Reader who specifically wants a value-and-quality tilt and a higher current yield, and holds it in a tax-advantaged account: SCHD expresses that tilt deliberately. Reader in a taxable account focused on minimizing annual tax drag: VYM's lower yield is the lighter-tax option, though a total-market or growth fund would be lighter still.
Editor's read
If forced to hold one in a long-horizon core sleeve, the editor leans slightly toward SCHD — but only on the strength of the ten-year record and the discipline of its quality screen, and only inside a tax-advantaged account. The five-year lag is a regime artifact, not a defect, and a methodology that survives a full cycle is worth more than one that wins a single style window. VYM remains the more sensible choice for a reader who wants broad, cheap, low-friction dividend exposure without taking a deliberate factor view. The honest position is that this is a preference with a stated reason, not a verdict the data forces.
Disclosure: The editor holds SCHD; does not hold VYM at the time of writing.
Key takeaways
- VYM ranks the broad market by yield; SCHD screens for quality first — same label, different engines.
- VYM won the five-year total-return window (11.3% vs 8.4%); SCHD won the ten-year window (12.8% vs 11.8%). The flip is regime, not skill.
- Higher yield ≠ higher return: SCHD yields 3.3% to VYM's 2.2% but trailed on five-year total return.
- Realized risk is nearly identical, with a marginal edge to VYM on volatility and drawdown.
- Both currently yield below cash (3.63% fed funds), so the case for either rests on long-horizon total return, not present income.
Methodology: Return, volatility, and drawdown computed from adjusted daily closing prices via yfinance, data pulled 2026-06-08, over trailing 5-year and 10-year windows. Expense ratio, AUM, distribution yield, and inception from issuer fact sheets (Vanguard, Schwab). Macro figures from FRED: federal funds rate asof 2026-05-01, CPI year-over-year asof 2026-04-01.
This article is for educational purposes and does not constitute personalized financial advice. See our full Disclaimer.