Photo by Markus Spiske on Unsplash
The short version
- USMV (optimizer-based minimum variance) and SPLV (simple lowest-volatility ranking) sound similar but are built differently — and the construction gap, not the fee gap, drives the divergence.
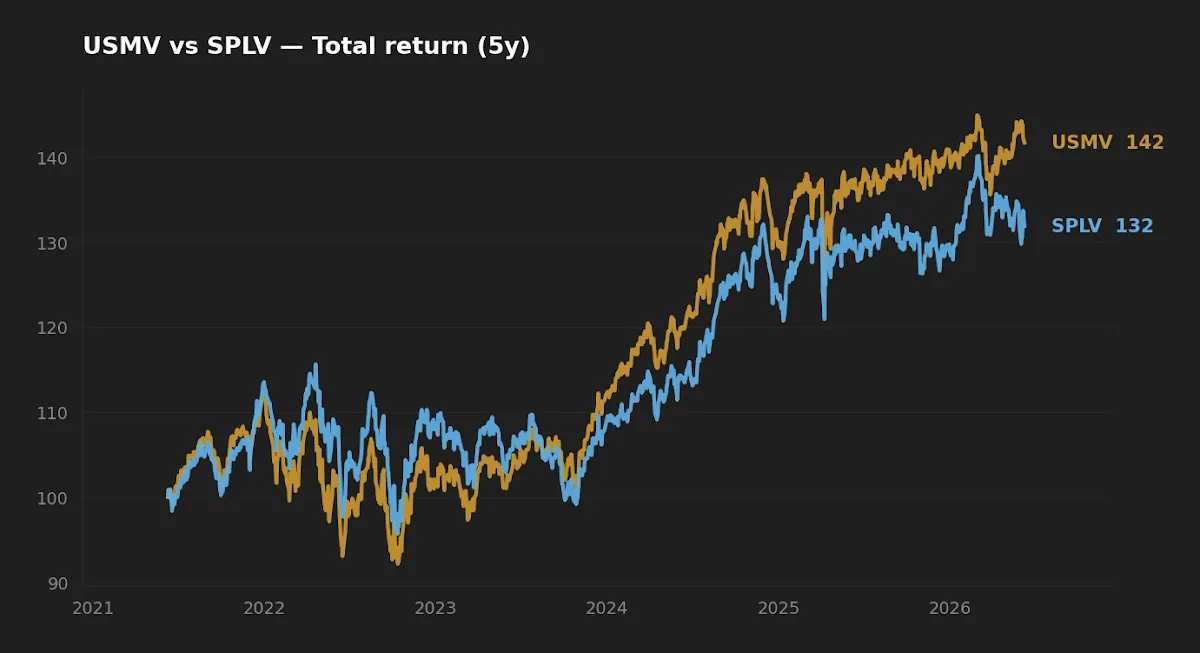
- Over the trailing five years their realized volatility was nearly identical (12.3% vs 12.5%), yet USMV returned more per year — the "more defensive" label did not translate into a smoother ride.
- Bottom line: USMV suits a constrained, broad-market low-vol core; SPLV is the more concentrated, more rate-sensitive expression that earns its keep mainly when bond-proxy sectors lead.
Two funds promise the same thing — lower volatility than the broad U.S. market — and they have delivered almost exactly the same realized volatility over the past five years. So why has one returned meaningfully more than the other? The answer is in how each one defines "low volatility," and it matters more than the headline label suggests.
This comparison looks at the iShares MSCI USA Min Vol Factor ETF (USMV) against the Invesco S&P 500 Low Volatility ETF (SPLV): what each actually holds, how the two approaches behaved across a rate-shock cycle, and where the realized data stops being able to tell us anything useful.
Context: two different definitions of "calm"
Both funds launched in 2011 and both aim to reduce portfolio variance relative to U.S. large caps. The mechanics diverge sharply.
SPLV takes the S&P 500, ranks every constituent by trailing one-year realized volatility, and holds the 100 calmest names, weighted by the inverse of their volatility. It rebalances quarterly. There are no sector constraints — if utilities and consumer staples happen to be the quietest corner of the market, SPLV will pile into them. It is a transparent, single-variable rule.
USMV runs an optimizer instead. It uses MSCI's estimated covariance matrix to build the minimum-variance portfolio from the MSCI USA universe, but subject to constraints: sector and single-stock weights are bounded relative to the parent index, and turnover is capped. The result is a fund that considers correlations between holdings, not just each stock's standalone volatility. A moderately volatile stock that diversifies the book can earn a place USMV; SPLV would never look at it.
That distinction — standalone ranking versus constrained covariance optimization — is the entire story. For a broader treatment of why factor construction details compound over time, the discussion of Fama–French factor investing is a useful companion.
The data
| Metric | USMV | SPLV |
|---|---|---|
| Name | iShares MSCI USA Min Vol Factor | Invesco S&P 500 Low Volatility |
| Expense ratio | 0.15% | 0.25% |
| AUM | $23.1B | $6.9B |
| Inception | 2011-10-18 | 2011-05-05 |
| Distribution yield | 1.5% | 2.2% |
| 5Y CAGR | 7.4% | 5.7% |
| 10Y CAGR | 9.9% | 8.2% |
| 5Y annualized volatility | 12.3% | 12.5% |
| 5Y max drawdown | −17.9% | −17.3% |
Expense ratios and AUM are from the issuer fact sheets (iShares USMV; Invesco SPLV). Return, volatility, and drawdown figures are computed from yfinance price history pulled 2026-06-08.
Realized risk: nearly identical, by different routes
The first thing the data dismantles is the intuition that SPLV — which mechanically holds the lowest-volatility names — should be the smoother fund. Over the trailing five years SPLV's annualized volatility was 12.5% against USMV's 12.3%, and its maximum drawdown of −17.3% was only marginally shallower than USMV's −17.9%. These are rounding-error differences. Two funds with very different construction logic produced essentially the same realized risk profile.
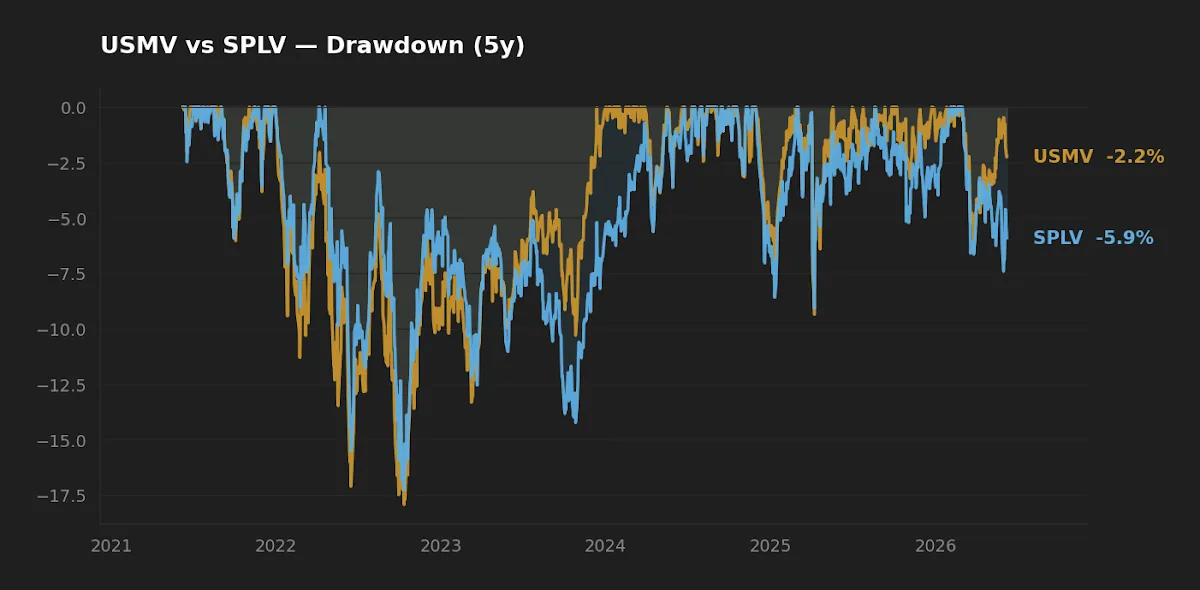
Why does the optimizer not win clearly on risk? Because both funds were fighting the same 2022 environment, and that environment was unkind to the specific sectors a naive low-vol screen loves. When rates rose sharply, utilities and staples — bond-proxy sectors that screen as "calm" on trailing price volatility — sold off alongside everything else. A model that ranks on standalone volatility cannot see that a quiet stock has become a concentrated interest-rate bet. USMV's sector constraints diluted that exposure; SPLV's quarterly rebalance leaned into it. The drawdowns ended up similar, but the path and the underlying exposures were not.
SPLV's higher yield is not a free coupon — it is the signature of a portfolio that drifts toward rate-sensitive sectors, which means part of its "defense" is really a bet on the rate cycle.
The yield tell, and the rate-sensitivity it implies
The 2.2% distribution yield on SPLV versus 1.5% on USMV is the most informative number in the table, and it is easy to misread as a point in SPLV's favor. The gap is not income generosity — it is a structural tell. SPLV's unconstrained screen repeatedly concentrates in utilities, staples, and other low-beta, higher-yielding sectors. Those sectors carry equity duration: their valuations are unusually sensitive to the level of long-term rates.
With the federal funds rate at 3.63% (FRED, asof 2026-05-01) and CPI still running near 3.9% year over year (FRED, asof 2026-04-01), the regime has not been the falling-rate tailwind that flattered bond-proxy equities through most of the 2010s. That backdrop is consistent with what the realized returns show: SPLV trailed USMV by roughly 1.7 percentage points per year over five years and by about 1.7 points per year over ten. Initially I expected the two to converge once you adjusted for fee — the 0.10% expense gap explains almost none of a 170-basis-point annual return difference. The bulk of it is composition, not cost.
This is the asymmetry the headline drawdown numbers hide. SPLV looks like a defensive equity fund, but a non-trivial share of its behavior is a wager on the direction of rates. In a renewed easing cycle that wager could pay; in the cycle we actually got, it did not. Readers thinking about when defense is worth its opportunity cost may find the note on strategic cash and risk management a useful frame.
Cost, scale, and implementation friction
USMV charges 0.15% against SPLV's 0.25% — a 0.10% gap. Over decades that is real but modest; it is not the deciding factor here. The more practical implementation differences are AUM and turnover. USMV's $23.1B base versus SPLV's $6.9B means tighter secondary-market spreads and deeper liquidity for the iShares fund, which matters for larger positions and for anyone trading around volatile sessions. Neither fund is small enough to raise closure risk.
SPLV's quarterly, constraint-free rebalance also generates more sector turnover than USMV's capped, optimizer-driven reconstitution. Higher turnover in a taxable account can raise the share of short-term or non-qualified distributions, though both funds have historically distributed mostly qualified dividends. For tax-sensitive holders, USMV's lower turnover is a mild structural advantage. Investors weighing low-vol against a plain market-cap core can contrast both with the VOO / MTUM / QUAL smart-beta comparison.
Scoreboard
| Category | Edge | Why |
|---|---|---|
| Cost | USMV | 0.15% vs 0.25%; 0.10% gap |
| Realized risk (5Y) | Tie | 12.3% vs 12.5% vol; −17.9% vs −17.3% drawdown |
| Realized return (5Y / 10Y) | USMV | 7.4% vs 5.7%; 9.9% vs 8.2% |
| Suitability | Depends | USMV for a constrained broad-market core; SPLV for a concentrated low-beta / rate-cycle tilt |
FAQ
Is USMV just a cheaper version of SPLV?
No. They are different strategies that happen to share a goal. USMV optimizes for minimum portfolio variance using correlations and sector constraints; SPLV ranks individual stocks by standalone volatility and holds the calmest 100. The lower fee is incidental to that design gap.
Why did the "lower volatility" fund not have lower volatility?
Over the trailing five years SPLV's realized volatility (12.5%) was essentially equal to USMV's (12.3%). Ranking stocks by past volatility does not guarantee a low-volatility portfolio, because it ignores how holdings move together and lets the fund concentrate in a few rate-sensitive sectors.
Why does SPLV yield more?
Its unconstrained screen tilts toward utilities and consumer staples, which tend to carry higher dividend yields. The 2.2% vs 1.5% gap reflects that sector composition — and the interest-rate sensitivity that comes with it — rather than a deliberate income mandate.
Does the 0.10% fee difference explain the return gap?
No. SPLV trailed USMV by roughly 1.7 percentage points per year over five years. A 0.10% expense difference accounts for only a sliver of that; the rest is composition and the rate regime.
Which is more tax-efficient in a taxable account?
USMV's lower turnover gives it a mild edge. Both have historically distributed mostly qualified dividends, but SPLV's quarterly, constraint-free rebalance moves more between sectors, which can raise realized distributions.
What this comparison can and can't tell you
The return and risk figures cover a trailing five- and ten-year window dominated by one major stress event — the 2022 rate shock — plus a long preceding bull market. That is a single macro regime in the sense that matters: we have not observed how these two construction methods diverge in a deflationary recession, a sustained falling-rate environment, or a credit-driven crisis. Five years of monthly data is a small sample for drawing conclusions about tail behavior, and trailing volatility is backward-looking by construction. The yield-as-rate-bet mechanism described above is an inference from sector composition, not a controlled experiment. Treat the realized gap as evidence, not proof.
Scenarios where each fund fits
Reader in their 30s, 401(k)-only, wants one low-vol equity sleeve: USMV's broader, constrained book and lower fee make it the more diversified default for a long-horizon core position.
Reader who explicitly wants a low-beta, income-leaning tilt and has a view that rates fall: SPLV's concentration in bond-proxy sectors is the more direct expression — but it should be held as a deliberate bet, not as a generic "safe" equity fund.
Taxable-account holder optimizing for after-tax compounding: USMV's lower turnover is the structurally cleaner choice.
Editor's read
If forced to pick one for a long-horizon low-volatility core, the editor leans toward USMV. The optimizer's sector constraints meaningfully reduce the risk that "low volatility" quietly becomes "concentrated rate bet," and over five and ten years that discipline coincided with both lower fees and higher realized return at near-identical volatility. SPLV remains the more interesting instrument for an investor who actually wants the bond-proxy tilt and is willing to name it as such — but that is a satellite decision, not a default core.
The editor holds neither USMV nor SPLV at the time of writing.
Key takeaways
- USMV (constrained minimum-variance optimizer) and SPLV (unconstrained lowest-volatility ranking) are different strategies, not two prices for the same thing.
- Realized five-year volatility was nearly identical (12.3% vs 12.5%); the ranking approach did not produce a smoother fund.
- USMV outpaced SPLV by ~1.7 percentage points per year over both five and ten years — composition, not the 0.10% fee gap, drove the difference.
- SPLV's higher 2.2% yield signals a tilt toward rate-sensitive bond-proxy sectors, making part of its "defense" a bet on the rate cycle.
- USMV's lower turnover and larger AUM give it edges in tax efficiency and liquidity for a long-term core role.
Methodology: Price, return, volatility, and drawdown figures computed from yfinance daily history, pulled 2026-06-08; five-year and ten-year windows ending on that date. Expense ratio, AUM, and yield from iShares and Invesco fact sheets. Macro figures from FRED (federal funds rate asof 2026-05-01; CPI year-over-year asof 2026-04-01).
This article is for educational purposes and does not constitute personalized financial advice. See our Disclaimer.