
Photo by Alexandr Podvalny on Unsplash
The short version
- VT is not "international" — it is roughly 60% US already, so the real choice is 100% US versus a 60/40 US/ex-US blend in one ticker.
- Over the trailing window VTI outpaced VT (12.3% vs 10.6% 5Y CAGR), but that gap is a record of a single US-led regime, not a property of the funds.
- Bottom line: VTI is the cleaner, cheaper US core; VT buys a rules-based, self-rebalancing global weight for investors who would rather not forecast which region wins next.
The question behind "VT vs VTI" is usually framed as a binary: do you diversify globally, or do you stay home? That framing is misleading. Vanguard Total World Stock (VT) already holds the US at roughly its global market-capitalization weight — around three-fifths of the fund. So the practical decision is not "US or the world." It is "100% US, or about 60% US plus 40% everywhere else, packaged so the weights rebalance themselves." What that extra 40% actually adds — and what it has cost over the trailing decade — is the subject worth examining.
Context: two funds, one nested inside the other
VTI (Vanguard Total Stock Market) holds essentially the entire investable US equity market — roughly 3,600+ holdings spanning mega-cap down to micro-cap. VT (Vanguard Total World Stock) holds that same US market and developed and emerging markets outside the US, weighted by capitalization, for something north of 9,000 holdings. In a literal sense, VTI is a large slice of VT.
This nesting matters because it changes how you read the performance gap. When VTI beats VT, it is not because VTI "won" against a separate competitor. It is because the ~40% of VT sitting outside the US dragged on the blend. The comparison is really a referendum on ex-US equity over the measured window. For the long-horizon investor weighing how much international exposure belongs in a core sleeve, this is the same question explored in the analysis of what international diversification actually adds to a US-only core — VT just answers it inside a single ticker instead of two.
The data
| Metric | VT (Total World) | VTI (Total US) |
|---|---|---|
| Expense ratio | 0.06% | 0.03% |
| AUM | $95.3B | $2,308.9B ($2.31T) |
| Inception | 2008-10-09 | 2000-11-13 |
| SEC / distribution yield | 1.6% | 1.0% |
| 5Y CAGR | 10.6% | 12.3% |
| 10Y CAGR | 12.5% | 14.8% |
| 5Y volatility (annualized) | 16.1% | 17.4% |
| 5Y max drawdown | -26.4% | -25.4% |
Return, volatility, and drawdown figures are computed from daily adjusted-close prices via yfinance (pulled 2026-06-08); expense ratio, AUM, yield, and inception are from the Vanguard issuer fact sheets for VT and VTI. The 5Y and 10Y CAGR figures cover the windows ending at the pull date.
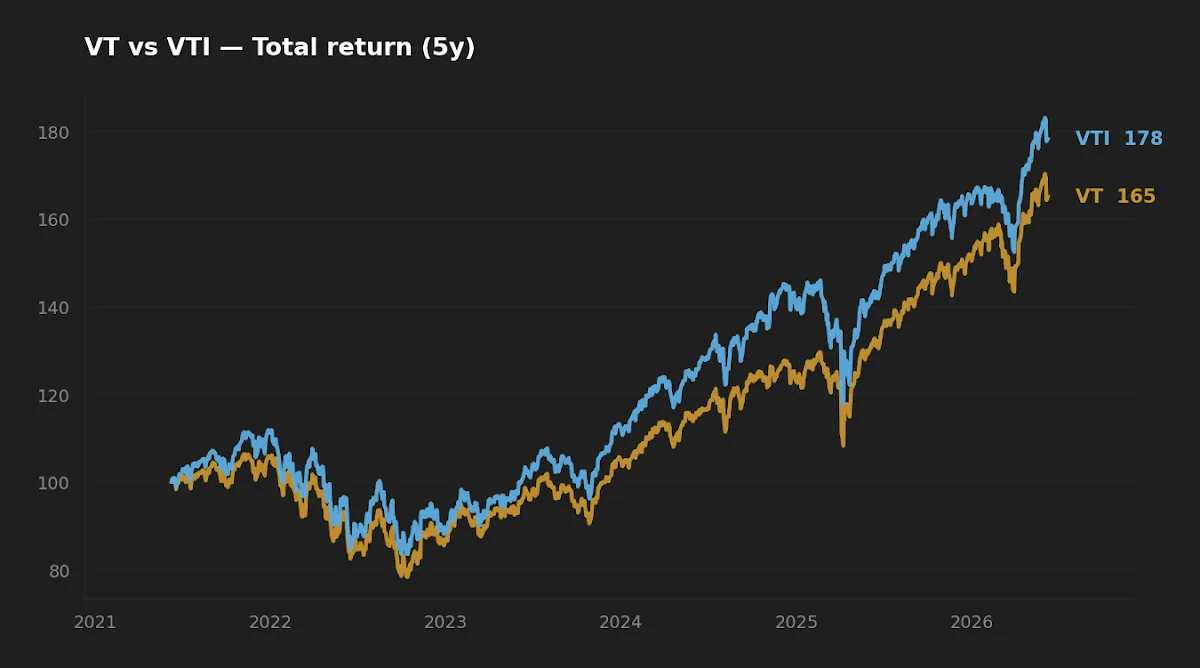
What the 1.8-point CAGR gap is really measuring
VTI's trailing 5Y CAGR of 12.3% sits 1.8 percentage points above VT's 10.6%; at 10 years the gap widens to 2.3 points (14.8% vs 12.5%). Compounded, that is large — a difference that snowballs over decades, as the math in 30 years of realistic index compounding makes plain.
But here is the discipline the number demands: a fee gap of only 0.03% explains almost none of it. VTI is three basis points cheaper. The other ~177 basis points of annual return difference is not cost — it is the realized return of ex-US equities relative to US equities over a specific, single regime. The trailing decade has been a period of exceptional US outperformance, led by a handful of mega-cap technology names whose weight in VTI is far heavier than their weight in a globally diversified VT.
That distinction is everything. The fee gap is a structural, forward-looking certainty: VTI will always carry three fewer basis points of drag. The return gap is a backward-looking artifact of which region happened to win. Reading the second as if it were as durable as the first is the data-mining error in its most common retail form — extrapolating a single-regime result into a law.
The three-basis-point fee gap is the only part of VTI's lead you can count on repeating. The other 177 basis points are a record of which region won, not a promise that it will keep winning.
The realized-risk asymmetry the averages hide
Conventional wisdom says diversification lowers risk. The data half-confirms it and half-contradicts it, and the contradiction is the more instructive part.
On annualized volatility, VT behaved as theory predicts: 16.1% versus VTI's 17.4%. Spreading across thousands of additional non-US holdings, with imperfectly correlated currencies and regional cycles, did dampen day-to-day variance. So far, so textbook.
On maximum drawdown — the peak-to-trough loss that actually tests an investor's behavior in stress — VT was worse: -26.4% versus VTI's -25.4%. The globally diversified fund fell slightly harder at the bottom despite its lower everyday volatility. This is the asymmetry the headline numbers bury, and the reason matters: in a genuine global risk-off event, cross-regional equity correlations converge toward one. Diversification that smooths ordinary weeks does little when every market sells off together. The currency translation back to USD can deepen the hole rather than cushion it, because the dollar tends to strengthen in exactly those episodes.
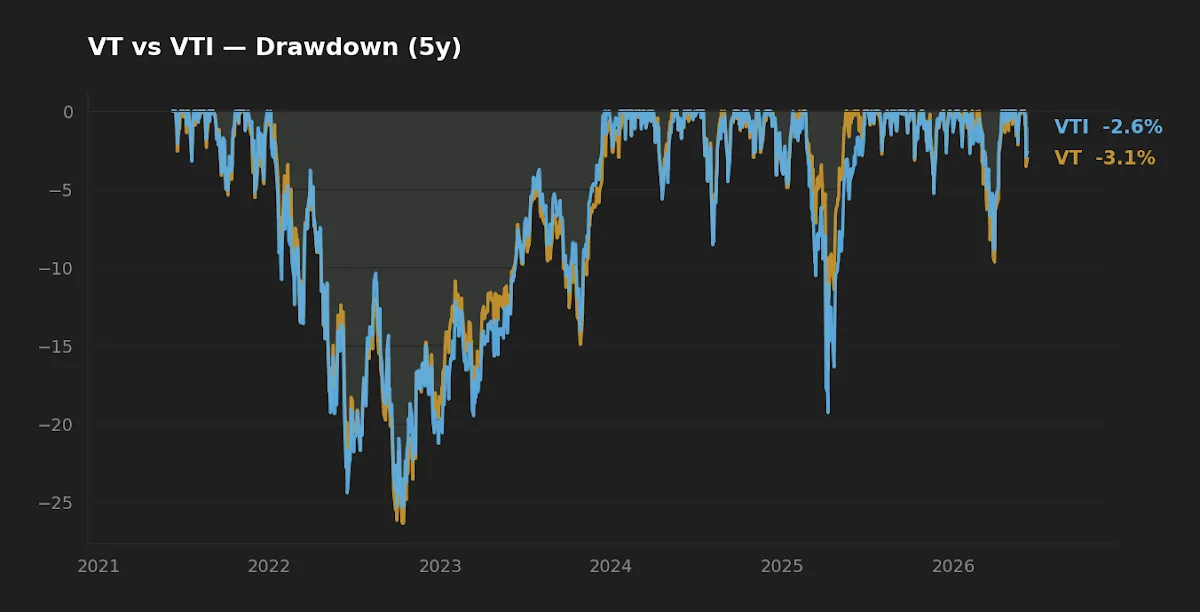
Initially I expected VT's broader holdings to clip the worst of the drawdown. They didn't, in this window. The lesson is not that diversification fails — it is that its benefit shows up in the texture of ordinary periods and in the dispersion of long-run outcomes, not in the depth of a synchronized crash. For an investor sizing their tolerance for a deep decline, the recovery arithmetic of a -30% drawdown applies to both funds in nearly equal measure.
Scale, implementation, and the cost of the global wrapper
Both funds are large enough that liquidity and bid-ask spread are non-issues for a buy-and-hold investor. VTI, at roughly $2.31T in AUM, is one of the largest funds in existence; VT, at $95.3B, is itself enormous. Closure risk for either is negligible.
The genuine implementation costs of VT are subtler. First, it carries a meaningfully larger share of foreign income, which complicates the qualified-versus-ordinary split of its distributions and introduces foreign tax considerations — VT's higher headline yield (1.6% vs 1.0%) is partly a value/dividend tilt in ex-US markets, not free income. Second, VT's three-basis-point fee premium buys you automatic, rules-based reweighting toward global market-cap weights. For an investor who would otherwise pair VTI with an ex-US fund and rebalance by hand, that is a convenience worth pricing honestly — it removes a decision and a transaction, at the cost of giving up the ability to set your own US/ex-US ratio. Investors who prefer to keep that lever, and to manage drift deliberately, may find the framework in ±15 vs ±25 rebalancing bands more to their taste with a two-fund build.
One macro footnote for context rather than forecast: with US CPI running 3.9% year-over-year and the federal funds rate at 3.63% (FRED, as of April and May 2026 respectively), the real-return backdrop is similar for both funds — neither global nor domestic equity escapes the same domestic inflation and rate regime when measured in dollars.
Scoreboard — winner by category
| Category | Edge | Why |
|---|---|---|
| Cost | VTI | 0.03% vs 0.06% — a permanent, structural three-bp advantage. |
| Realized return (trailing) | VTI | Higher 5Y and 10Y CAGR — but regime-dependent, not durable. |
| Realized risk (volatility) | VT | Lower annualized volatility from broader holdings. |
| Realized risk (drawdown) | VTI (narrowly) | Shallower 5Y max drawdown; correlations converged in stress. |
| Suitability as a one-fund core | VT | Self-rebalancing global weight removes a forecasting decision. |
FAQ
Is VTI included inside VT?
Effectively yes. VT holds the total US market at its global cap weight (roughly 60% of the fund) plus developed and emerging markets outside the US. VTI is the US portion on its own.
Why did VT underperform VTI over the past decade?
Because ex-US equities — the ~40% of VT that VTI doesn't hold — trailed US equities over that specific window, a period of strong US mega-cap leadership. The 2.3-point 10Y CAGR gap is a regime outcome, not a structural flaw in VT.
Does VT actually reduce risk?
It reduced annualized volatility (16.1% vs 17.4%) but not maximum drawdown (-26.4% vs -25.4%) over the trailing five years. Diversification smooths ordinary periods more than it cushions synchronized global selloffs, when correlations rise toward one.
Can I just buy VTI and add international later?
That is the two-fund alternative: VTI plus an ex-US fund, rebalanced manually. It gives you control over your US/ex-US ratio at the cost of a recurring decision and transaction. VT bundles that into one self-rebalancing holding for three extra basis points.
Which has the higher yield, and why?
VT, at roughly 1.6% versus VTI's 1.0%. The difference reflects higher dividend payout ratios in ex-US markets, not superior income generation — and VT's foreign income complicates the qualified-versus-ordinary tax split.
Key takeaways
- The choice is not US versus international — it is 100% US (VTI) versus a self-rebalancing ~60/40 US/ex-US blend (VT).
- VTI's only durable edge is its 0.03% lower fee; its trailing return lead is a single-regime artifact that may or may not persist.
- VT lowered volatility but not drawdown — diversification's benefit lives in ordinary periods and long-run dispersion, not in crash depth.
- VT's premium buys the removal of a forecasting decision; the two-fund route keeps that lever in your hands.
- Both are sound, low-cost cores; the honest differentiator is whether you want to set the global weight yourself or let market cap set it for you.
Editor's read
If forced to hold one as a long-horizon core, the editor leans VT — not because it has outperformed (it hasn't) but because a single, self-rebalancing global weight removes a recurring decision the editor does not believe anyone forecasts reliably, and three basis points is a fair price for that discipline. An investor with strong conviction in continued US leadership, or who wants to control the US/ex-US ratio deliberately, has an equally defensible case for VTI plus a separate ex-US sleeve.
Holdings disclosure: The editor holds a globally diversified equity core and does not hold either VT or VTI as a standalone position at the time of writing.
Methodology: Return, volatility, and drawdown computed from daily adjusted-close prices via yfinance, pulled 2026-06-08; trailing 5Y and 10Y windows end at the pull date. Expense ratio, AUM, distribution yield, and inception from Vanguard issuer fact sheets. Macro figures from FRED (federal funds rate as of 2026-05-01; CPI year-over-year as of 2026-04-01). Past performance does not predict future results, and the trailing window covers a single, US-favorable market regime.
This article is for educational purposes and does not constitute personalized financial advice. See our Disclaimer.